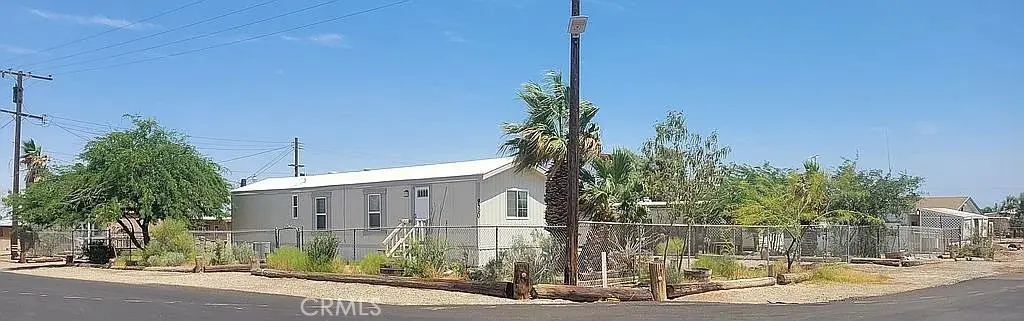
9590 Avenue B · Bombay Beach, CA
Flood risk 1/10 · Minimal
- FEMA flood zone
- X (unshaded)
- Chance of flooding over 30 yrs
- 0.0%
- Est. flood insurance / yr
- $507 – $1,088
Fire risk 1/10 · Minimal
- Est. fire insurance / yr
- $659 – $1,223
Heat risk 10/10 · Severe
- Hot days now (above 115°F)
- 6 days/yr
- Hot days in 30 yrs
- 15 days/yr
Wind risk 1/10 · Minimal
- Chance of severe wind over 30 yrs
- —
Air-quality risk 3/10 · Minor
- Unhealthy air days now
- 3 days/yr
- Unhealthy air days in 30 yrs
- 3 days/yr
Risk factors via First Street. Map © Google.
Why this score? — see what drove the B- grade
The composite is a weighted blend of 9 inputs, each scored 0–100. Each bar is that input's sub-score; the figure is the points it added to the 100-point composite (weight × sub-score).
- Cash flow +30.0/30.0
- DSCR +10.0/10.0
- 1% rule +7.6/10.0
- ARV discount +7.5/15.0
- Appreciation +5.0/10.0
- Rent growth +2.5/5.0
- Condition / age +2.5/5.0
- Livability +2.2/5.0
- Schools +1.4/10.0
$199,000
🖨 Deal sheet 📄 Offer letter ✓ Due diligence
Listing remarks
Bombay Beach is a magical little town on the shores of the Salton Sea. It's a small community with a big heart. The community center bustles with activity, everyone welcome. You can be as involved as you like. This amazing 2-lot property has to be seen to be appreciated! There are too many features to list. The main structure is a fully-furnished 1988 Fleetwood Broadmoor single-wide mobile home that is move-in ready. It features new paint, new carpet, and a central A/C and heating system. Sitting on a beautiful clean corner on two lots (totaling 140 x 80), the yard is landscaped and well-maintained with attractive native plants and trees. This property also features a tall 30' x 25' carport
Key facts
- Landscaped yard
- Tall carport
- 50-amp rv plug
Tags
Property features AI
Finance
- Other: Seller provided living area and year-built sources
- HOA & community: Street lighting; Sidewalks
Exterior
- Parking: RV access/parking available; Has parking
- Utilities: Public sewer; District/public water
- Home design: Manufactured house; Single-story; No accessory dwelling unit
- Construction: Certified 433a foundation
- Exterior features: Front yard; Back yard; Lot is level/flat; Has a view; No pool
Interior
- Kitchen: Kitchen (details not specified)
- Bedrooms: 2 bedrooms on the main level; Primary bedroom
- Bathrooms: 1 full bathroom (main level); Primary bathroom
- Heating & cooling: Central cooling
- Interior features: One-level home; Entry at main level; Main-level bedrooms and bathroom
- Laundry & utility: Laundry inside the home
Neighborhood map
What this means for you Summary
Snapshot
- This is a 2-bed/1.0-bath land listed at $199k.
Deal economics
- At list price, monthly cash flow is $757 ($9k/yr) — positive.
- The deal already cash-flows at list — no discount required.
- Meets the 1% rule at list price ($2k rent vs $199k).
- Recommended offer: $193k (3.0% below list) — sets the bar for market timing.
Location & tenants
- Location reads 44/100 on livability (#1,326 in CA) — a working-class tenant base; expect higher turnover. Strengths: cost of living A, housing B+; Watch: schools F, crime F, amenities F.
- Calipatria Unified (town): math 9% / reading 27% proficiency, ranked #485 of 517 in CA (top 94%) — low school quality limits family demand, transient renter base, plan for 1-2y turnover; 85% free/reduced lunch — lower-income household profile, screen leases tightly.
- Market conditions: 40 active listings in the ZIP; 1 comparable units currently listed for rent nearby; 271 units permitted in Imperial County in 2024 (112 in 5+ unit buildings).
Forward outlook
- In year one you build about $7k of equity ($1k loan paydown + $6k appreciation (3.0% local appreciation)).
- Imperial County population projected at +7% by 2050 — modest demand growth; plan on rents tracking national, not racing it.
- At projected returns (3.0% appreciation + 3.0% rent growth), your $56k cash investment doubles in ~4 years — after that, you're playing with house money.
- By year 5, paydown + projected appreciation supports a ~$32k cash-out refi (75% LTV) — recoverable capital for the next deal without selling this one.
Negotiation context
- It's been on market 32 days — a 3% lower offer ($193k) is reasonable based on typical stale-listing flexibility.
- Current owner paid $45k; list at $199k implies a 342% gain — meaningful room to come down on a strong offer.
Risks & watch-outs
- Climate carrying-cost: extreme-heat days projected 6→15/yr by 2055 (HVAC capex compounding) — expect insurance premiums to compound above CPI over the hold.
Questions for the listing agent
- It's been on market 32 days. Have you received any prior offers? Is the seller open to a 3% concession, seller financing, or rate buy-down credit?
- Is there a deadline driving the sale (1031 exchange, divorce, estate, relocation)? That informs how much negotiation room exists.
- Schools are F-rated, which usually means shorter tenancies and higher turnover. Who's the typical renter profile here, and what's been the actual vacancy rate?
- Crime grade is F in this area — have there been break-ins, vandalism, or insurance claims at this property in the last 3 years? What carrier currently insures it and at what premium?
- What's the average days-on-market for RENTAL listings here right now (not sales)? A rising rental-DOM trend means longer vacancies and softer asking-rent achievability than the comps imply.
- What's the recent tenant-quality profile in this submarket — average credit score on applications, eviction rate, late-payment / NSF rate, and stable-employment percentage? A property-management company in the area should have these aggregated.
- How much new for-sale + rental construction is in the pipeline within 1–3 miles? Heavy new supply typically softens prices + rents 12–24 months out; constrained supply supports both.
Investment metrics
- 1% rule
- 1.26% ✓
- Cap rate
- 10.86%
- Cash-on-cash
- 16.30%
- DSCR
- 1.73
- GRM
- 6.6
CMA / ARV
No comps found within radius.
Projected returns pro-forma
3.0% appreciation · 3.0% rent growth · sell at horizon
- IRR
- 22.8%
- Equity multiple
- 2.29×
- Total profit
- $72,109
- Equity at exit
- $89,479
- IRR
- 23.7%
- Equity multiple
- 4.39×
- Total profit
- $189,108
- Equity at exit
- $137,898
Cash invested: $55,720 (down + closing). Projections, not guarantees.
Landlord ↔ Tenant lean methodology
- Overall (STATE)
- 18 Strongly Tenant-Friendly
- State California
- 18 Strongly Tenant-Friendly · D+13
- County
- — inherits STATE
- City
- — inherits STATE
ZIP-level market 92257
- Active inventory
- 40
- Price-to-rent
- 6.6×
Monthly cashflow live
- Estimated rent
- $2,500 medium interval (Pro) →
- Mortgage (P&I)
- −$1,044
- Tax from tax record
- −$92 /mo · $1,101/yr
- Insurance
- −$83
- HOA
- −$0
- Vacancy / Maint / Mgmt
- −$525
- Net cashflow
- $757
Break-even live
UW: 25.0% down · 7.5% · 30yr · 1.5% tax · 5.0% vac · 8.0% maint · 8.0% mgmt
Financing live
Cash to close
- Down payment
- $49,750
- Closing costs
- $5,970
- Reserves months
- —
- Total cash needed
- —
Loan-product check · same deal, 3 products live
Conventional
25% down · 7.5% · 30yr
- Down + closing
- —
- Monthly P&I
- —
- Monthly cashflow
- —
- DSCR
- —
- Eligible?
- —
Personal DTI + credit; lowest rate.
DSCR
20% down · 8.5% · 30yr
- Down + closing
- —
- Monthly P&I
- —
- Monthly cashflow
- —
- DSCR
- —
- Eligible?
- —
No personal income docs; deal must DSCR.
Hard money
10% down · 12.0% · 12mo
- Down + closing
- —
- Monthly P&I
- —
- Monthly cashflow
- —
- DSCR
- —
- Eligible?
- —
Short-term bridge; refi at stabilization.
Rent comps 1 comps
| Address | Beds | Baths | Sqft | Rent | $/sqft | DOM | Units | Dist |
|---|---|---|---|---|---|---|---|---|
| 9550 Avenue F Niland, CA | 2.0 | 2.0 | 1280 | $2,500 | $1.95 | 3d | 1 | 0.26mi |
Listing history 20 events
-
2026-06-19days on market $199,000 Active 32 DOM
-
2026-06-18days on market $199,000 Active 31 DOM
-
2026-06-17days on market $199,000 Active 30 DOM
-
2026-06-16days on market $199,000 Active 29 DOM
-
2026-06-15days on market $199,000 Active 28 DOM
-
2026-06-14days on market $199,000 Active 26 DOM
-
2026-06-13days on market $199,000 Active 25 DOM
-
2026-06-10days on market $199,000 Active 23 DOM
-
2026-06-09days on market $199,000 Active 22 DOM
-
2026-06-08days on market $199,000 Active 21 DOM
-
2026-06-07days on market $199,000 Active 20 DOM
-
2026-06-05days on market $199,000 Active 17 DOM
-
2026-06-03days on market $199,000 Active 16 DOM
-
2026-06-02days on market $199,000 Active 15 DOM
-
2026-06-01days on market $199,000 Active 14 DOM
-
2026-05-31days on market $199,000 Active 13 DOM
-
2026-05-30days on market $199,000 Active 12 DOM
-
2026-05-18$199,000 Active
-
2022-04-20soldstatus $45,000
-
1994-09-27soldstatus $10,000
ⓘ Source: listings_history table (triggers on properties + properties_extension) + one-shot
backfill from property_details.listing_events for pre-trigger history.
Tax reassessment forecast CA · Resets to sale price
- Current annual tax
- $1,101 · $92/mo
- Projected year-2 tax
- $1,512 · $126/mo
- Expected delta
- +$411/yr (+$34/mo · 37.3%)
ⓘ Screening estimate from a state-policy table — verify with the county assessor before closing.
Climate risk First Street
- Flood 1/10 Low FEMA zone X (unshaded) · 0% chance over 30 yrs
- Wildfire 1/10 Low
- Heat 10/10 Extreme 6 d/yr ≥115°F today · 15 d/yr by 30 yrs out
- Wind 1/10 Low
- Air quality 3/10 Moderate 3 unhealthy d/yr today · 3 by 30 yrs out
Nearby sold comps map
Loading sold comps map…
Walkable amenities ~0.75 mi
Loading nearby amenities…
Taxation est. · year 1
- Rental income
- $30,000
- − Mortgage interest
- −$11,147
- − Property taxes
- −$1,101
- − Insurance
- −$995
- − Repairs & maintenance
- −$2,400
- − Management
- −$2,400
- − Depreciation
- −$5,789
- Taxable income
- $6,167
- Est. tax owed @ 24.0%
- −$1,480
- After-tax cash flow
- $7,600/yr
For passive investors: Depreciation is non-cash, so a rental often shows a tax loss while cash-flowing — sheltering income. Rental losses are passive: they offset passive income freely, and up to $25,000/yr can offset ordinary (W-2) income if you actively participate and your MAGI is under $100k (phasing out to $0 by $150k); unused losses carry forward. On sale, claimed depreciation is recaptured at up to 25%, and gains may owe capital-gains tax (a 1031 exchange can defer both). Figures are a year-1 estimate at your 24.0% rate — not tax advice; consult a CPA.
Schools (NCES district)
- District
- Calipatria Unified
- NCES district ID
- 0606990
- Math proficiency
- 9% ▼ -18.00%
- Reading proficiency
- 27% ▼ -18.00%
- Median HH income
- $30,088
- Composite
- 14.28/100
- National rank
- #9446
- State rank
- #485 of 517 in CA
Livability — Bombay Beach
- Score
- 44/100
- State rank
- #1326
- US rank
- #26648
Category grades
Schools grade is shown separately in the Schools card above.
Census & demographics
- Census place
- Bombay Beach, CA
- Population (ZIP)
- 2,185
Population outlook (Imperial County) Hauer SSP2
- Today (2025)
- 186,713 people
- By 2030
- 190,022 · +1.8%
- By 2040
- 195,993 · +5.0%
- By 2050
- 199,534 · +6.9%
- By 2075
- 216,878 · +16.2%
- By 2100
- 352,705 · +88.9%
Race, ethnicity, and origin ACS 2023
- Neighborhood character
- Diverse neighborhood (Simpson 0.58)
- Race & ethnicity
- Hispanic / Latino 60% Two or more races 23% White 21% Black 12% Asian 3%
- Hispanic origin (detail)
- Mexican 59%
- Common ancestry
- Lithuanian 2% Iranian 1% Portuguese 1%
- Foreign-born
- 17% · Canada
- Languages at home
- 45% English-only · Spanish 52% Other Indo-European 3%
Political lean MEDSL · Imperial
- 2024 margin
- Toss-up / Even · D 48.3% · R 49.1% · Other 2.6%
- 2008→2024 swing
- -27.0pp toward R · 2008: 26.2pp · 2024: -0.9pp
- All cycles
- 2024: R+0.9 2020: D+24.4 2016: D+41.1 2012: D+28.8 2008: D+26.2
Not yet ingested
- Civics
- —
Market trends
- HPI YoY
- —
- Current HPI
- —
- Rent YoY
- —
- Metro
- —
- State GDP YoY
- ▲ 3.21%
- F500 in state
- 116
Industry mix (Fortune 500 HQ in CA)
| Industry | F500 HQs | Revenue |
|---|---|---|
| Technology | 27 | $1,492B |
|
||
| Financial Services | 3 | $174B |
|
||
| Retail | 3 | $44B |
|
||
| Insurance | 3 | $26B |
|
||
| Media / Entertainment | 2 | $115B |
|
||
| Pharmaceuticals / Biotech | 2 | $62B |
|
||
Price history
+1890.0% since first listed3 events — show timeline
- 2026-05-18 Listed $199,000 CRMLS
- 2022-04-20 Sold (Public Records) $45,000 Public Records
- 1994-09-27 Sold (Public Records) $10,000 Public Records
Property tax history
+2.9%/yrLatest (2025): $1,101 · -0.7% YoY. Source: county tax records.
Cash-flow waterfall
monthlySold comps — $/sqft
last 12 mo · ≤1 miLoading sold comps…