201 1st St · Clarksville, PA
Flood risk 10/10 · Severe
- FEMA flood zone
- X (shaded)
- Chance of flooding over 30 yrs
- 0.99%
- Est. flood insurance / yr
- $473 – $860
Fire risk 1/10 · Minimal
- Est. fire insurance / yr
- $511 – $949
Heat risk 4/10 · Minor
- Hot days now (above 98°F)
- 7 days/yr
- Hot days in 30 yrs
- 19 days/yr
Wind risk 2/10 · Minimal
- Chance of severe wind over 30 yrs
- —
Air-quality risk 2/10 · Minimal
- Unhealthy air days now
- 1 days/yr
- Unhealthy air days in 30 yrs
- 2 days/yr
Risk factors via First Street. Map © Google.
Why this score? — see what drove the B grade
The composite is a weighted blend of 9 inputs, each scored 0–100. Each bar is that input's sub-score; the figure is the points it added to the 100-point composite (weight × sub-score).
- Cash flow +30.0/30.0
- 1% rule +10.0/10.0
- DSCR +10.0/10.0
- ARV discount +7.5/15.0
- Appreciation +4.9/10.0
- Livability +3.2/5.0
- Schools +3.1/10.0
- Rent growth +2.5/5.0
- Condition / age +2.2/5.0
$29,800
🖨 Deal sheet (PDF) 📄 Offer letter ✓ Due diligence
Listing remarks
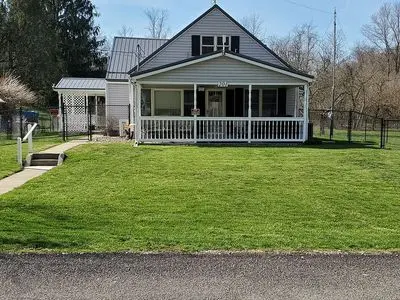
This 2-story Cape Cod home is nestled along Tenmile Creek. Move in ready, 3 bedrooms, 2 full bathrooms updated, convenient, dedicated laundry on the main floor. The first-floor bedroom offers the comfort of one-level living. Upstairs, you & acirc; & euro; & trade; ll find two generously sized bedrooms. Spacious updated kitchen equipped with stainless steel appliances, quartz countertops, and oversized island with bar seating, and plenty of cabinetry open to dining room. Bonus sunroom invites the outdoors in while offering privacy with custom blinds & acirc; & euro; & rdquo; a perfect space to relax year-round. Large front porch, expansive flat backyard, and path to
Key facts
- Built 1946
Neighborhood map
What this means for you Summary
Snapshot
- This is a 3-bed/2.0-bath other listed at $30k. Condition is rated fair.
Deal economics
- At list price, monthly cash flow is $679 ($8k/yr) — positive.
- The deal already cash-flows at list — no discount required.
- Meets the 1% rule at list price ($1k rent vs $30k).
Location & tenants
- Location reads 65/100 on livability (#1,163 in PA) — a middle-class / working-renter tenant base. Strengths: employment A+, cost of living A+, housing A+; Watch: crime C-, amenities F, commute F.
- Jefferson-Morgan SD (rural): math 25% / reading 47% proficiency, ranked #407 of 539 in PA (top 76%) — families likely to look elsewhere, expect single-tenant / working-renter base with shorter leases.
- Zoned schools: Jefferson-Morgan El Sch (math 22% / reading 48%, grade F, #1,042 of 1,518 statewide, top 69%, 417 students, 54% FRL); Jefferson-Morgan Ms/Hs (math 27% / reading 47%, grade F, #289 of 437 statewide, top 67%, 365 students, 44% FRL).
- Market conditions: 22 active listings in the ZIP; 30 units permitted in Greene County in 2024 (0 in 5+ unit buildings).
Forward outlook
- In year one you build about $151 of equity ($206 loan paydown + $-55 appreciation (-0.2% local appreciation)).
- Greene County population projected at -20% by 2050 — secular population decline; favor cash flow + early exit over multi-decade hold.
- At projected returns (-0.2% appreciation + 3.0% rent growth), your $8k cash investment doubles in ~2 years — after that, you're playing with house money.
Negotiation context
- Only 0 days on market — expect competitive offers; lowballing is unlikely to land.
Risks & watch-outs
- Watch-outs: flood insurance adds $56/mo; built in 1946 — expect roof / HVAC / electrical / plumbing capex.
- Climate carrying-cost: severe flood risk — expect insurance premiums to compound above CPI over the hold.
Questions for the listing agent
- Have any recent inspections been done? Can we get a copy of the seller's disclosures and any deferred-maintenance estimates?
- Built in 1946 — when were the roof, HVAC, electrical panel, plumbing, and water heater last replaced?
- What's the actual annual flood-insurance premium (NFIP or private), and is the property in a SFHA with mandatory coverage?
- Is there a deadline driving the sale (1031 exchange, divorce, estate, relocation)? That informs how much negotiation room exists.
- Schools are F-rated, which usually means shorter tenancies and higher turnover. Who's the typical renter profile here, and what's been the actual vacancy rate?
- What's the average days-on-market for RENTAL listings here right now (not sales)? A rising rental-DOM trend means longer vacancies and softer asking-rent achievability than the comps imply.
- What's the recent tenant-quality profile in this submarket — average credit score on applications, eviction rate, late-payment / NSF rate, and stable-employment percentage? A property-management company in the area should have these aggregated.
- How much new for-sale + rental construction is in the pipeline within 1–3 miles? Heavy new supply typically softens prices + rents 12–24 months out; constrained supply supports both.
Investment metrics
- 1% rule
- 4.00% ✓
- Cap rate
- 35.88%
- Cash-on-cash
- 105.68%
- DSCR
- 5.70
- GRM
- 2.1
CMA / ARV
No comps found within radius.
Projected returns pro-forma
-0.19% appreciation · 3.0% rent growth · sell at horizon
- IRR
- —
- Equity multiple
- 6.06×
- Total profit
- $42,186
- Equity at exit
- $8,377
- IRR
- —
- Equity multiple
- 12.54×
- Total profit
- $96,276
- Equity at exit
- $9,853
Cash invested: $8,344 (down + closing). Projections, not guarantees.
Landlord ↔ Tenant lean methodology
- Overall (STATE)
- 62 Landlord-Friendly
- State Pennsylvania
- 62 Landlord-Friendly · EVEN
- County
- — inherits STATE
- City
- — inherits STATE
ZIP-level market 15322
- Home prices YoY
- -0.2%
- Active inventory
- 22
- Price-to-rent
- 2.1×
Monthly cashflow live
- Estimated rent
- $1,191 medium interval (Pro) →
- Mortgage (P&I)
- −$156
- Tax est. 1.5%
- −$37 /mo · $447/yr
- Insurance
- −$12
- Flood insurance flood zone
- −$56 /mo · $666/yr
- HOA
- −$0
- Vacancy / Maint / Mgmt
- −$250
- Net cashflow
- $679
Break-even live
Sensitivity live
| Price | -10% $700 | -5% $690 | +0% $679 | +5% $669 | +10% $659 |
|---|---|---|---|---|---|
| Rent | -10% $585 | -5% $632 | +0% $679 | +5% $726 | +10% $773 |
| Rate | -1.0pp $694 | -0.5pp $687 | base $679 | +0.5pp $672 | +1.0pp $664 |
UW: 25.0% down · 7.5% · 30yr · 1.5% tax · 5.0% vac · 8.0% maint · 8.0% mgmt
Financing live
Cash to close
- Down payment
- $7,450
- Closing costs
- $894
- Reserves months
- —
- Total cash needed
- —
Loan-product check · same deal, 3 products live
Conventional
25% down · 7.5% · 30yr
- Down + closing
- —
- Monthly P&I
- —
- Monthly cashflow
- —
- DSCR
- —
- Eligible?
- —
Personal DTI + credit; lowest rate.
DSCR
20% down · 8.5% · 30yr
- Down + closing
- —
- Monthly P&I
- —
- Monthly cashflow
- —
- DSCR
- —
- Eligible?
- —
No personal income docs; deal must DSCR.
Hard money
10% down · 12.0% · 12mo
- Down + closing
- —
- Monthly P&I
- —
- Monthly cashflow
- —
- DSCR
- —
- Eligible?
- —
Short-term bridge; refi at stabilization.
Listing history 1 events
-
2026-05-26$29,800
ⓘ Source: listings_history table (triggers on properties + properties_extension) + one-shot
backfill from property_details.listing_events for pre-trigger history.
Climate risk First Street
- Flood 10/10 Extreme FEMA zone X (shaded) · 99% chance over 30 yrs
- Wildfire 1/10 Low
- Heat 4/10 Moderate 7 d/yr ≥98°F today · 19 d/yr by 30 yrs out
- Wind 2/10 Low
- Air quality 2/10 Low 1 unhealthy d/yr today · 2 by 30 yrs out
Nearby sold comps map
Loading sold comps map…
Walkable amenities ~0.75 mi
Loading nearby amenities…
Taxation est. · year 1
- Rental income
- $14,290
- − Mortgage interest
- −$1,669
- − Property taxes
- −$447
- − Insurance
- −$816
- − Repairs & maintenance
- −$1,143
- − Management
- −$1,143
- − Depreciation
- −$867
- Taxable income
- $8,205
- Est. tax owed @ 24.0%
- −$1,969
- After-tax cash flow
- $6,182/yr
For passive investors: Depreciation is non-cash, so a rental often shows a tax loss while cash-flowing — sheltering income. Rental losses are passive: they offset passive income freely, and up to $25,000/yr can offset ordinary (W-2) income if you actively participate and your MAGI is under $100k (phasing out to $0 by $150k); unused losses carry forward. On sale, claimed depreciation is recaptured at up to 25%, and gains may owe capital-gains tax (a 1031 exchange can defer both). Figures are a year-1 estimate at your 24.0% rate — not tax advice; consult a CPA.
Condition & rehab AI · 1 photo
This 2-story Cape Cod home is in fair condition with good kitchen and bathroom updates. It is move-in ready with a large front porch and expansive flat backyard. Minor exterior painting and landscaping improvements could further enhance its value.
Value-add opportunities
- Resale Paint exterior siding — Fresh paint can enhance curb appeal and property value.
- Rental Landscaping improvements — A well-maintained yard can attract more renters and increase rental value.
Renovation cost estimate screening
Value-add ROI direction
- Resale Paint exterior siding — Fresh paint can enhance curb appeal and property value. ↑
- Rental Landscaping improvements — A well-maintained yard can attract more renters and increase rental value. ↑
ⓘ Cost ranges are severity-bucket heuristics (US national rule-of-thumb). Get contractor quotes + a written scope before underwriting a rehab budget.
Schools (NCES district)
- District
- Jefferson-Morgan SD
- NCES district ID
- 4212390
- Math proficiency
- 25% ▼ -17.00%
- Reading proficiency
- 47% ▼ -10.00%
- Median HH income
- $46,767
- Composite
- 30.78/100
- National rank
- #6153
- State rank
- #407 of 539 in PA
Livability — Clarksville
- Score
- 65/100
- State rank
- #1163
- US rank
- #13443
Category grades
Schools grade is shown separately in the Schools card above.
Census & demographics
- Population (ZIP)
- 1,656
Population outlook (Greene County) Hauer SSP2
- Today (2025)
- 34,975 people
- By 2030
- 33,554 · -4.1%
- By 2040
- 30,615 · -12.5%
- By 2050
- 27,819 · -20.5%
- By 2075
- 21,678 · -38.0%
- By 2100
- 16,318 · -53.3%
Race, ethnicity, and origin ACS 2023
- Neighborhood character
- Predominantly White (95%)
- Race & ethnicity
- White 95% Two or more races 3% Hispanic / Latino 2% Black 1%
- Common ancestry
- Romanian 10% Italian 3% Scotch-Irish 2%
Political lean MEDSL · Greene
- 2024 margin
- Solid R (+44.8) · D 26.6% · R 71.5% · Other 1.9%
- 2008→2024 swing
- -44.4pp toward R · 2008: -0.4pp · 2024: -44.8pp
- All cycles
- 2024: R+44.8 2020: R+43.4 2016: R+41.7 2012: R+17.6 2008: R+0.4
Not yet ingested
- Civics
- —
Market trends
- HPI YoY
- ▼ -0.19%
- Current HPI
- 107.8618
- Rent YoY
- —
- Metro
- —
- State GDP YoY
- ▲ 1.68%
- F500 in state
- 34
Industry mix (Fortune 500 HQ in PA)
| Industry | F500 HQs | Revenue |
|---|---|---|
| Healthcare | 2 | $309B |
|
||
| Insurance | 2 | $27B |
|
||
| Telecommunications / Media | 1 | $124B |
|
||
| Industrial Distribution | 1 | $22B |
|
||
| Financial Services | 1 | $20B |
|
||
| Chemicals / Materials | 1 | $18B |
|
||
Price history
1 event — show timeline
- 2026-05-26 Listed $29,800 FSBO.com
Cash-flow waterfall
monthlySold comps — $/sqft
last 12 mo · ≤1 miLoading sold comps…