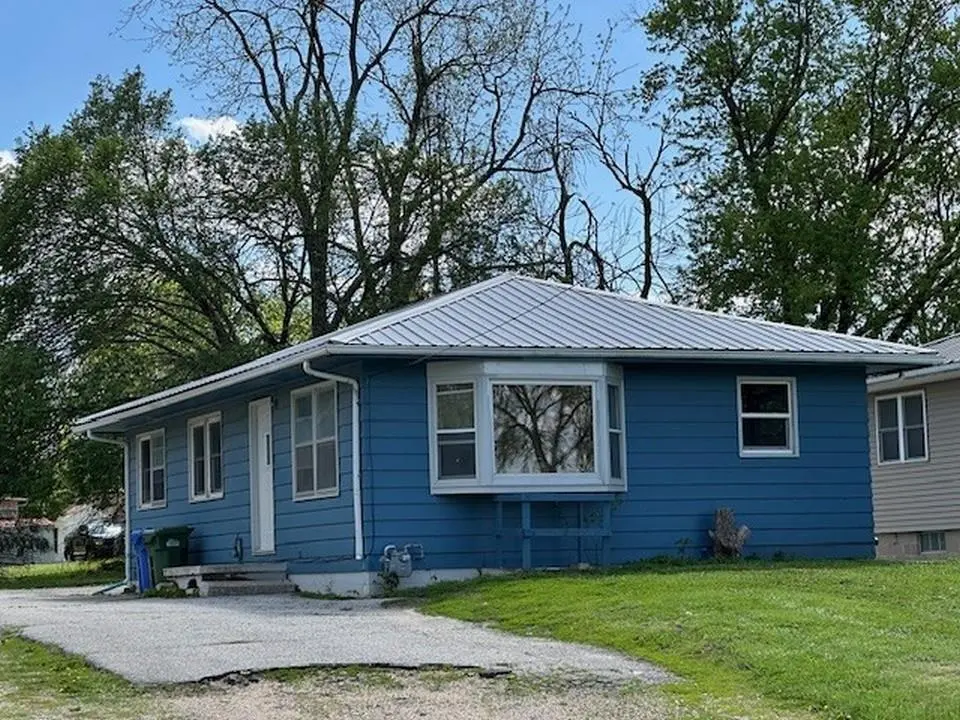
1319 NW 5th Ave · Waverly, IA
Flood risk 1/10 · Minimal
- FEMA flood zone
- X (unshaded)
- Chance of flooding over 30 yrs
- 0.0%
- Est. flood insurance / yr
- $473 – $860
Fire risk 3/10 · Minor
- Est. fire insurance / yr
- $902 – $1,676
Heat risk 3/10 · Minor
- Hot days now (above 102°F)
- 7 days/yr
- Hot days in 30 yrs
- 16 days/yr
Wind risk 2/10 · Minimal
- Chance of severe wind over 30 yrs
- —
Air-quality risk 1/10 · Minimal
- Unhealthy air days now
- 0 days/yr
- Unhealthy air days in 30 yrs
- 0 days/yr
Risk factors via First Street. Map © Google.
Why this score? — see what drove the B+ grade
The composite is a weighted blend of 9 inputs, each scored 0–100. Each bar is that input's sub-score; the figure is the points it added to the 100-point composite (weight × sub-score).
- Cash flow +30.0/30.0
- ARV discount +15.0/15.0
- DSCR +10.0/10.0
- 1% rule +8.6/10.0
- Schools +6.6/10.0
- Livability +4.3/5.0
- Rent growth +2.5/5.0
- Condition / age +2.5/5.0
- Appreciation +0.0/10.0
$127,500
🖨 Deal sheet 📄 Offer letter ✓ Due diligence
Listing remarks MLS
This home has been used as a rental and has great rental income but also has potential to be a great family home! 5 bedrooms! Call for your private showing today!
Key facts
- Value add potential
- Flexible floor plan
- Eat in kitchen
Tags
Property features AI
Exterior
- Parking: No designated parking
- Security: Smoke detectors
- Utilities: Public water; Public sewer
- Home design: Single-family residence; One story
- Construction: Wood siding; Below-grade finished area present
- Exterior features: Metal roof; Storage structure; Level to sloped lot; Concrete and paved road access; Sidewalks in the community
Interior
- Kitchen: Dishwasher; Free-standing range; Refrigerator; Microwave
- Bathrooms: 2 full bathrooms
- Heating & cooling: Central air; Ceiling fan(s); Forced air heating (natural gas)
- Interior features: Eat-in kitchen; Ceiling fans
- Laundry & utility: Washer hookup on lower level; Dryer included; Basement with interior entry (partially finished, block)
Neighborhood map
What this means for you Summary
Snapshot
- This is a 4-bed/1.0-bath single-family listed at $128k.
Deal economics
- At list price, monthly cash flow is $483 ($6k/yr) — positive.
- The deal already cash-flows at list — no discount required.
- Meets the 1% rule at list price ($2k rent vs $128k).
- Cap rate 10.8% vs local median 2.4% in Waverly — top-decile yield for the area; either an underpriced asset or a hidden risk that comps aren't pricing in. Stress-test before assuming the spread holds.
Location & tenants
- Location reads 86/100 on livability (#12 in IA, #406 nationally) — a professional / high-income tenant draw. Strengths: cost of living A+, housing A+, health & safety A+; Watch: amenities C-, commute F.
- Waverly-Shell Rock Community School District (town): math 79% / reading 74% proficiency, ranked #46 of 289 in IA (top 16%) — strong family-tenant draw, lease renewals of 3-5y typical; only 17% free/reduced lunch — higher-income household profile.
- Zoned schools: Waverly-Shell Rock Middle School (math 79% / reading 73%, grade A, #59 of 246 statewide, top 26%, 699 students, 22% FRL); Waverly-Shell Rock Senior High School (math 79% / reading 78%, grade A-, #50 of 336 statewide, top 15%, 771 students, 20% FRL) — zoned schools at 21% FRL track the district average.
- Market conditions: 126 active listings in the ZIP; 1 comparable units currently listed for rent nearby; 34 units permitted in Bremer County in 2024 (0 in 5+ unit buildings).
Forward outlook
- Local home prices are declining (-3.0%/yr); year-one equity from $882 of loan paydown is wiped out by about $4k of value loss. Plan a longer hold.
- Bremer County population projected at +4% by 2050 — modest demand growth; plan on rents tracking national, not racing it.
- At projected returns (-3.0% appreciation + 3.0% rent growth), your $36k cash investment doubles in ~8 years — after that, you're playing with house money.
Negotiation context
- Only 1 days on market — expect competitive offers; lowballing is unlikely to land.
- 2 sale attempts since 10y ago with the ask held roughly flat each time — persistent listings suggest the price (not the market) is what's stuck; bring a comps-based counter.
- Current owner paid $70k; list at $128k implies a 82% gain — meaningful room to come down on a strong offer.
Questions for the listing agent
- Built in 1963 — when were the roof, HVAC, electrical panel, plumbing, and water heater last replaced?
- Is there a deadline driving the sale (1031 exchange, divorce, estate, relocation)? That informs how much negotiation room exists.
- Schools are A-rated — typically a magnet for longer-tenancy family renters. What's the average tenant stay here, and is there a school-zone premium baked into asking?
- What's the average days-on-market for RENTAL listings here right now (not sales)? A rising rental-DOM trend means longer vacancies and softer asking-rent achievability than the comps imply.
- What's the recent tenant-quality profile in this submarket — average credit score on applications, eviction rate, late-payment / NSF rate, and stable-employment percentage? A property-management company in the area should have these aggregated.
- How much new for-sale + rental construction is in the pipeline within 1–3 miles? Heavy new supply typically softens prices + rents 12–24 months out; constrained supply supports both.
Investment metrics
- 1% rule
- 1.36% ✓
- Cap rate
- 10.84%
- Cash-on-cash
- 16.23%
- DSCR
- 1.72
- GRM
- 6.1
CMA / ARV
- ARV (on-the-fly)
- $175,698
- Comps found
- 12
Show comp detail 12 sales within ~0.75 mi
| Address | Dist | Beds/Ba | Sqft | Sold | Price | $/sf | Match |
|---|---|---|---|---|---|---|---|
| 413 NW 17th St | 0.20mi | 3/2.0 (-1) | 1,456 (+7%) | 10mo | $230,000 | $158 | 62 |
| 502 NW 5th Ave | 0.53mi | 3/1.0 (-1) | 1,347 (-1%) | 11mo | $144,300 | $107 | 59 |
| 2300 NW 3rd Ave | 0.63mi | 4/2.0 | 1,432 (+5%) | 1mo | $195,000 | $136 | 57 |
| 722 NW 3rd St St | 0.69mi | 3/2.0 (-1) | 1,362 (0%) | 5mo | $164,900 | $121 | 55 |
| 1825 NW 4th Ave | 0.29mi | 3/1.5 (-1) | 1,510 (+11%) | 8mo | $195,000 | $129 | 54 |
| 415 NW 5th St | 0.53mi | 4/2.0 | 1,498 (+10%) | 4mo | $155,000 | $103 | 52 |
| 710 SW 4th Ave | 0.67mi | 4/1.5 | 1,415 (+4%) | 11mo | $200,000 | $141 | 51 |
| 212 NW 2nd Ave Ave | 0.70mi | 4/1.5 | 1,513 (+11%) | 8mo | $164,500 | $109 | 40 |
| 607 NW 10th Ave | 0.54mi | 3/2.0 (-1) | 1,188 (-13%) | 6mo | $200,000 | $168 | 39 |
| 417 NW 2nd Ave | 0.59mi | 3/1.5 (-1) | 1,180 (-13%) | 6mo | $148,000 | $125 | 38 |
| 204 3rd Ave Ave NW | 0.70mi | 3/1.5 (-1) | 1,512 (+11%) | 8mo | $153,500 | $102 | 36 |
| 1002 NW 5th St | 0.64mi | 3/1.5 (-1) | 1,544 (+13%) | 16mo | $225,000 | $146 | 27 |
Match score weights: distance 35% · size 25% · config 20% · recency 20%. Top-matched comps best support the ARV.
Projected returns pro-forma
-3.0% appreciation · 3.0% rent growth · sell at horizon
- IRR
- 7.2%
- Equity multiple
- 1.28×
- Total profit
- $10,116
- Equity at exit
- $19,011
- IRR
- 16.6%
- Equity multiple
- 2.36×
- Total profit
- $48,516
- Equity at exit
- $11,024
Cash invested: $35,700 (down + closing). Projections, not guarantees.
Landlord ↔ Tenant lean methodology
- Overall (STATE)
- 83 Strongly Landlord-Friendly
- State Iowa
- 83 Strongly Landlord-Friendly · R+6
- County
- — inherits STATE
- City
- — inherits STATE
ZIP-level market 50677
- Active inventory
- 126
- Price-to-rent
- 6.1×
Monthly cashflow live
- Estimated rent
- $1,730 medium interval (Pro) →
- Mortgage (P&I)
- −$669
- Tax from tax record
- −$162 /mo · $1,946/yr
- Insurance
- −$53
- HOA
- −$0
- Vacancy / Maint / Mgmt
- −$363
- Net cashflow
- $483
Break-even live
UW: 25.0% down · 7.5% · 30yr · 1.5% tax · 5.0% vac · 8.0% maint · 8.0% mgmt
Financing live
Cash to close
- Down payment
- $31,875
- Closing costs
- $3,825
- Reserves months
- —
- Total cash needed
- —
Loan-product check · same deal, 3 products live
Conventional
25% down · 7.5% · 30yr
- Down + closing
- —
- Monthly P&I
- —
- Monthly cashflow
- —
- DSCR
- —
- Eligible?
- —
Personal DTI + credit; lowest rate.
DSCR
20% down · 8.5% · 30yr
- Down + closing
- —
- Monthly P&I
- —
- Monthly cashflow
- —
- DSCR
- —
- Eligible?
- —
No personal income docs; deal must DSCR.
Hard money
10% down · 12.0% · 12mo
- Down + closing
- —
- Monthly P&I
- —
- Monthly cashflow
- —
- DSCR
- —
- Eligible?
- —
Short-term bridge; refi at stabilization.
Rent comps 1 comps
| Address | Beds | Baths | Sqft | Rent | $/sqft | DOM | Units | Dist |
|---|---|---|---|---|---|---|---|---|
| 1260 Leitha Ter Waverly, IA | 3.0 | 2.5 | 1200 | $1,730 | $1.44 | 21d | 2 | 0.78mi |
Listing history 5 events
-
2026-05-28status Pending
-
2026-05-27$127,500 Active
-
2016-12-16soldstatus $69,875
-
2016-12-13soldstatus $70,000 163-char remark
Show marketing remark (163 chars)
This home has been used as a rental and has great rental income but also has potential to be a great family home! 5 bedrooms! Call for your private showing today!
-
2016-10-03$85,000 163-char remark
Show marketing remark (163 chars)
This home has been used as a rental and has great rental income but also has potential to be a great family home! 5 bedrooms! Call for your private showing today!
ⓘ Source: listings_history table (triggers on properties + properties_extension) + one-shot
backfill from property_details.listing_events for pre-trigger history.
Tax reassessment forecast IA · Partial reset (capped growth)
- Current annual tax
- $1,946 · $162/mo
- Projected year-2 tax
- $1,974 · $164/mo
- Expected delta
- +$28/yr (+$2/mo · 1.4%)
ⓘ Screening estimate from a state-policy table — verify with the county assessor before closing.
Climate risk First Street
- Flood 1/10 Low FEMA zone X (unshaded) · 0% chance over 30 yrs
- Wildfire 3/10 Moderate
- Heat 3/10 Moderate 7 d/yr ≥102°F today · 16 d/yr by 30 yrs out
- Wind 2/10 Low
- Air quality 1/10 Low 0 unhealthy d/yr today · 0 by 30 yrs out
Nearby sold comps map
Loading sold comps map…
Walkable amenities ~0.75 mi
Loading nearby amenities…
Taxation est. · year 1
- Rental income
- $20,760
- − Mortgage interest
- −$7,142
- − Property taxes
- −$1,946
- − Insurance
- −$638
- − Repairs & maintenance
- −$1,661
- − Management
- −$1,661
- − Depreciation
- −$3,709
- Taxable income
- $4,004
- Est. tax owed @ 24.0%
- −$961
- After-tax cash flow
- $4,832/yr
For passive investors: Depreciation is non-cash, so a rental often shows a tax loss while cash-flowing — sheltering income. Rental losses are passive: they offset passive income freely, and up to $25,000/yr can offset ordinary (W-2) income if you actively participate and your MAGI is under $100k (phasing out to $0 by $150k); unused losses carry forward. On sale, claimed depreciation is recaptured at up to 25%, and gains may owe capital-gains tax (a 1031 exchange can defer both). Figures are a year-1 estimate at your 24.0% rate — not tax advice; consult a CPA.
Schools (NCES district)
- District
- Waverly-Shell Rock Community School District
- NCES district ID
- 1930540
- Math proficiency
- 79% ▼ -3.00%
- Reading proficiency
- 74% ▬ 0.00%
- Median HH income
- $59,860
- Composite
- 65.73/100
- National rank
- #459
- State rank
- #46 of 289 in IA
Livability — Waverly
- Score
- 86/100
- State rank
- #12
- US rank
- #406
Category grades
Schools grade is shown separately in the Schools card above.
Census & demographics
- Census place
- Waverly, IA
- Population (ZIP)
- 12,655
Population outlook (Bremer County) Hauer SSP2
- Today (2025)
- 25,557 people
- By 2030
- 25,842 · +1.1%
- By 2040
- 26,206 · +2.5%
- By 2050
- 26,620 · +4.2%
- By 2075
- 27,635 · +8.1%
- By 2100
- 28,760 · +12.5%
Race, ethnicity, and origin ACS 2023
- Neighborhood character
- Predominantly White (90%)
- Race & ethnicity
- White 90% Two or more races 4% Hispanic / Latino 3% Black 2% Asian 2%
- Common ancestry
- Portuguese 5% Iranian 2% Romanian 1%
- Foreign-born
- 3% · Canada
- Languages at home
- 97% English-only · Spanish 1% Other Asian/Pacific 1%
Political lean MEDSL · Bremer
- 2024 margin
- Strong R (+22.2) · D 38.3% · R 60.5% · Other 1.3%
- 2008→2024 swing
- -31.5pp toward R · 2008: 9.3pp · 2024: -22.2pp
- All cycles
- 2024: R+22.2 2020: R+16.1 2016: R+13.9 2012: D+2.5 2008: D+9.3
Not yet ingested
- Civics
- —
Market trends
- HPI YoY
- ▼ -101.54%
- Current HPI
- 178.9673
- Rent YoY
- —
- Metro
- —
- State GDP YoY
- ▲ 2.48%
- F500 in state
- 4
Industry mix (Fortune 500 HQ in IA)
| Industry | F500 HQs | Revenue |
|---|---|---|
| Financial Services | 1 | $16B |
|
||
| Retail / Convenience | 1 | $15B |
|
||
Price history
+50.0% since first listed5 events — show timeline
- 2026-05-28 Pending — NEIRBR as distributed by MLS GRID
- 2026-05-27 Listed $127,500 NEIRBR as distributed by MLS GRID
- 2016-12-16 Sold (Public Records) $69,875 Public Records
- 2016-12-13 Sold (MLS) $70,000 NEIRBR as distributed by MLS GRID
- 2016-10-03 Listed $85,000 NEIRBR as distributed by MLS GRID
Property tax history
+1.5%/yrLatest (2025): $1,946 · +23.8% YoY. Source: county tax records.
Cash-flow waterfall
monthlySold comps — $/sqft
last 12 mo · ≤1 miLoading sold comps…