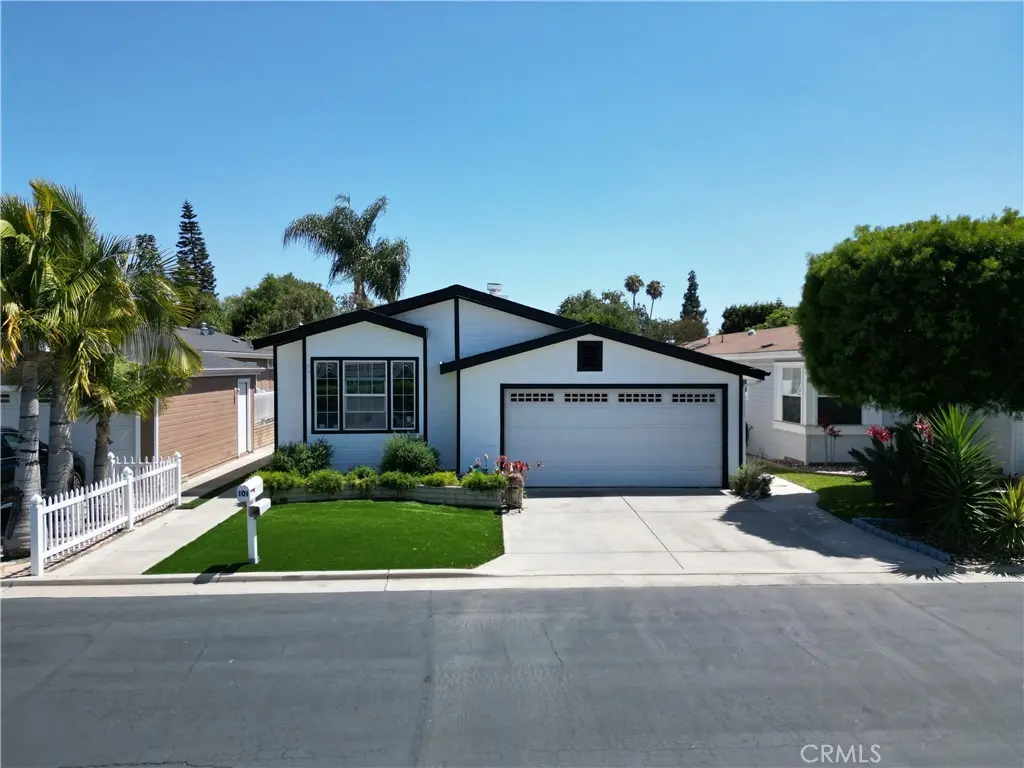
7271 Katella Ave #101 · Stanton, CA
Flood risk 1/10 · Minimal
- FEMA flood zone
- X (shaded)
- Chance of flooding over 30 yrs
- 0.0%
- Est. flood insurance / yr
- $507 – $1,088
Fire risk 1/10 · Minimal
- Est. fire insurance / yr
- $659 – $1,223
Heat risk 5/10 · Moderate
- Hot days now (above 89°F)
- 7 days/yr
- Hot days in 30 yrs
- 23 days/yr
Wind risk 1/10 · Minimal
- Chance of severe wind over 30 yrs
- —
Air-quality risk 5/10 · Moderate
- Unhealthy air days now
- 7 days/yr
- Unhealthy air days in 30 yrs
- 8 days/yr
Risk factors via First Street. Map © Google.
Why this score? — see what drove the D+ grade
The composite is a weighted blend of 9 inputs, each scored 0–100. Each bar is that input's sub-score; the figure is the points it added to the 100-point composite (weight × sub-score).
- Cash flow +22.3/30.0
- DSCR +7.2/10.0
- 1% rule +5.8/10.0
- Schools +3.5/10.0
- Livability +3.2/5.0
- Rent growth +3.1/5.0
- Condition / age +2.5/5.0
- ARV discount +0.0/15.0
- Appreciation +0.0/10.0
$344,900
🖨 Deal sheet 📄 Offer letter ✓ Due diligence
Key facts
- Central ac
- New exterior paint
- Artificial grass
Tags
Property features AI
Finance
- Other: Living area is estimated; Subdivision: La Lampara
- Financial info: Land lease of $1,488.33 per month (park-sourced); rent includes pool
- HOA & community: Pool and clubhouse amenities; Street lighting; Senior community; Park name: La Lampara; Manager approval required; Pets allowed with breed restrictions
Exterior
- Parking: Attached garage with 2 garage spaces; Driveway parking; 2 uncovered parking spaces (4 total parking spaces)
- Utilities: Public sewer; District/public water
- Home design: Single-story home; Mobile home remains on site; Mobile home dimensions approximately 23 ft by 56 ft
- Construction: Composition roof; Built by builder (year built source: Builder)
- Exterior features: Yard; In-ground community pool
Interior
- Kitchen: Gas water heater
- Flooring: Laminate flooring
- Bathrooms: 2 full bathrooms
- Heating & cooling: Central heating (furnace); Central cooling
- Interior features: Entry on the main level; Exhaust fan(s)
- Laundry & utility: Laundry room inside the home (individual room)
Neighborhood map
What this means for you Summary
Snapshot
- This is a 3-bed/2.0-bath manufactured listed at $345k.
Deal economics
- At list price, monthly cash flow is $571 ($7k/yr) — positive.
- The deal already cash-flows at list — no discount required.
- Meets the 1% rule at list price ($4k rent vs $345k).
- Cap rate 8.3% vs local median 2.5% in Stanton — top-decile yield for the area; either an underpriced asset or a hidden risk that comps aren't pricing in. Stress-test before assuming the spread holds.
Location & tenants
- Location reads 63/100 on livability (#468 in CA) — a middle-class / working-renter tenant base. Strengths: commute A+; Watch: schools C-, amenities D, health & safety D.
- Savanna Elementary (urban): math 34% / reading 45% proficiency, ranked #232 of 517 in CA (top 45%) — families likely to look elsewhere, expect single-tenant / working-renter base with shorter leases.
- Market conditions: Rents rising (+2.3%/yr); 48 active listings in the ZIP; 40 comparable units currently listed for rent nearby; rentals leasing fast (median 2d on market — plan ~1-2 weeks tenant-placement turnaround); solid renter incomes; 6,974 units permitted in Orange County in 2024 (3,839 in 5+ unit buildings).
- At $3,740/mo this rent would consume 52% of the median local household income ($86k/yr) (locally 1745% of renters already pay >50% of income on rent) — very limited rent-growth headroom before tenants either downsize or default.
Forward outlook
- Local home prices are declining (-3.0%/yr); year-one equity from $2k of loan paydown is wiped out by about $10k of value loss. Plan a longer hold.
- Orange County population projected at +14% by 2050 — modest demand growth; plan on rents tracking national, not racing it.
Negotiation context
- Only 13 days on market — expect competitive offers; lowballing is unlikely to land.
- 2 sale attempts with the ask held roughly flat each time — persistent listings suggest the price (not the market) is what's stuck; bring a comps-based counter.
Risks & watch-outs
- Climate carrying-cost: extreme-heat days projected 7→23/yr by 2055 (HVAC capex compounding) — expect insurance premiums to compound above CPI over the hold.
Questions for the listing agent
- Is there a deadline driving the sale (1031 exchange, divorce, estate, relocation)? That informs how much negotiation room exists.
- Crime grade is D in this area — have there been break-ins, vandalism, or insurance claims at this property in the last 3 years? What carrier currently insures it and at what premium?
- The area grade is low — what's the realistic commute time and amenity access for the typical tenant pool here? Any planned neighborhood developments (good or bad) we should know about?
- What's the average days-on-market for RENTAL listings here right now (not sales)? A rising rental-DOM trend means longer vacancies and softer asking-rent achievability than the comps imply.
- What's the recent tenant-quality profile in this submarket — average credit score on applications, eviction rate, late-payment / NSF rate, and stable-employment percentage? A property-management company in the area should have these aggregated.
- How much new for-sale + rental construction is in the pipeline within 1–3 miles? Heavy new supply typically softens prices + rents 12–24 months out; constrained supply supports both.
Investment metrics
- 1% rule
- 1.08% ✓
- Cap rate
- 8.28%
- Cash-on-cash
- 7.10%
- DSCR
- 1.32
- GRM
- 7.7
CMA / ARV
- ARV (on-the-fly)
- $288,288
- Comps found
- 12
Show comp detail 12 sales within ~0.75 mi
| Address | Dist | Beds/Ba | Sqft | Sold | Price | $/sf | Match |
|---|---|---|---|---|---|---|---|
| 7271 Katella Ave #100 | 0.00mi | 3/2.0 | 1,411 (-3%) | 15mo | $325,000 | $230 | 83 |
| 7271 Katella | 0.09mi | 3/2.0 | 1,344 (-8%) | 5mo | $152,500 | $113 | 79 |
| 7271 Katella Ave. Ave #10 | 0.08mi | 3/2.0 | 1,554 (+7%) | 8mo | $355,000 | $228 | 78 |
| 7271 Katella Ave. #66 | 0.09mi | 3/2.0 | 1,568 (+8%) | 6mo | $355,000 | $226 | 78 |
| 7271 Katella Ave #99 | 0.08mi | 3/2.0 | 1,265 (-13%) | 0mo | $257,000 | $203 | 74 |
| 7271 Katella Ave. Ave #21 | 0.09mi | 3/2.0 | 1,554 (+7%) | 13mo | $355,000 | $228 | 73 |
| 10550 Western Ave #3 | 0.49mi | 2/2.0 (-1) | 1,440 (-1%) | 2mo | $132,000 | $92 | 69 |
| 7271 Katella Ave #40 | 0.09mi | 2/2.0 (-1) | 1,512 (+4%) | 23mo | $299,000 | $198 | 65 |
| 10550 Western Ave #43 | 0.49mi | 2/2.0 (-1) | 1,568 (+8%) | 4mo | $210,000 | $134 | 56 |
| 10550 Western Ave #93 | 0.49mi | 3/2.0 | 1,568 (+8%) | 18mo | $310,000 | $198 | 50 |
| 7271 Katella Ave #97 | 0.08mi | 2/2.0 (-1) | 1,250 (-14%) | 23mo | $156,500 | $125 | 49 |
| 10550 Western Ave #94 | 0.49mi | 3/2.0 | 1,248 (-14%) | 23mo | $185,000 | $148 | 34 |
Match score weights: distance 35% · size 25% · config 20% · recency 20%. Top-matched comps best support the ARV.
Projected returns pro-forma
-3.0% appreciation · 2.33% rent growth · sell at horizon
- IRR
- -6.2%
- Equity multiple
- 0.77×
- Total profit
- $-21,953
- Equity at exit
- $51,426
- IRR
- 2.7%
- Equity multiple
- 1.18×
- Total profit
- $17,823
- Equity at exit
- $29,821
Cash invested: $96,572 (down + closing). Projections, not guarantees.
Landlord ↔ Tenant lean methodology
- Overall (STATE)
- 18 Strongly Tenant-Friendly
- State California
- 18 Strongly Tenant-Friendly · D+13
- County
- — inherits STATE
- City
- — inherits STATE
ZIP-level market 90680
- Rents YoY
- 2.3%
- Active inventory
- 48
- Price-to-rent
- 7.7×
Monthly cashflow live
- Estimated rent
- $3,740 high interval (Pro) →
- Mortgage (P&I)
- −$1,809
- Tax est. 1.5%
- −$431 /mo · $5,174/yr
- Insurance
- −$144
- HOA
- −$0
- Vacancy / Maint / Mgmt
- −$785
- Net cashflow
- $571
Break-even live
UW: 25.0% down · 7.5% · 30yr · 1.5% tax · 5.0% vac · 8.0% maint · 8.0% mgmt
Financing live
Cash to close
- Down payment
- $86,225
- Closing costs
- $10,347
- Reserves months
- —
- Total cash needed
- —
Loan-product check · same deal, 3 products live
Conventional
25% down · 7.5% · 30yr
- Down + closing
- —
- Monthly P&I
- —
- Monthly cashflow
- —
- DSCR
- —
- Eligible?
- —
Personal DTI + credit; lowest rate.
DSCR
20% down · 8.5% · 30yr
- Down + closing
- —
- Monthly P&I
- —
- Monthly cashflow
- —
- DSCR
- —
- Eligible?
- —
No personal income docs; deal must DSCR.
Hard money
10% down · 12.0% · 12mo
- Down + closing
- —
- Monthly P&I
- —
- Monthly cashflow
- —
- DSCR
- —
- Eligible?
- —
Short-term bridge; refi at stabilization.
Rent comps 40 comps
| Address | Beds | Baths | Sqft | Rent | $/sqft | DOM | Units | Dist |
|---|---|---|---|---|---|---|---|---|
| 7545 Katella Ave Stanton, CA | 1.0–2.0 | 1.0 | 900 | $3,053 | $3.39 | 1d | 7 | 0.23mi |
| 31907 Saint Joseph Ln Stanton, CA | 4.0 | 3.5 | 1800 | $4,950 | $2.75 | 1d | 1 | 0.31mi |
| 31909 Saint Joseph Ln Stanton, CA | 4.0 | 3.5 | 1825 | $4,950 | $2.71 | 1d | 1 | 0.31mi |
| 31911 Saint Joseph Ln Stanton, CA | 4.0 | 3.5 | 1825 | $4,950 | $2.71 | 1d | 1 | 0.31mi |
| 10600 Western Ave Stanton, CA | 2.0 | 1.0–2.0 | 915 | $2,475 | $2.70 | 1d | 2 | 0.44mi |
| 6972 Jonathan Ave Cypress, CA | 4.0 | 2.0 | 1635 | $6,000 | $3.67 | 2d | 1 | 0.44mi |
| 10511 Lexington St Unit C Stanton, CA | 2.0 | 1.5 | 900 | $2,300 | $2.56 | 1d | 1 | 0.48mi |
| 7684 Ruthann Ave Stanton, CA | 3.0 | 2.0 | 1000 | $3,650 | $3.65 | 2d | 1 | 0.49mi |
| 7051 Cerritos Ave Stanton, CA | 2.0 | 1.0 | 1000 | $2,545 | $2.54 | 1d | 1 | 0.60mi |
| 10361 Iona Way Stanton, CA | 3.0 | 1.5 | 1149 | $3,500 | $3.05 | 1d | 1 | 0.64mi |
| 7765 Beechwood Way Stanton, CA | 3.0 | 1.5 | 1232 | $3,750 | $3.04 | 1d | 1 | 0.67mi |
| 11466 Pinckney Way Cypress, CA | 3.0 | 2.5 | 1800 | $3,900 | $2.17 | 13d | 1 | 0.68mi |
| 11466 Pinckney Way Cypress, CA | 3.0 | 2.5 | 1799 | $3,900 | $2.17 | 2d | 1 | 0.68mi |
| 10321 Courtright Rd Stanton, CA | 3.0 | 2.0 | 1202 | $3,700 | $3.08 | 22d | 1 | 0.72mi |
| 10250 Masterson Ave Stanton, CA | 3.0 | 2.0 | 1590 | $3,750 | $2.36 | 1d | 1 | 0.79mi |
| 3208 W Ravenswood Dr Anaheim, CA | 3.0 | 2.0 | 1636 | $4,000 | $2.44 | 12d | 1 | 0.90mi |
| 6942 Santa Rita Ave Garden Grove, CA | 4.0 | 2.0 | 1650 | $4,500 | $2.73 | 43d | 1 | 1.02mi |
| 3427 W Ball Rd Anaheim, CA | 2.0 | 1.0 | 900 | $2,350 | $2.61 | 24d | 1 | 1.06mi |
| 6741 Ball Rd Buena Park, CA | 2.0 | 1.5 | 1000 | $2,495 | $2.50 | 1d | 1 | 1.16mi |
| 909 S Knott Ave Anaheim, CA | 1.0–2.0 | 1.0 | 880 | $2,695 | $3.06 | 1d | 1 | 1.18mi |
| 8052 Fillmore Dr Apt 3 Stanton, CA | 2.0 | 1.5 | 1000 | $2,250 | $2.25 | 2d | 1 | 1.19mi |
| 6351 Marcella Way Buena Park, CA | 4.0 | 2.5 | 1415 | $4,200 | $2.97 | 1d | 1 | 1.24mi |
| 10305 Eudora Ave Buena Park, CA | 4.0 | 2.0 | 1650 | $4,500 | $2.73 | 1d | 1 | 1.25mi |
| 6635 Vanguard Ave Garden Grove, CA | 4.0 | 2.0 | 1200 | $4,000 | $3.33 | 44d | 1 | 1.28mi |
| 11250 Dale St Garden Grove, CA | 1.0–2.0 | 1.0–2.0 | 848 | $2,710 | $3.20 | 2d | 9 | 1.29mi |
| 3625 W Savanna St Anaheim, CA | 2.0 | 2.0 | 1060 | $2,595 | $2.45 | 1d | 1 | 1.30mi |
| 704 S Knott Ave Anaheim, CA | 2.0 | 1.0 | 880 | $2,250 | $2.56 | 1d | 1 | 1.35mi |
| 12221 Beach Blvd Garden Grove, CA | 1.0–2.0 | 1.0–2.0 | 900 | $2,825 | $3.14 | 15d | 6 | 1.36mi |
| 2880 W Ball Rd Anaheim, CA | 1.0–2.0 | 1.0 | 894 | $2,850 | $3.19 | 1d | 5 | 1.37mi |
| 9951 Holder St Cypress, CA | 3.0 | 1.5 | 1200 | $3,395 | $2.83 | 1d | 3 | 1.40mi |
| 2828 W Ball Rd Unit N-36 Anaheim, CA | 2.0 | 2.0 | 880 | $2,795 | $3.18 | 16d | 1 | 1.42mi |
| 2828 W Ball Rd Unit D-10 Anaheim, CA | 2.0 | 2.0 | 880 | $2,805 | $3.19 | 16d | 1 | 1.42mi |
| 2828 W Ball Rd Unit G-11 Anaheim, CA | 2.0 | 2.0 | 880 | $2,850 | $3.24 | 16d | 1 | 1.42mi |
| 11871 Topaz Cir Garden Grove, CA | 3.0 | 2.0 | 1213 | $4,000 | $3.30 | 43d | 1 | 1.42mi |
| 2828 W Ball Rd Anaheim, CA | 2.0 | 1.0–2.0 | 880 | $2,760 | $3.14 | 1d | 3 | 1.42mi |
| 8300 Chapman Ave Stanton, CA | 1.0–2.0 | 1.0 | 860 | $2,545 | $2.96 | 1d | 9 | 1.43mi |
| 3 Bigsby Dr Stanton, CA | 3.0 | 3.0 | 1355 | $3,950 | $2.92 | 16d | 1 | 1.45mi |
| 33 Bigsby Dr Stanton, CA | 3.0 | 3.5 | 1625 | $3,950 | $2.43 | 43d | 1 | 1.45mi |
| 35 Bigsby Dr Stanton, CA | 3.0 | 3.0 | 1355 | $4,000 | $2.95 | 24d | 1 | 1.45mi |
| 3354 W Orange Ave Anaheim, CA | 2.0 | 1.0 | 1060 | $2,400 | $2.26 | 1d | 1 | 1.45mi |
Listing history 9 events
-
2026-06-18days on market $344,900 Active 13 DOM
-
2026-06-17days on market $344,900 Active 12 DOM
-
2026-06-16days on market $344,900 Active 11 DOM
-
2026-06-15days on market $344,900 Active 10 DOM
-
2026-06-13days on market $344,900 Active 8 DOM
-
2026-06-13days on market $344,900 Active 7 DOM
-
2026-06-09days on market $344,900 Active 4 DOM
-
2026-06-08days on market $344,900 Active 3 DOM
-
2026-06-07$344,900 Active 2 DOM
ⓘ Source: listings_history table (triggers on properties + properties_extension) + one-shot
backfill from property_details.listing_events for pre-trigger history.
Climate risk First Street
- Flood 1/10 Low FEMA zone X (shaded) · 0% chance over 30 yrs
- Wildfire 1/10 Low
- Heat 5/10 Major 7 d/yr ≥89°F today · 23 d/yr by 30 yrs out
- Wind 1/10 Low
- Air quality 5/10 Major 7 unhealthy d/yr today · 8 by 30 yrs out
Nearby sold comps map
Loading sold comps map…
Walkable amenities ~0.75 mi
Loading nearby amenities…
Taxation est. · year 1
- Rental income
- $44,883
- − Mortgage interest
- −$19,320
- − Property taxes
- −$5,174
- − Insurance
- −$1,724
- − Repairs & maintenance
- −$3,591
- − Management
- −$3,591
- − Depreciation
- −$10,033
- Taxable income
- $1,450
- Est. tax owed @ 24.0%
- −$348
- After-tax cash flow
- $6,507/yr
For passive investors: Depreciation is non-cash, so a rental often shows a tax loss while cash-flowing — sheltering income. Rental losses are passive: they offset passive income freely, and up to $25,000/yr can offset ordinary (W-2) income if you actively participate and your MAGI is under $100k (phasing out to $0 by $150k); unused losses carry forward. On sale, claimed depreciation is recaptured at up to 25%, and gains may owe capital-gains tax (a 1031 exchange can defer both). Figures are a year-1 estimate at your 24.0% rate — not tax advice; consult a CPA.
Schools (NCES district)
- District
- Savanna Elementary
- NCES district ID
- 0636030
- Math proficiency
- 34% ▼ -11.00%
- Reading proficiency
- 45% ▼ -5.00%
- Median HH income
- $60,278
- Composite
- 35.02/100
- National rank
- #5042
- State rank
- #232 of 517 in CA
Livability — Stanton
- Score
- 63/100
- State rank
- #468
- US rank
- #15945
Category grades
Schools grade is shown separately in the Schools card above.
Census & demographics
- Census place
- Stanton, CA
- County
- Orange County · 3,096,323 people
- City population
- 31,991
- Metro
- Los Angeles-Long Beach-Anaheim, CA
- Population (ZIP)
- 31,991
- Household income
- $85,592
- Rent vs Own
- Severe rent burden
- 1745.0
Population outlook (Orange County) Hauer SSP2
- Today (2025)
- 3,477,456 people
- By 2030
- 3,613,117 · +3.9%
- By 2040
- 3,835,945 · +10.3%
- By 2050
- 3,968,736 · +14.1%
- By 2075
- 4,097,053 · +17.8%
- By 2100
- 3,903,633 · +12.3%
Race, ethnicity, and origin ACS 2023
- Neighborhood character
- Diverse neighborhood (Simpson 0.64)
- Race & ethnicity
- Hispanic / Latino 50% Asian 27% White 17% Two or more races 12% Black 2% Native American 1%
- Hispanic origin (detail)
- Mexican 42%
- Common ancestry
- Italian 1% Iranian 0%
- Foreign-born
- 42% · Canada, Vietnam, South Korea
- Languages at home
- 35% English-only · Spanish 39% Vietnamese 17% Tagalog/Filipino 2%
Political lean MEDSL · Orange
- 2024 margin
- Toss-up / Even · D 49.7% · R 47.1% · Other 3.2%
- 2008→2024 swing
- +5.2pp toward D · 2008: -2.6pp · 2024: 2.6pp
- All cycles
- 2024: D+2.6 2020: D+9.0 2016: D+7.7 2012: R+8.3 2008: R+2.6
Not yet ingested
- Civics
- —
Market trends
- HPI YoY
- ▼ -529.54%
- Current HPI
- 447.9557
- Rent YoY
- ▲ 2.33%
- Metro
- Los Angeles-Long Beach-Anaheim, CA
- State GDP YoY
- ▲ 3.21%
- F500 in state
- 116
Industry mix (Fortune 500 HQ in CA)
| Industry | F500 HQs | Revenue |
|---|---|---|
| Technology | 27 | $1,492B |
|
||
| Financial Services | 3 | $174B |
|
||
| Retail | 3 | $44B |
|
||
| Insurance | 3 | $26B |
|
||
| Media / Entertainment | 2 | $115B |
|
||
| Pharmaceuticals / Biotech | 2 | $62B |
|
||
Price history
-2.8% since first listed6 events — show timeline
- 2026-06-05 Listed $344,900 CRMLS
- 2026-05-04 Listing Removed — CRMLS
- 2026-03-06 Price Changed $335,000 CRMLS
- 2026-01-27 Price Changed $349,000 CRMLS
- 2025-11-10 Listed $355,000 CRMLS
- 2025-11-07 Coming Soon — CRMLS
Property tax history
-2.3%/yrLatest (2025): $422 · +2.7% YoY. Source: county tax records.
Cash-flow waterfall
monthlySold comps — $/sqft
last 12 mo · ≤1 miLoading sold comps…