 🏷️ Likely Rental
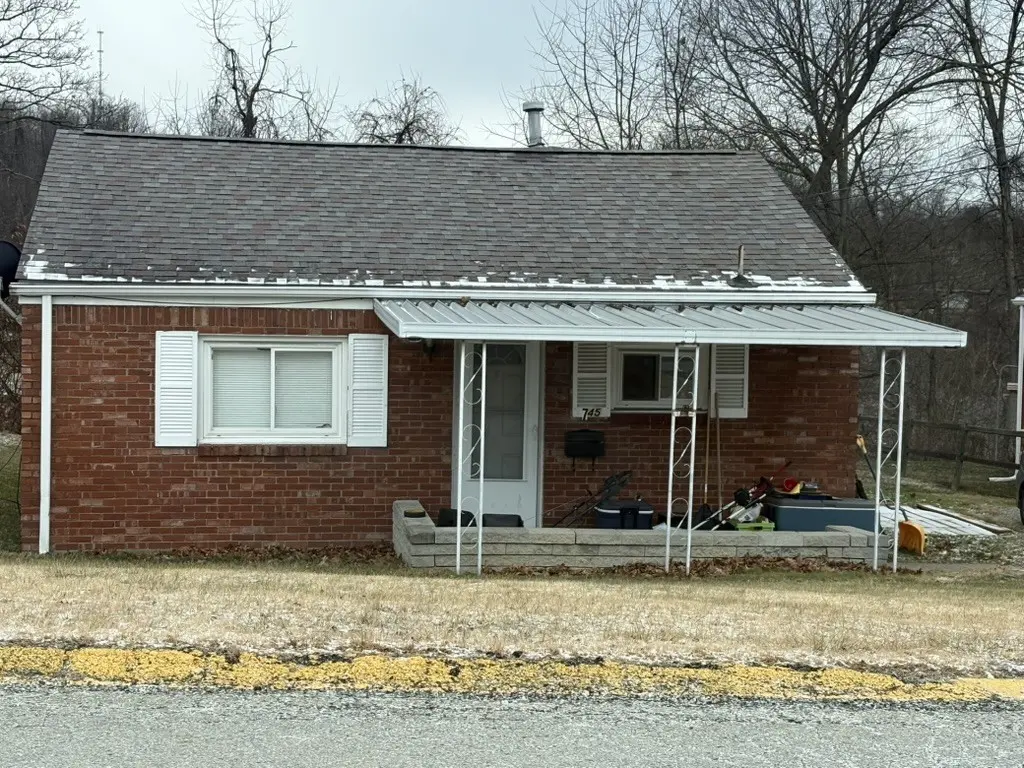
745 Memory Ln · Liberty, PA
Flood risk 1/10 · Minimal
- FEMA flood zone
- X (unshaded)
- Chance of flooding over 30 yrs
- 0.0%
- Est. flood insurance / yr
- $507 – $1,088
Fire risk 1/10 · Minimal
- Est. fire insurance / yr
- $511 – $949
Heat risk 3/10 · Minor
- Hot days now (above 97°F)
- 7 days/yr
- Hot days in 30 yrs
- 18 days/yr
Wind risk 2/10 · Minimal
- Chance of severe wind over 30 yrs
- —
Air-quality risk 5/10 · Moderate
- Unhealthy air days now
- 8 days/yr
- Unhealthy air days in 30 yrs
- 8 days/yr
Risk factors via First Street. Map © Google.
Why this score? — see what drove the B+ grade
The composite is a weighted blend of 9 inputs, each scored 0–100. Each bar is that input's sub-score; the figure is the points it added to the 100-point composite (weight × sub-score).
- Cash flow +26.1/30.0
- ARV discount +15.0/15.0
- DSCR +8.8/10.0
- 1% rule +7.6/10.0
- Appreciation +7.3/10.0
- Livability +3.6/5.0
- Schools +2.8/10.0
- Rent growth +2.5/5.0
- Condition / age +2.5/5.0
$90,000
🖨 Deal sheet (PDF) 📄 Offer letter ✓ Due diligence
Listing remarks
Investor opportunity with stable income potential. Solid home featuring 2 bedroom and 1 full bath with offstreet parking. Home is currently tenant-occupied. Do not disturb tenant. Property includes central heat and A/C, refrigerator, gas range, washer/dryer. New furnace in 2026. Well-suited for investors seeking a straightforward, income-producing asset and a strong addition to a rental portfolio. Can be purchased individually or as part of a larger investment portfolio.
Key facts
- 5,998 sq ft lot
- Built 1956
- Listed 49 days
Property features AI
Exterior
- Parking: Off-street parking
- Utilities: Public water; Public sewer
- Home design: Single-story; Brick construction; Asphalt roof
- Construction: Built with brick; Asphalt roof
- Exterior features: Off-street parking
Interior
- Kitchen: Stove; Refrigerator
- Flooring: Carpet; Vinyl
- Bathrooms: 1 full bathroom
- Heating & cooling: Gas heating; Central air conditioning
- Interior features: Resale condition
- Laundry & utility: Washer; Dryer
Neighborhood map
What this means for you Summary
Snapshot
- This is a 2-bed/1.0-bath single-family listed at $90k.
Deal economics
- At list price, monthly cash flow is $226 ($3k/yr) — positive.
- The deal already cash-flows at list — no discount required.
- Meets the 1% rule at list price ($1k rent vs $90k).
- Recommended offer: $87k (3.0% below list) — sets the bar for market timing.
- Cap rate 9.3% vs local median 5.5% in Liberty — top-decile yield for the area; either an underpriced asset or a hidden risk that comps aren't pricing in. Stress-test before assuming the spread holds.
Location & tenants
- Location reads 72/100 on livability (#659 in PA) — a middle-class / working-renter tenant base. Strengths: crime A+, cost of living A+, housing A+; Watch: employment C-, health & safety D, amenities F.
- South Allegheny SD (suburban): math 23% / reading 44% proficiency, ranked #430 of 539 in PA (top 80%) — families likely to look elsewhere, expect single-tenant / working-renter base with shorter leases.
- Zoned schools: South Allegheny El Sch (math 27% / reading 47%, grade F, #1,004 of 1,518 statewide, top 68%, 578 students, 100% FRL); South Allegheny Ms (math 8% / reading 42%, grade F, #418 of 512 statewide, top 82%, 313 students, 100% FRL); South Allegheny Hs (math 37% / reading 24%, grade F, #344 of 437 statewide, top 79%, 484 students, 84% FRL) — zoned schools average 94% FRL vs 47% district-wide (48 pts higher); higher-poverty schools than district average — tighter screening recommended.
- Market conditions: 39 active listings in the ZIP; 11 comparable units currently listed for rent nearby; rentals at typical pace (median 26d on market — plan ~3-4 weeks tenant-placement turnaround); 2,996 units permitted in Allegheny County in 2024 (1,588 in 5+ unit buildings).
Forward outlook
- In year one you build about $5k of equity ($622 loan paydown + $4k appreciation (4.5% local appreciation)).
- At projected returns (4.5% appreciation + 3.0% rent growth), your $25k cash investment doubles in ~4 years — after that, you're playing with house money.
- By year 7, paydown + projected appreciation supports a ~$30k cash-out refi (75% LTV) — recoverable capital for the next deal without selling this one.
Negotiation context
- It's been on market 49 days — a 3% lower offer ($87k) is reasonable based on typical stale-listing flexibility.
Risks & watch-outs
- Watch-outs: built in 1956 — expect roof / HVAC / electrical / plumbing capex.
Questions for the listing agent
- It's been on market 49 days. Have you received any prior offers? Is the seller open to a 3% concession, seller financing, or rate buy-down credit?
- Built in 1956 — when were the roof, HVAC, electrical panel, plumbing, and water heater last replaced?
- Is there a deadline driving the sale (1031 exchange, divorce, estate, relocation)? That informs how much negotiation room exists.
- Schools are B-rated — typically a magnet for longer-tenancy family renters. What's the average tenant stay here, and is there a school-zone premium baked into asking?
- What's the average days-on-market for RENTAL listings here right now (not sales)? A rising rental-DOM trend means longer vacancies and softer asking-rent achievability than the comps imply.
- What's the recent tenant-quality profile in this submarket — average credit score on applications, eviction rate, late-payment / NSF rate, and stable-employment percentage? A property-management company in the area should have these aggregated.
- How much new for-sale + rental construction is in the pipeline within 1–3 miles? Heavy new supply typically softens prices + rents 12–24 months out; constrained supply supports both.
Investment metrics
- 1% rule
- 1.26% ✓
- Cap rate
- 9.30%
- Cash-on-cash
- 10.75%
- DSCR
- 1.48
- GRM
- 6.6
CMA / ARV
- ARV (median comp)
- $144,199
- List price
- $90,000
- Delta
- -37.59%
- Verdict
- UNDERPRICED
- Comps
- 20 within 1.0 mi
Show comp detail 10 sales within ~0.75 mi
| Address | Dist | Beds/Ba | Sqft | Sold | Price | $/sf | Match |
|---|---|---|---|---|---|---|---|
| 2911 Valley St | 0.33mi | 3/1.0 (+1) | 1,073 (+3%) | 1mo | $110,000 | $103 | 74 |
| 2903 Valley St | 0.36mi | 3/1.0 (+1) | 1,073 (+3%) | 11mo | $115,500 | $108 | 64 |
| 3209 Jeffrey Dr | 0.33mi | 3/1.0 (+1) | 900 (-14%) | 2mo | $73,000 | $81 | 55 |
| 616 River Ridge Rd | 0.30mi | 2/1.0 | 897 (-14%) | 10mo | $130,000 | $145 | 55 |
| 605 Hays St | 0.56mi | 2/1.0 | 980 (-6%) | 13mo | $122,000 | $124 | 53 |
| 3236 Overlook Dr | 0.48mi | 3/2.0 (+1) | 1,019 (-2%) | 18mo | $90,000 | $88 | 50 |
| 2421 Latrobe St | 0.59mi | 3/2.0 (+1) | 1,053 (+1%) | 18mo | $122,000 | $116 | 46 |
| 2720 C St | 0.57mi | 3/1.0 (+1) | 907 (-13%) | 3mo | $115,000 | $127 | 44 |
| 2712 E Street | 0.53mi | 2/1.0 | 963 (-7%) | 23mo | $119,000 | $124 | 44 |
| 3212 Monaca Dr | 0.63mi | 2/2.0 | 897 (-14%) | 21mo | $48,000 | $54 | 26 |
Match score weights: distance 35% · size 25% · config 20% · recency 20%. Top-matched comps best support the ARV.
Projected returns pro-forma
4.52% appreciation · 3.0% rent growth · sell at horizon
- IRR
- 21.1%
- Equity multiple
- 2.30×
- Total profit
- $32,733
- Equity at exit
- $48,413
- IRR
- 21.1%
- Equity multiple
- 4.49×
- Total profit
- $87,849
- Equity at exit
- $81,489
Cash invested: $25,200 (down + closing). Projections, not guarantees.
Landlord ↔ Tenant lean methodology
- Overall (STATE)
- 62 Landlord-Friendly
- State Pennsylvania
- 62 Landlord-Friendly · EVEN
- County
- — inherits STATE
- City
- — inherits STATE
ZIP-level market 15133
- Home prices YoY
- 2.1%
- Active inventory
- 39
- Price-to-rent
- 6.6×
Monthly cashflow live
- Estimated rent
- $1,136 high interval (Pro) →
- Mortgage (P&I)
- −$472
- Tax from tax record
- −$162 /mo · $1,946/yr
- Insurance
- −$38
- HOA
- −$0
- Vacancy / Maint / Mgmt
- −$239
- Net cashflow
- $226
Break-even live
Sensitivity live
| Price | -10% $277 | -5% $251 | +0% $226 | +5% $200 | +10% $175 |
|---|---|---|---|---|---|
| Rent | -10% $136 | -5% $181 | +0% $226 | +5% $271 | +10% $315 |
| Rate | -1.0pp $271 | -0.5pp $249 | base $226 | +0.5pp $202 | +1.0pp $179 |
UW: 25.0% down · 7.5% · 30yr · 1.5% tax · 5.0% vac · 8.0% maint · 8.0% mgmt
Financing live
Cash to close
- Down payment
- $22,500
- Closing costs
- $2,700
- Reserves months
- —
- Total cash needed
- —
Loan-product check · same deal, 3 products live
Conventional
25% down · 7.5% · 30yr
- Down + closing
- —
- Monthly P&I
- —
- Monthly cashflow
- —
- DSCR
- —
- Eligible?
- —
Personal DTI + credit; lowest rate.
DSCR
20% down · 8.5% · 30yr
- Down + closing
- —
- Monthly P&I
- —
- Monthly cashflow
- —
- DSCR
- —
- Eligible?
- —
No personal income docs; deal must DSCR.
Hard money
10% down · 12.0% · 12mo
- Down + closing
- —
- Monthly P&I
- —
- Monthly cashflow
- —
- DSCR
- —
- Eligible?
- —
Short-term bridge; refi at stabilization.
Rent comps 11 comps
| Address | Beds | Baths | Sqft | Rent | $/sqft | DOM | Units | Dist |
|---|---|---|---|---|---|---|---|---|
| 733 Memory Ln McKeesport, PA | 2.0 | 1.0 | 850 | $1,200 | $1.41 | 25d | 1 | 0.04mi |
| 1805 Gray St McKeesport, PA | 3.0 | 1.0 | 1136 | $1,600 | $1.41 | 0d | 1 | 0.84mi |
| 306 Laredo St McKeesport, PA | 2.0 | 1.0 | 928 | $995 | $1.07 | 45d | 1 | 1.07mi |
| 2918 Walnut St Apt 3 McKeesport, PA | 2.0 | 1.0 | 800 | $850 | $1.06 | 45d | 1 | 1.08mi |
| 311-313 24th St McKeesport, PA | 2.0 | 1.0 | 950 | $900 | $0.95 | 45d | 1 | 1.10mi |
| 1451 Jenny Lind St McKeesport, PA | 3.0 | 1.5 | 1408 | $1,150 | $0.82 | 25d | 1 | 1.32mi |
| 1044 Delaware Ave Glassport, PA | 3.0 | 1.0 | 1200 | $1,350 | $1.12 | 22d | 1 | 1.42mi |
| 4719 3rd St Unit 2 McKeesport, PA | 3.0 | 1.0 | 1200 | $975 | $0.81 | 45d | 1 | 1.43mi |
| 812 Indiana Ave Unit 1 Glassport, PA | 1.0 | 1.0 | 800 | $695 | $0.87 | 25d | 1 | 1.46mi |
| 505 Olympia Park Plz McKeesport, PA | 1.0 | 1.0 | 800 | $775 | $0.97 | 25d | 1 | 1.48mi |
| 833 Vermont Ave Glassport, PA | 3.0 | 1.0 | 1290 | $1,395 | $1.08 | 25d | 1 | 1.48mi |
Listing history 18 events
-
2026-06-21days on market $90,000 Active 49 DOM
-
2026-06-18days on market $90,000 Active 46 DOM
-
2026-06-17days on market $90,000 Active 45 DOM
-
2026-06-16days on market $90,000 Active 44 DOM
-
2026-06-15days on market $90,000 Active 43 DOM
-
2026-06-13days on market $90,000 Active 41 DOM
-
2026-06-13days on market $90,000 Active 40 DOM
-
2026-06-09days on market $90,000 Active 37 DOM
-
2026-06-08days on market $90,000 Active 36 DOM
-
2026-06-07days on market $90,000 Active 35 DOM
-
2026-06-05days on market $90,000 Active 32 DOM
-
2026-06-03days on market $90,000 Active 31 DOM
-
2026-06-02days on market $90,000 Active 30 DOM
-
2026-06-01days on market $90,000 Active 29 DOM
-
2026-05-31days on market $90,000 Active 28 DOM
-
2026-05-03$90,000 Active 478-char remark
-
2002-02-20soldstatus $205,000
-
1991-01-15soldstatus $24,000
ⓘ Source: listings_history table (triggers on properties + properties_extension) + one-shot
backfill from property_details.listing_events for pre-trigger history.
Tax reassessment forecast PA · Partial reset (capped growth)
- Current annual tax
- $1,946 · $162/mo
- Projected year-2 tax
- $1,946 · $162/mo
- Expected delta
- $0/yr ($0/mo · 0.0%)
ⓘ Screening estimate from a state-policy table — verify with the county assessor before closing.
Climate risk First Street
- Flood 1/10 Low FEMA zone X (unshaded) · 0% chance over 30 yrs
- Wildfire 1/10 Low
- Heat 3/10 Moderate 7 d/yr ≥97°F today · 18 d/yr by 30 yrs out
- Wind 2/10 Low
- Air quality 5/10 Major 8 unhealthy d/yr today · 8 by 30 yrs out
Nearby sold comps map
Loading sold comps map…
Walkable amenities ~0.75 mi
Loading nearby amenities…
Taxation est. · year 1
- Rental income
- $13,631
- − Mortgage interest
- −$5,041
- − Property taxes
- −$1,946
- − Insurance
- −$450
- − Repairs & maintenance
- −$1,090
- − Management
- −$1,090
- − Depreciation
- −$2,618
- Taxable income
- $1,394
- Est. tax owed @ 24.0%
- −$335
- After-tax cash flow
- $2,374/yr
For passive investors: Depreciation is non-cash, so a rental often shows a tax loss while cash-flowing — sheltering income. Rental losses are passive: they offset passive income freely, and up to $25,000/yr can offset ordinary (W-2) income if you actively participate and your MAGI is under $100k (phasing out to $0 by $150k); unused losses carry forward. On sale, claimed depreciation is recaptured at up to 25%, and gains may owe capital-gains tax (a 1031 exchange can defer both). Figures are a year-1 estimate at your 24.0% rate — not tax advice; consult a CPA.
Schools (NCES district)
- District
- South Allegheny SD
- NCES district ID
- 4221910
- Math proficiency
- 23% ▼ -10.00%
- Reading proficiency
- 44% ▼ -13.00%
- Median HH income
- $40,891
- Composite
- 28.15/100
- National rank
- #6815
- State rank
- #430 of 539 in PA
Livability — Liberty
- Score
- 72/100
- State rank
- #659
- US rank
- #6444
Category grades
Schools grade is shown separately in the Schools card above.
Census & demographics
- Census place
- Liberty, PA
- County
- Allegheny County · 1,022,028 people
- City population
- 6,139
- Metro
- Pittsburgh, PA
- Population (ZIP)
- 6,112
- Household income
- $65,938
- Rent vs Own
- Severe rent burden
- 94.0
Population outlook (Allegheny County) Hauer SSP2
- Today (2025)
- 1,250,282 people
- By 2030
- 1,256,482 · +0.5%
- By 2040
- 1,256,318 · +0.5%
- By 2050
- 1,244,169 · -0.5%
- By 2075
- 1,197,693 · -4.2%
- By 2100
- 1,093,187 · -12.6%
Race, ethnicity, and origin ACS 2023
- Neighborhood character
- Predominantly White (84%)
- Race & ethnicity
- White 84% Two or more races 7% Black 4% Hispanic / Latino 3%
- Common ancestry
- Romanian 10% Slovene 2% Italian 2%
- Foreign-born
- 0%
- Languages at home
- 99% English-only · Other Indo-European 1%
Political lean MEDSL · Allegheny
- 2024 margin
- Strong D (+20.3) · D 59.7% · R 39.4%
- 2008→2024 swing
- +4.8pp toward D · 2008: 15.5pp · 2024: 20.3pp
- All cycles
- 2024: D+20.3 2020: D+20.4 2016: D+16.4 2012: D+14.4 2008: D+15.5
Not yet ingested
- Civics
- —
Market trends
- HPI YoY
- ▲ 4.52%
- Current HPI
- 214.5922
- Rent YoY
- —
- Metro
- Pittsburgh, PA
- State GDP YoY
- ▲ 1.68%
- F500 in state
- 34
Industry mix (Fortune 500 HQ in PA)
| Industry | F500 HQs | Revenue |
|---|---|---|
| Healthcare | 2 | $309B |
|
||
| Insurance | 2 | $27B |
|
||
| Telecommunications / Media | 1 | $124B |
|
||
| Industrial Distribution | 1 | $22B |
|
||
| Financial Services | 1 | $20B |
|
||
| Chemicals / Materials | 1 | $18B |
|
||
Price history
+275.0% since first listed3 events — show timeline
- 2026-05-03 Listed $90,000 West Penn MLS
- 2002-02-20 Sold (Public Records) $205,000 Public Records
- 1991-01-15 Sold (Public Records) $24,000 Public Records
Property tax history
+4.7%/yrLatest (2026): $1,946 · +6.0% YoY. Source: county tax records.
Cash-flow waterfall
monthlySold comps — $/sqft
last 12 mo · ≤1 miLoading sold comps…