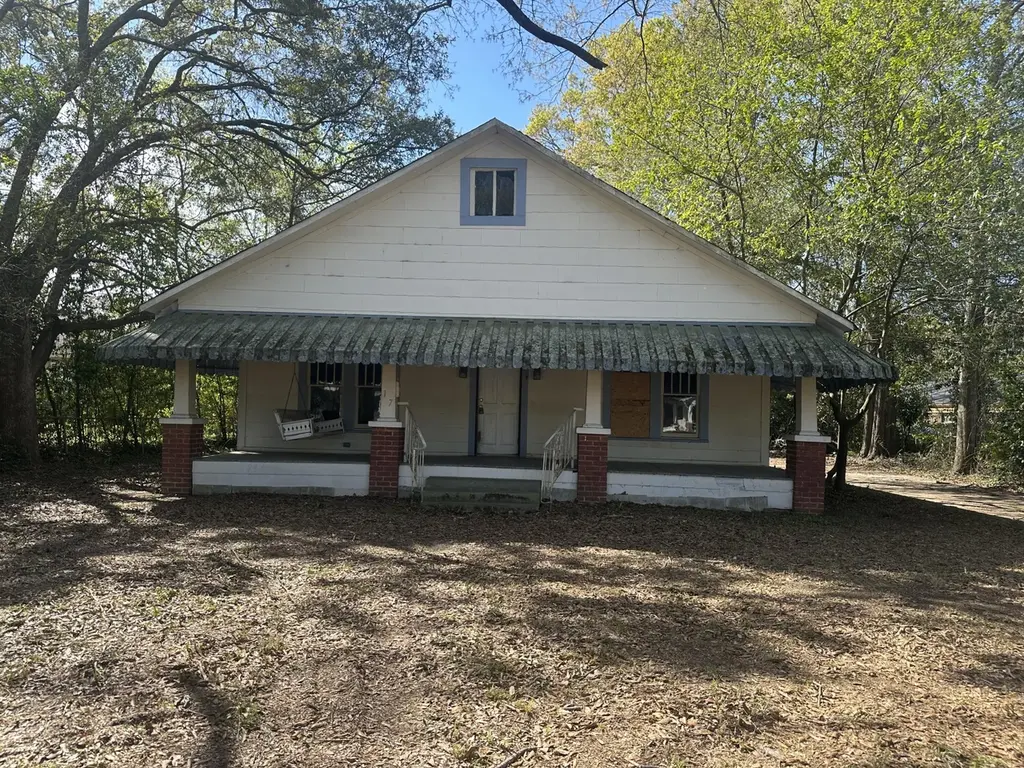
137 W 5th Ave · Petal, MS
Flood risk 1/10 · Minimal
- FEMA flood zone
- X (unshaded)
- Chance of flooding over 30 yrs
- 0.0%
- Est. flood insurance / yr
- $507 – $1,088
Fire risk 2/10 · Minimal
- Est. fire insurance / yr
- $1,241 – $2,305
Heat risk 8/10 · Major
- Hot days now (above 106°F)
- 7 days/yr
- Hot days in 30 yrs
- 21 days/yr
Wind risk 8/10 · Major
- Chance of severe wind over 30 yrs
- 99.0%
Air-quality risk 1/10 · Minimal
- Unhealthy air days now
- 0 days/yr
- Unhealthy air days in 30 yrs
- 0 days/yr
Risk factors via First Street. Map © Google.
Why this score? — see what drove the B- grade
The composite is a weighted blend of 9 inputs, each scored 0–100. Each bar is that input's sub-score; the figure is the points it added to the 100-point composite (weight × sub-score).
- Cash flow +30.0/30.0
- 1% rule +10.0/10.0
- DSCR +10.0/10.0
- ARV discount +7.5/15.0
- Schools +5.3/10.0
- Livability +3.7/5.0
- Rent growth +2.5/5.0
- Condition / age +1.0/5.0
- Appreciation +0.0/10.0
$65,000
🖨 Deal sheet 📄 Offer letter ✓ Due diligence
Listing remarks MLS
Great opportunity in Petal for investors. Foreclosure that would make a great rental or flip. There is enough square footage to turn into a 3 bedroom.
Key facts
- 0.52 acre lot
- Built 1937
- Listed 70 days
Neighborhood map
What this means for you Summary
Snapshot
- This is a 2-bed/1.0-bath single-family listed at $65k. Condition is rated poor.
Deal economics
- At list price, monthly cash flow is $481 ($6k/yr) — positive.
- The deal already cash-flows at list — no discount required.
- Meets the 1% rule at list price ($1k rent vs $65k).
- Recommended offer: $61k (6.0% below list) — sets the bar for market timing.
- Cap rate 15.2% vs local median 4.0% in Petal — top-decile yield for the area; either an underpriced asset or a hidden risk that comps aren't pricing in. Stress-test before assuming the spread holds.
Location & tenants
- Location reads 73/100 on livability (#18 in MS) — a middle-class / working-renter tenant base. Strengths: crime A+, cost of living A+, housing A+; Watch: health & safety D, amenities F, commute F.
- Petal School District (suburban): math 68% / reading 56% proficiency, ranked #2 of 130 in MS (top 2%) — acceptable for families but not a draw, mixed tenant base, ~2y average lease.
- Market conditions: 228 active listings in the ZIP; 2 comparable units currently listed for rent nearby; 121 units permitted in Forrest County in 2024 (30 in 5+ unit buildings).
Forward outlook
- Local home prices are declining (-3.0%/yr); year-one equity from $449 of loan paydown is wiped out by about $2k of value loss. Plan a longer hold.
- Forrest County population projected at +6% by 2050 — modest demand growth; plan on rents tracking national, not racing it.
- At projected returns (-3.0% appreciation + 3.0% rent growth), your $18k cash investment doubles in ~4 years — after that, you're playing with house money.
Negotiation context
- It's been on market 70 days — a 6% lower offer ($61k) is reasonable based on typical stale-listing flexibility.
Risks & watch-outs
- Watch-outs: built in 1937 — expect roof / HVAC / electrical / plumbing capex.
- Climate carrying-cost: severe wind risk, 99% chance of damaging wind over 30y; extreme-heat days projected 7→21/yr by 2055 (HVAC capex compounding) — expect insurance premiums to compound above CPI over the hold.
Questions for the listing agent
- It's been on market 70 days. Have you received any prior offers? Is the seller open to a 6% concession, seller financing, or rate buy-down credit?
- Have any recent inspections been done? Can we get a copy of the seller's disclosures and any deferred-maintenance estimates?
- Built in 1937 — when were the roof, HVAC, electrical panel, plumbing, and water heater last replaced?
- Why hasn't it sold? Are there any deal-killer items the seller is aware of (foundation, flood, title, zoning, code violations)?
- Is there a deadline driving the sale (1031 exchange, divorce, estate, relocation)? That informs how much negotiation room exists.
- What's the average days-on-market for RENTAL listings here right now (not sales)? A rising rental-DOM trend means longer vacancies and softer asking-rent achievability than the comps imply.
- What's the recent tenant-quality profile in this submarket — average credit score on applications, eviction rate, late-payment / NSF rate, and stable-employment percentage? A property-management company in the area should have these aggregated.
- How much new for-sale + rental construction is in the pipeline within 1–3 miles? Heavy new supply typically softens prices + rents 12–24 months out; constrained supply supports both.
Investment metrics
- 1% rule
- 1.81% ✓
- Cap rate
- 15.17%
- Cash-on-cash
- 31.71%
- DSCR
- 2.41
- GRM
- 4.6
CMA / ARV
- ARV (median comp)
- $168,896
- List price
- $65,000
- Delta
- -61.51%
- Verdict
- UNDERPRICED
- Comps
- 11 within 1.0 mi
Show comp detail 3 sales within ~0.75 mi
| Address | Dist | Beds/Ba | Sqft | Sold | Price | $/sf | Match |
|---|---|---|---|---|---|---|---|
| 113 Green St | 0.29mi | 3/2.0 (+1) | 1,500 (+4%) | 5mo | $219,900 | $147 | 67 |
| 102 Smith St | 0.42mi | 3/2.0 (+1) | 1,391 (-3%) | 2mo | $199,900 | $144 | 64 |
| 126 Wilson Dr | 0.73mi | 3/1.0 (+1) | 1,326 (-8%) | 3mo | $100,000 | $75 | 45 |
Match score weights: distance 35% · size 25% · config 20% · recency 20%. Top-matched comps best support the ARV.
Projected returns pro-forma
-3.0% appreciation · 3.0% rent growth · sell at horizon
- IRR
- 26.7%
- Equity multiple
- 2.11×
- Total profit
- $20,119
- Equity at exit
- $9,692
- IRR
- 34.3%
- Equity multiple
- 4.13×
- Total profit
- $57,037
- Equity at exit
- $5,620
Cash invested: $18,200 (down + closing). Projections, not guarantees.
Landlord ↔ Tenant lean methodology
- Overall (STATE)
- 90 Strongly Landlord-Friendly
- State Mississippi
- 90 Strongly Landlord-Friendly · R+11
- County
- — inherits STATE
- City
- — inherits STATE
ZIP-level market 39465
- Active inventory
- 228
- Price-to-rent
- 4.6×
Monthly cashflow live
- Estimated rent
- $1,177 medium interval (Pro) →
- Mortgage (P&I)
- −$341
- Tax est. 1.5%
- −$81 /mo · $975/yr
- Insurance
- −$27
- HOA
- −$0
- Vacancy / Maint / Mgmt
- −$247
- Net cashflow
- $481
Break-even live
UW: 25.0% down · 7.5% · 30yr · 1.5% tax · 5.0% vac · 8.0% maint · 8.0% mgmt
Financing live
Cash to close
- Down payment
- $16,250
- Closing costs
- $1,950
- Reserves months
- —
- Total cash needed
- —
Loan-product check · same deal, 3 products live
Conventional
25% down · 7.5% · 30yr
- Down + closing
- —
- Monthly P&I
- —
- Monthly cashflow
- —
- DSCR
- —
- Eligible?
- —
Personal DTI + credit; lowest rate.
DSCR
20% down · 8.5% · 30yr
- Down + closing
- —
- Monthly P&I
- —
- Monthly cashflow
- —
- DSCR
- —
- Eligible?
- —
No personal income docs; deal must DSCR.
Hard money
10% down · 12.0% · 12mo
- Down + closing
- —
- Monthly P&I
- —
- Monthly cashflow
- —
- DSCR
- —
- Eligible?
- —
Short-term bridge; refi at stabilization.
Rent comps 2 comps
| Address | Beds | Baths | Sqft | Rent | $/sqft | DOM | Units | Dist |
|---|---|---|---|---|---|---|---|---|
| 523 E Fifth Ave Petal, MS | 3.0 | 1.0 | 1098 | $1,500 | $1.37 | 21d | 1 | 0.72mi |
| 120 E First Ave Petal, MS | 2.0 | 1.0 | 1062 | $995 | $0.94 | 44d | 1 | 0.75mi |
Listing history 6 events
-
2026-06-05statusdays on market $65,000 Pending 70 DOM
-
2026-06-02days on market $65,000 Active 69 DOM
-
2026-06-01days on market $65,000 Active 68 DOM
-
2026-05-31days on market $65,000 Active 67 DOM
-
2026-05-30days on market $65,000 Active 66 DOM
-
2026-03-25$65,000 Active 150-char remark
Show marketing remark (150 chars)
Great opportunity in Petal for investors. Foreclosure that would make a great rental or flip. There is enough square footage to turn into a 3 bedroom.
ⓘ Source: listings_history table (triggers on properties + properties_extension) + one-shot
backfill from property_details.listing_events for pre-trigger history.
Climate risk First Street
- Flood 1/10 Low FEMA zone X (unshaded) · 0% chance over 30 yrs
- Wildfire 2/10 Low
- Heat 8/10 Severe 7 d/yr ≥106°F today · 21 d/yr by 30 yrs out
- Wind 8/10 Severe 99% chance of damaging wind over 30 yrs
- Air quality 1/10 Low 0 unhealthy d/yr today · 0 by 30 yrs out
Nearby sold comps map
Loading sold comps map…
Walkable amenities ~0.75 mi
Loading nearby amenities…
Taxation est. · year 1
- Rental income
- $14,129
- − Mortgage interest
- −$3,641
- − Property taxes
- −$975
- − Insurance
- −$325
- − Repairs & maintenance
- −$1,130
- − Management
- −$1,130
- − Depreciation
- −$1,891
- Taxable income
- $5,037
- Est. tax owed @ 24.0%
- −$1,209
- After-tax cash flow
- $4,563/yr
For passive investors: Depreciation is non-cash, so a rental often shows a tax loss while cash-flowing — sheltering income. Rental losses are passive: they offset passive income freely, and up to $25,000/yr can offset ordinary (W-2) income if you actively participate and your MAGI is under $100k (phasing out to $0 by $150k); unused losses carry forward. On sale, claimed depreciation is recaptured at up to 25%, and gains may owe capital-gains tax (a 1031 exchange can defer both). Figures are a year-1 estimate at your 24.0% rate — not tax advice; consult a CPA.
Condition & rehab AI · 12 photos
This property requires extensive renovations and cleaning to improve its condition and value. Potential investors should consider the extensive work needed to bring it up to a livable standard.
Repairs flagged
- Major Kitchen cabinets — Dirty and in need of cleaning
- Major Bathroom cabinets — Dirty and in need of cleaning
- Major Exterior siding — Peeling paint
- Major Interior walls — Dirty and in need of cleaning
Value-add opportunities
- Both Paint the exterior and interior — Fresh paint can improve curb appeal and interior aesthetics
- Both Deep clean the kitchen and bathroom — A clean and organized space is more appealing to potential buyers
- Both Replace kitchen and bathroom cabinets — New cabinets can significantly improve the look and functionality of the kitchen and bathroom
Renovation cost estimate screening
| Repair item | Severity | Est. cost |
|---|---|---|
| Kitchen cabinets · Dirty and in need of cleaning | Major | $15,000–50,000 |
| Bathroom cabinets · Dirty and in need of cleaning | Major | $15,000–50,000 |
| Exterior siding · Peeling paint | Major | $15,000–50,000 |
| Interior walls · Dirty and in need of cleaning | Major | $15,000–50,000 |
| Total estimated repair cost · 4 items | $60,000–200,000 |
Value-add ROI direction
- Both Paint the exterior and interior — Fresh paint can improve curb appeal and interior aesthetics ↑
- Both Deep clean the kitchen and bathroom — A clean and organized space is more appealing to potential buyers ↑
- Both Replace kitchen and bathroom cabinets — New cabinets can significantly improve the look and functionality of the kitchen and bathroom ↑
ⓘ Cost ranges are severity-bucket heuristics (US national rule-of-thumb). Get contractor quotes + a written scope before underwriting a rehab budget.
Schools (NCES district)
- District
- Petal School District
- NCES district ID
- 2803530
- Math proficiency
- 68% ▼ -8.00%
- Reading proficiency
- 56% ▼ -6.00%
- Median HH income
- $51,872
- Composite
- 52.97/100
- National rank
- #1526
- State rank
- #2 of 130 in MS
Livability — Petal
- Score
- 73/100
- State rank
- #18
- US rank
- #5565
Category grades
Schools grade is shown separately in the Schools card above.
Census & demographics
- Census place
- Petal, MS
- County
- Forrest County · 65,413 people
- City population
- 22,882
- Metro
- Hattiesburg, MS
- Population (ZIP)
- 22,882
- Household income
- $74,035
- Rent vs Own
- Severe rent burden
- 199.0
Population outlook (Forrest County) Hauer SSP2
- Today (2025)
- 79,264 people
- By 2030
- 80,822 · +2.0%
- By 2040
- 82,979 · +4.7%
- By 2050
- 84,324 · +6.4%
- By 2075
- 84,942 · +7.2%
- By 2100
- 80,616 · +1.7%
Race, ethnicity, and origin ACS 2023
- Neighborhood character
- Predominantly White (81%)
- Race & ethnicity
- White 81% Black 13% Two or more races 3% Hispanic / Latino 3%
- Common ancestry
- Lithuanian 4% Slovak 2% Italian 1%
- Foreign-born
- 2% · Canada, Vietnam
- Languages at home
- 98% English-only · Spanish 2%
Political lean MEDSL · Forrest
- 2024 margin
- R (+17.9) · D 40.3% · R 58.2% · Other 1.4%
- 2008→2024 swing
- -4.4pp toward R · 2008: -13.5pp · 2024: -17.9pp
- All cycles
- 2024: R+17.9 2020: R+11.1 2016: R+14.2 2012: R+11.7 2008: R+13.5
Not yet ingested
- Civics
- —
Market trends
- HPI YoY
- ▼ -96.97%
- Current HPI
- 158.6021
- Rent YoY
- —
- Metro
- Hattiesburg, MS
- State GDP YoY
- —
- F500 in state
- 0
Price history
1 event — show timeline
- 2026-03-25 Listed $65,000 HAAR
Cash-flow waterfall
monthlySold comps — $/sqft
last 12 mo · ≤1 miLoading sold comps…