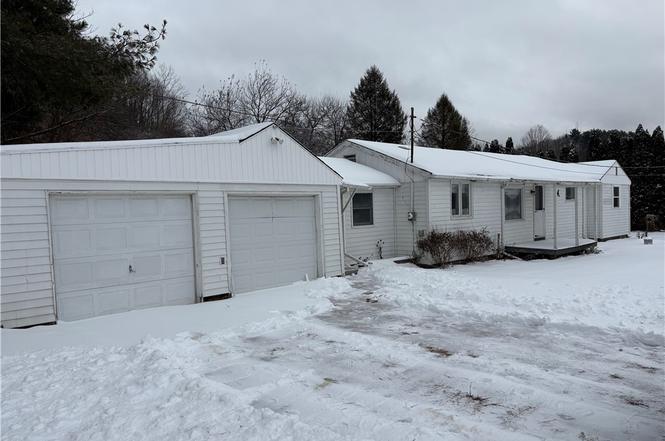
1031 Rt-221 · Virgil, NY
Flood risk 9/10 · Severe
- FEMA flood zone
- X (unshaded)
- Chance of flooding over 30 yrs
- 0.99%
- Est. flood insurance / yr
- $473 – $860
Fire risk 2/10 · Minimal
- Est. fire insurance / yr
- $691 – $1,283
Heat risk 2/10 · Minimal
- Hot days now (above 92°F)
- 7 days/yr
- Hot days in 30 yrs
- 16 days/yr
Wind risk 2/10 · Minimal
- Chance of severe wind over 30 yrs
- 1.0%
Air-quality risk 2/10 · Minimal
- Unhealthy air days now
- 0 days/yr
- Unhealthy air days in 30 yrs
- 1 days/yr
Risk factors via First Street. Map © Google.
Why this score? — see what drove the C- grade
The composite is a weighted blend of 9 inputs, each scored 0–100. Each bar is that input's sub-score; the figure is the points it added to the 100-point composite (weight × sub-score).
- ARV discount +15.0/15.0
- Cash flow +8.6/30.0
- Appreciation +8.5/10.0
- 1% rule +4.0/10.0
- Schools +4.0/10.0
- Livability +3.0/5.0
- Rent growth +2.5/5.0
- Condition / age +2.5/5.0
- DSCR +2.4/10.0
$110,000
🖨 Deal sheet 📄 Offer letter ✓ Due diligence
Listing remarks MLS
Nicely maintained well built ranch on a full basement situated on approximately 1/3 acre. Highlights include an eat-in kitchen, formal dining room with sliding glass doors, living room with hardwood floors and built-in shelves, 3 bedrooms, half bath with laundry, full bath, large mud room in entrance way, back porch area, 2 car attached garage, concrete driveway and more.
Key facts
- Attached car garage
- Centrally located
- 0.4 acre lot
Tags
Neighborhood map
What this means for you Summary
Snapshot
- This is a 3-bed/1.5-bath single-family listed at $110k.
Deal economics
- At list price, monthly cash flow is $-150 ($-2k/yr) — negative.
- To cash-flow at today's rent, offer at most $84k (24.0% below list).
- To meet the 1% rule (rent ≥ 1% of price), the offer needs to be $100k (9.5% below list).
- Recommended offer: $84k (24.0% below list) — sets the bar for cash-flow.
Location & tenants
- Location reads 60/100 on livability (#963 in NY) — a middle-class / working-renter tenant base. Strengths: housing A+, cost of living B+; Watch: schools C-, health & safety D, crime F.
- Marathon Central School District (rural): math 42% / reading 51% proficiency, ranked #437 of 590 in NY (top 74%) — families likely to look elsewhere, expect single-tenant / working-renter base with shorter leases.
- Market conditions: 3 active listings in the ZIP; 1 comparable units currently listed for rent nearby; 45 units permitted in Cortland County in 2024 (12 in 5+ unit buildings).
Forward outlook
- In year one you build about $8k of equity ($761 loan paydown + $8k appreciation (7.0% local appreciation)).
- Cortland County population projected at -15% by 2050 — secular population decline; favor cash flow + early exit over multi-decade hold.
- By year 5, paydown + projected appreciation supports a ~$37k cash-out refi (75% LTV) — recoverable capital for the next deal without selling this one.
Negotiation context
- It's been on market 215 days — a 12% lower offer ($97k) is reasonable based on typical stale-listing flexibility.
- 3 sale attempts since 8y ago; this cycle's ask has dropped $15k (12%) from the opening price — seller is motivated, your offer sets the floor, not the list.
- Current owner paid $90k; 22% above their basis — modest negotiation headroom, anchor on the comps not their cost.
Risks & watch-outs
- Watch-outs: property tax is 2.8% of price; flood insurance adds $56/mo; built in 1954 — expect roof / HVAC / electrical / plumbing capex.
- Climate carrying-cost: severe flood risk — expect insurance premiums to compound above CPI over the hold.
Questions for the listing agent
- What do current leases actually rent for vs. the listed asking? Can we see a recent rent roll and the last 12 months of T-12 income?
- It's been on market 215 days. Have you received any prior offers? Is the seller open to a 24% concession, seller financing, or rate buy-down credit?
- Built in 1954 — when were the roof, HVAC, electrical panel, plumbing, and water heater last replaced?
- Property tax is high relative to price — has the assessment been appealed recently, and will the sale trigger a re-assessment?
- What's the actual annual flood-insurance premium (NFIP or private), and is the property in a SFHA with mandatory coverage?
- Why hasn't it sold? Are there any deal-killer items the seller is aware of (foundation, flood, title, zoning, code violations)?
- Is there a deadline driving the sale (1031 exchange, divorce, estate, relocation)? That informs how much negotiation room exists.
- Crime grade is F in this area — have there been break-ins, vandalism, or insurance claims at this property in the last 3 years? What carrier currently insures it and at what premium?
- What's the average days-on-market for RENTAL listings here right now (not sales)? A rising rental-DOM trend means longer vacancies and softer asking-rent achievability than the comps imply.
- What's the recent tenant-quality profile in this submarket — average credit score on applications, eviction rate, late-payment / NSF rate, and stable-employment percentage? A property-management company in the area should have these aggregated.
- How much new for-sale + rental construction is in the pipeline within 1–3 miles? Heavy new supply typically softens prices + rents 12–24 months out; constrained supply supports both.
Investment metrics
- 1% rule
- 0.90% ✗
- Cap rate
- 5.27%
- Cash-on-cash
- -3.67%
- DSCR
- 0.84
- GRM
- 9.2
CMA / ARV
- ARV (on-the-fly)
- $157,638
- Comps found
- 2
Show comp detail 2 sales within ~0.75 mi
| Address | Dist | Beds/Ba | Sqft | Sold | Price | $/sf | Match |
|---|---|---|---|---|---|---|---|
| 1031 Rt-221 | 0.00mi | 3/1.5 | 1,118 (0%) | 1mo | $92,500 | $83 | 100 |
| 1098 State Route 221 | 0.25mi | 2/1.0 (-1) | 1,199 (+7%) | 6mo | $168,500 | $141 | 64 |
Match score weights: distance 35% · size 25% · config 20% · recency 20%. Top-matched comps best support the ARV.
Projected returns pro-forma
6.97% appreciation · 3.0% rent growth · sell at horizon
- IRR
- 13.2%
- Equity multiple
- 1.94×
- Total profit
- $28,809
- Equity at exit
- $76,018
- IRR
- 13.6%
- Equity multiple
- 3.96×
- Total profit
- $91,135
- Equity at exit
- $144,211
Cash invested: $30,800 (down + closing). Projections, not guarantees.
Landlord ↔ Tenant lean methodology
- Overall (STATE)
- 15 Strongly Tenant-Friendly
- State New York
- 15 Strongly Tenant-Friendly · D+10
- County
- — inherits STATE
- City
- — inherits STATE
ZIP-level market 13784
- Home prices YoY
- 4.5%
- Active inventory
- 3
- Price-to-rent
- 9.2×
Monthly cashflow live
- Estimated rent
- $995 medium interval (Pro) →
- Mortgage (P&I)
- −$577
- Tax from tax record
- −$257 /mo · $3,089/yr
- Insurance
- −$46
- Flood insurance flood zone
- −$56 /mo · $666/yr
- HOA
- −$0
- Vacancy / Maint / Mgmt
- −$209
- Net cashflow
- $-150
Break-even live
UW: 25.0% down · 7.5% · 30yr · 1.5% tax · 5.0% vac · 8.0% maint · 8.0% mgmt
Financing live
Cash to close
- Down payment
- $27,500
- Closing costs
- $3,300
- Reserves months
- —
- Total cash needed
- —
Loan-product check · same deal, 3 products live
Conventional
25% down · 7.5% · 30yr
- Down + closing
- —
- Monthly P&I
- —
- Monthly cashflow
- —
- DSCR
- —
- Eligible?
- —
Personal DTI + credit; lowest rate.
DSCR
20% down · 8.5% · 30yr
- Down + closing
- —
- Monthly P&I
- —
- Monthly cashflow
- —
- DSCR
- —
- Eligible?
- —
No personal income docs; deal must DSCR.
Hard money
10% down · 12.0% · 12mo
- Down + closing
- —
- Monthly P&I
- —
- Monthly cashflow
- —
- DSCR
- —
- Eligible?
- —
Short-term bridge; refi at stabilization.
Rent comps 1 comps
| Address | Beds | Baths | Sqft | Rent | $/sqft | DOM | Units | Dist |
|---|---|---|---|---|---|---|---|---|
| 786 State Route 221 Harford, NY | 3.0 | 2.0 | 880 | $995 | $1.13 | 44d | 1 | 0.85mi |
Listing history 9 events
-
2026-04-06status Pending
-
2026-02-05historical Active Under Contract
-
2025-12-07price $110,000
-
2025-10-17status Active
-
2025-09-15historical Active Under Contract
-
2025-09-02$125,000 Active
-
2019-06-11soldstatus $90,000
-
2019-06-01soldstatus $90,000 374-char remark
Show marketing remark (374 chars)
Nicely maintained well built ranch on a full basement situated on approximately 1/3 acre. Highlights include an eat-in kitchen, formal dining room with sliding glass doors, living room with hardwood floors and built-in shelves, 3 bedrooms, half bath with laundry, full bath, large mud room in entrance way, back porch area, 2 car attached garage, concrete driveway and more.
-
2018-06-25$99,500 374-char remark
Show marketing remark (374 chars)
Nicely maintained well built ranch on a full basement situated on approximately 1/3 acre. Highlights include an eat-in kitchen, formal dining room with sliding glass doors, living room with hardwood floors and built-in shelves, 3 bedrooms, half bath with laundry, full bath, large mud room in entrance way, back porch area, 2 car attached garage, concrete driveway and more.
ⓘ Source: listings_history table (triggers on properties + properties_extension) + one-shot
backfill from property_details.listing_events for pre-trigger history.
Tax reassessment forecast NY · Partial reset (capped growth)
- Current annual tax
- $3,089 · $257/mo
- Projected year-2 tax
- $3,089 · $257/mo
- Expected delta
- $0/yr ($0/mo · 0.0%)
ⓘ Screening estimate from a state-policy table — verify with the county assessor before closing.
Climate risk First Street
- Flood 9/10 Extreme FEMA zone X (unshaded) · 99% chance over 30 yrs
- Wildfire 2/10 Low
- Heat 2/10 Low 7 d/yr ≥92°F today · 16 d/yr by 30 yrs out
- Wind 2/10 Low 100% chance of damaging wind over 30 yrs
- Air quality 2/10 Low 0 unhealthy d/yr today · 1 by 30 yrs out
Nearby sold comps map
Loading sold comps map…
Walkable amenities ~0.75 mi
Loading nearby amenities…
Taxation est. · year 1
- Rental income
- $11,940
- − Mortgage interest
- −$6,162
- − Property taxes
- −$3,089
- − Insurance
- −$1,216
- − Repairs & maintenance
- −$955
- − Management
- −$955
- − Depreciation
- −$3,200
- Taxable loss
- −$3,638
- Est. tax savings @ 24.0%
- +$873
- After-tax cash flow
- $-922/yr
For passive investors: Depreciation is non-cash, so a rental often shows a tax loss while cash-flowing — sheltering income. Rental losses are passive: they offset passive income freely, and up to $25,000/yr can offset ordinary (W-2) income if you actively participate and your MAGI is under $100k (phasing out to $0 by $150k); unused losses carry forward. On sale, claimed depreciation is recaptured at up to 25%, and gains may owe capital-gains tax (a 1031 exchange can defer both). Figures are a year-1 estimate at your 24.0% rate — not tax advice; consult a CPA.
Schools (NCES district)
- District
- Marathon Central School District
- NCES district ID
- 3618450
- Math proficiency
- 42% ▲ 4.00%
- Reading proficiency
- 51% ▲ 11.00%
- Median HH income
- $51,011
- Composite
- 39.95/100
- National rank
- #3842
- State rank
- #437 of 590 in NY
Livability — Virgil
- Score
- 60/100
- State rank
- #963
- US rank
- #18876
Category grades
Schools grade is shown separately in the Schools card above.
Census & demographics
- Population (ZIP)
- 383
Population outlook (Cortland County) Hauer SSP2
- Today (2025)
- 47,543 people
- By 2030
- 46,107 · -3.0%
- By 2040
- 43,122 · -9.3%
- By 2050
- 40,216 · -15.4%
- By 2075
- 34,717 · -27.0%
- By 2100
- 28,953 · -39.1%
Race, ethnicity, and origin ACS 2023
- Neighborhood character
- Predominantly White (84%)
- Race & ethnicity
- White 84% Two or more races 14% Hispanic / Latino 7%
- Hispanic origin (detail)
- Mexican 7%
- Common ancestry
- Subsaharan African 4%
- Foreign-born
- 2% · Canada
- Languages at home
- 90% English-only · Russian/Polish/Slavic 5% Spanish 4% Other Indo-European 2%
Political lean MEDSL · Cortland
- 2024 margin
- Lean R (+6.4) · D 46.8% · R 53.2%
- 2008→2024 swing
- -16.4pp toward R · 2008: 10.0pp · 2024: -6.4pp
- All cycles
- 2024: R+6.4 2020: R+1.9 2016: R+6.7 2012: D+8.8 2008: D+10.0
Not yet ingested
- Civics
- —
Market trends
- HPI YoY
- ▲ 6.97%
- Current HPI
- 160.1896
- Rent YoY
- —
- Metro
- —
- State GDP YoY
- ▲ 2.60%
- F500 in state
- 92
Industry mix (Fortune 500 HQ in NY)
| Industry | F500 HQs | Revenue |
|---|---|---|
| Financial Services | 10 | $950B |
|
||
| Consumer Goods | 9 | $162B |
|
||
| Insurance | 4 | $225B |
|
||
| Telecommunications | 2 | $144B |
|
||
| Pharmaceuticals | 2 | $112B |
|
||
| Media / Entertainment | 2 | $69B |
|
||
Price history
+10.6% since first listed9 events — show timeline
- 2026-04-06 Pending — CNYIS
- 2026-02-05 Contingent — CNYIS
- 2025-12-07 Price Changed $110,000 CNYIS
- 2025-10-17 Relisted — CNYIS
- 2025-09-15 Contingent — CNYIS
- 2025-09-02 Listed $125,000 CNYIS
- 2019-06-11 Sold (Public Records) $90,000 Public Records
- 2019-06-01 Sold (MLS) $90,000 IBRMLS
- 2018-06-25 Listed $99,500 IBRMLS
Property tax history
+2.3%/yrLatest (2025): $3,089 · +10.7% YoY. Source: county tax records.
Cash-flow waterfall
monthlySold comps — $/sqft
last 12 mo · ≤1 miLoading sold comps…