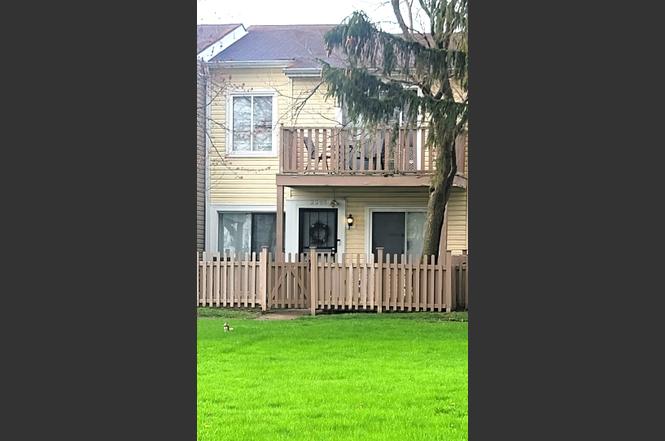
2295 Windsor Ln · Country Club Hills, IL
Flood risk 1/10 · Minimal
- FEMA flood zone
- X (unshaded)
- Chance of flooding over 30 yrs
- 0.0%
- Est. flood insurance / yr
- $473 – $860
Fire risk 1/10 · Minimal
- Est. fire insurance / yr
- $804 – $1,492
Heat risk 3/10 · Minor
- Hot days now (above 101°F)
- 7 days/yr
- Hot days in 30 yrs
- 15 days/yr
Wind risk 2/10 · Minimal
- Chance of severe wind over 30 yrs
- —
Air-quality risk 3/10 · Minor
- Unhealthy air days now
- 4 days/yr
- Unhealthy air days in 30 yrs
- 4 days/yr
Risk factors via First Street. Map © Google.
Why this score? — see what drove the C grade
The composite is a weighted blend of 9 inputs, each scored 0–100. Each bar is that input's sub-score; the figure is the points it added to the 100-point composite (weight × sub-score).
- Cash flow +21.6/30.0
- ARV discount +11.7/15.0
- 1% rule +10.0/10.0
- DSCR +6.9/10.0
- Livability +3.8/5.0
- Rent growth +2.5/5.0
- Condition / age +2.5/5.0
- Schools +0.9/10.0
- Appreciation +0.0/10.0
$155,000
🖨 Deal sheet (PDF) 📄 Offer letter ✓ Due diligence
Listing remarks MLS
There are no remarks available.
Key facts
- $180 HOA
- Garage
- Built 1977
Property features AI
Finance
- Other: Part of a 4-unit building
- HOA & community: Monthly association fee of $180; Association covers parking, exterior maintenance, lawn care, and snow removal; Pets allowed (cats and dogs), maximum pet weight 35 lbs
Exterior
- Parking: Two total parking spaces; Attached garage (garage owned) with garage door opener; Assigned and off-street guest parking and parking lot available
- Utilities: Water from Lake Michigan / public water; Public sewer; Electric service with circuit breakers
- Home design: Attached single property; Two-story townhouse; Entry level is 1; Fee simple ownership; Currently being leased; Rehab completed in 2020
- Construction: Built approximately 41–50 years ago; Vinyl siding and brick exterior; Asphalt roof; Built before 1978
- Exterior features: Lot dimensions approximately 22 x 63; School bus service and commuter bus access; close to interstate access
Interior
- Kitchen: Kitchen on the main level with ceramic tile flooring
- Bedrooms: Three bedrooms (master and two additional bedrooms on the second level)
- Flooring: Carpet in bedrooms; Wood laminate in living room; Ceramic tile in kitchen and dining room
- Bathrooms: One full bathroom; One half bathroom
- Heating & cooling: Natural gas heating; Central air conditioning
- Interior features: Six total rooms; Blinds on the living room windows
- Laundry & utility: In-unit laundry with gas dryer hookup located in a laundry closet
Neighborhood map
What this means for you Summary
Snapshot
- This is a 3-bed/1.5-bath townhouse listed at $155k.
Deal economics
- At list price, monthly cash flow is $237 ($3k/yr) — positive.
- The deal already cash-flows at list — no discount required.
- Meets the 1% rule at list price ($2k rent vs $155k).
- Recommended offer: $136k (12.0% below list) — sets the bar for market timing.
Location & tenants
- Location reads 75/100 on livability (#212 in IL, #3,963 nationally) — a middle-class / working-renter tenant base. Strengths: commute A+, cost of living A+, housing A+; Watch: crime D+, health & safety D+, schools F.
- Rich Twp Hsd 227 (suburban): math 5% / reading 12% proficiency, ranked #577 of 620 in IL (top 93%) — low school quality limits family demand, transient renter base, plan for 1-2y turnover.
- Market conditions: 94 active listings in the ZIP; 9 comparable units currently listed for rent nearby; rentals leasing fast (median 2d on market — plan ~1-2 weeks tenant-placement turnaround); 6,272 units permitted in Cook County in 2024 (4,658 in 5+ unit buildings).
Forward outlook
- Local home prices are declining (-3.0%/yr); year-one equity from $1k of loan paydown is wiped out by about $5k of value loss. Plan a longer hold.
Negotiation context
- It's been on market 135 days — a 12% lower offer ($136k) is reasonable based on typical stale-listing flexibility.
- 7 sale attempts since 17y ago with the ask held roughly flat each time — persistent listings suggest the price (not the market) is what's stuck; bring a comps-based counter.
Risks & watch-outs
- Watch-outs: property tax is 4.6% of price.
Questions for the listing agent
- It's been on market 135 days. Have you received any prior offers? Is the seller open to a 12% concession, seller financing, or rate buy-down credit?
- Built in 1977 — when were the roof, HVAC, electrical panel, plumbing, and water heater last replaced?
- Property tax is high relative to price — has the assessment been appealed recently, and will the sale trigger a re-assessment?
- What does the HOA fee cover, when was the last increase, and are there any pending special assessments or reserve-fund shortfalls?
- Why hasn't it sold? Are there any deal-killer items the seller is aware of (foundation, flood, title, zoning, code violations)?
- Is there a deadline driving the sale (1031 exchange, divorce, estate, relocation)? That informs how much negotiation room exists.
- Schools are F-rated, which usually means shorter tenancies and higher turnover. Who's the typical renter profile here, and what's been the actual vacancy rate?
- Crime grade is D in this area — have there been break-ins, vandalism, or insurance claims at this property in the last 3 years? What carrier currently insures it and at what premium?
- What's the average days-on-market for RENTAL listings here right now (not sales)? A rising rental-DOM trend means longer vacancies and softer asking-rent achievability than the comps imply.
- What's the recent tenant-quality profile in this submarket — average credit score on applications, eviction rate, late-payment / NSF rate, and stable-employment percentage? A property-management company in the area should have these aggregated.
- How much new for-sale + rental construction is in the pipeline within 1–3 miles? Heavy new supply typically softens prices + rents 12–24 months out; constrained supply supports both.
Investment metrics
- 1% rule
- 1.54% ✓
- Cap rate
- 8.12%
- Cash-on-cash
- 6.54%
- DSCR
- 1.29
- GRM
- 5.4
CMA / ARV
- ARV (on-the-fly)
- $171,086
- Comps found
- 12
Show comp detail 12 sales within ~0.75 mi
| Address | Dist | Beds/Ba | Sqft | Sold | Price | $/sf | Match |
|---|---|---|---|---|---|---|---|
| 4542 Windsor Ln | 0.08mi | 3/1.5 | 1,306 (0%) | 0mo | $175,000 | $134 | 96 |
| 1135 Williamsburg Rd | 0.06mi | 3/1.5 | 1,248 (-4%) | 4mo | $130,000 | $104 | 86 |
| 2323 Windsor Ln | 0.06mi | 3/2.5 | 1,375 (+5%) | 3mo | $90,000 | $65 | 82 |
| 4474 Provincetown Dr | 0.18mi | 3/1.5 | 1,304 (-0%) | 12mo | $160,000 | $123 | 82 |
| 142 Williamsburg Rd | 0.14mi | 3/1.5 | 1,320 (+1%) | 15mo | $175,000 | $133 | 79 |
| 165 Williamsburg Rd | 0.10mi | 3/2.5 | 1,304 (-0%) | 14mo | $145,000 | $111 | 79 |
| 1101 Williamsburg Rd | 0.06mi | 4/2.0 (+1) | 1,200 (-8%) | 0mo | $185,000 | $154 | 76 |
| 4543 Windsor Ln | 0.08mi | 3/2.5 | 1,375 (+5%) | 12mo | $180,000 | $131 | 73 |
| 2265 Windsor Ln | 0.05mi | 2/1.5 (-1) | 1,200 (-8%) | 11mo | $134,900 | $112 | 70 |
| 2321 Windsor Ln | 0.06mi | 3/1.0 | 1,160 (-11%) | 10mo | $165,000 | $142 | 69 |
| 3505 Lakeview Dr #204 | 0.71mi | 2/2.0 (-1) | 1,350 (+3%) | 6mo | $195,000 | $144 | 49 |
| 3504 Lakeview Dr #105 | 0.67mi | 2/2.0 (-1) | 1,500 (+15%) | 13mo | $160,000 | $107 | 26 |
Match score weights: distance 35% · size 25% · config 20% · recency 20%. Top-matched comps best support the ARV.
Projected returns pro-forma
-3.0% appreciation · 3.0% rent growth · sell at horizon
- IRR
- -6.0%
- Equity multiple
- 0.78×
- Total profit
- $-9,658
- Equity at exit
- $23,111
- IRR
- 3.9%
- Equity multiple
- 1.29×
- Total profit
- $12,582
- Equity at exit
- $13,402
Cash invested: $43,400 (down + closing). Projections, not guarantees.
Landlord ↔ Tenant lean methodology
- Overall (STATE)
- 43 Moderately Tenant-Leaning
- State Illinois
- 43 Moderately Tenant-Leaning · D+7
- County
- — inherits STATE
- City
- — inherits STATE
ZIP-level market 60478
- Home prices YoY
- -27.3%
- Active inventory
- 94
- Price-to-rent
- 5.4×
Monthly cashflow live
- Estimated rent
- $2,387 high interval (Pro) →
- Mortgage (P&I)
- −$813
- Tax from tax record
- −$592 /mo · $7,103/yr
- Insurance
- −$65
- HOA
- −$180
- Vacancy / Maint / Mgmt
- −$501
- Net cashflow
- $237
Break-even live
Sensitivity live
| Price | -10% $742 | -5% $280 | +0% $237 | +5% $193 | +10% $149 |
|---|---|---|---|---|---|
| Rent | -10% $48 | -5% $142 | +0% $237 | +5% $331 | +10% $425 |
| Rate | -1.0pp $315 | -0.5pp $276 | base $237 | +0.5pp $196 | +1.0pp $156 |
UW: 25.0% down · 7.5% · 30yr · 1.5% tax · 5.0% vac · 8.0% maint · 8.0% mgmt
Financing live
Cash to close
- Down payment
- $38,750
- Closing costs
- $4,650
- Reserves months
- —
- Total cash needed
- —
Loan-product check · same deal, 3 products live
Conventional
25% down · 7.5% · 30yr
- Down + closing
- —
- Monthly P&I
- —
- Monthly cashflow
- —
- DSCR
- —
- Eligible?
- —
Personal DTI + credit; lowest rate.
DSCR
20% down · 8.5% · 30yr
- Down + closing
- —
- Monthly P&I
- —
- Monthly cashflow
- —
- DSCR
- —
- Eligible?
- —
No personal income docs; deal must DSCR.
Hard money
10% down · 12.0% · 12mo
- Down + closing
- —
- Monthly P&I
- —
- Monthly cashflow
- —
- DSCR
- —
- Eligible?
- —
Short-term bridge; refi at stabilization.
Rent comps 9 comps
| Address | Beds | Baths | Sqft | Rent | $/sqft | DOM | Units | Dist |
|---|---|---|---|---|---|---|---|---|
| 2256 Windsor Ln Country Club Hills, IL | 3.0 | 1.0 | 1212 | $2,250 | $1.86 | 1d | 1 | 0.06mi |
| 1153 Williamsburg Rd Country Club Hills, IL | 2.0 | 1.5 | 1216 | $1,900 | $1.56 | 1d | 1 | 0.06mi |
| 4193 186th St Country Club Hills, IL | 4.0 | 2.5 | 1704 | $3,200 | $1.88 | 1d | 1 | 0.15mi |
| 4453 Provincetown Dr Country Club Hills, IL | 3.0 | 2.5 | 1300 | $2,500 | $1.92 | 1d | 1 | 0.17mi |
| 18019 Ravisloe Ter Country Club Hills, IL | 3.0 | 1.5 | 1150 | $2,800 | $2.43 | 1d | 1 | 0.55mi |
| 17984 Amherst Ct Country Club Hills, IL | 2.0 | 1.0 | 1000 | $1,900 | $1.90 | 1d | 1 | 0.63mi |
| 18960 Keeler Ave Country Club Hills, IL | 4.0 | 2.0 | 1537 | $2,650 | $1.72 | 1d | 1 | 0.67mi |
| 3515 Bordeaux Ct Hazel Crest, IL | 4.0 | 2.0 | 1486 | $2,900 | $1.95 | 2d | 1 | 0.92mi |
| 17306 Peach Grove Ln Hazel Crest, IL | 4.0 | 1.0 | 1034 | $2,700 | $2.61 | 1d | 1 | 1.42mi |
HOA detail
- Monthly dues
- $180 · $2,160/yr
Listing history 28 events
-
2026-04-13price $155,000
-
2026-03-03price $150,000
-
2026-02-03price $157,000
-
2026-01-15$160,000 Active
-
2026-01-15historical
-
2025-12-05Active
-
2022-06-21soldstatus $135,000
-
2022-06-06soldstatus $135,000 Closed 31-char remark
Show marketing remark (31 chars)
There are no remarks available.
-
2022-05-23historical Contingent - Continue to Show 31-char remark
Show marketing remark (31 chars)
There are no remarks available.
-
2022-05-23status Active 31-char remark
Show marketing remark (31 chars)
There are no remarks available.
-
2022-05-11historical Contingent - Continue to Show 31-char remark
Show marketing remark (31 chars)
There are no remarks available.
-
2022-05-02historical 31-char remark
Show marketing remark (31 chars)
There are no remarks available.
-
2022-04-22$135,000 Active 31-char remark
Show marketing remark (31 chars)
There are no remarks available.
-
2010-06-28soldstatus $16,500 Closed Sale
-
2010-06-15status Pending
-
2010-06-09price $18,899 Reactivated
-
2010-06-09status Reactivated
-
2010-05-24historical Contingent
-
2010-05-04price $18,000 Price Change
-
2010-04-15price $19,900 Price Change
-
2010-04-09status Reactivated
-
2010-01-13historical Contingent
-
2009-12-31price $20,500 Price Change
-
2009-12-11$22,900 New
-
1997-05-19soldstatus $62,500
-
1992-07-13soldstatus $34,675
-
1992-04-13soldstatus $34,675
-
1979-06-21soldstatus $46,000
ⓘ Source: listings_history table (triggers on properties + properties_extension) + one-shot
backfill from property_details.listing_events for pre-trigger history.
Tax reassessment forecast IL · Partial reset (capped growth)
- Current annual tax
- $7,103 · $592/mo
- Projected year-2 tax
- $7,103 · $592/mo
- Expected delta
- $0/yr ($0/mo · 0.0%)
ⓘ Screening estimate from a state-policy table — verify with the county assessor before closing.
Climate risk First Street
- Flood 1/10 Low FEMA zone X (unshaded) · 0% chance over 30 yrs
- Wildfire 1/10 Low
- Heat 3/10 Moderate 7 d/yr ≥101°F today · 15 d/yr by 30 yrs out
- Wind 2/10 Low
- Air quality 3/10 Moderate 4 unhealthy d/yr today · 4 by 30 yrs out
Nearby sold comps map
Loading sold comps map…
Walkable amenities ~0.75 mi
Loading nearby amenities…
Taxation est. · year 1
- Rental income
- $28,647
- − Mortgage interest
- −$8,682
- − Property taxes
- −$7,103
- − Insurance
- −$775
- − Repairs & maintenance
- −$2,292
- − Management
- −$2,292
- − HOA
- −$2,160
- − Depreciation
- −$4,509
- Taxable income
- $834
- Est. tax owed @ 24.0%
- −$200
- After-tax cash flow
- $2,639/yr
For passive investors: Depreciation is non-cash, so a rental often shows a tax loss while cash-flowing — sheltering income. Rental losses are passive: they offset passive income freely, and up to $25,000/yr can offset ordinary (W-2) income if you actively participate and your MAGI is under $100k (phasing out to $0 by $150k); unused losses carry forward. On sale, claimed depreciation is recaptured at up to 25%, and gains may owe capital-gains tax (a 1031 exchange can defer both). Figures are a year-1 estimate at your 24.0% rate — not tax advice; consult a CPA.
Schools (NCES district)
- District
- Rich Twp Hsd 227
- NCES district ID
- 1733420
- Math proficiency
- 5% ▼ -3.00%
- Reading proficiency
- 12% ▬ 0.00%
- Median HH income
- $56,056
- Composite
- 8.93/100
- National rank
- #9885
- State rank
- #577 of 620 in IL
Livability — Country Club Hills
- Score
- 75/100
- State rank
- #212
- US rank
- #3963
Category grades
Schools grade is shown separately in the Schools card above.
Census & demographics
- Census place
- Country Club Hills, IL
- City population
- 16,549
- Population (ZIP)
- 16,549
Population outlook (Cook County) Hauer SSP2
- Today (2025)
- 5,347,519 people
- By 2030
- 5,357,703 · +0.2%
- By 2040
- 5,324,924 · -0.4%
- By 2050
- 5,230,762 · -2.2%
- By 2075
- 4,785,735 · -10.5%
- By 2100
- 4,188,836 · -21.7%
Race, ethnicity, and origin ACS 2023
- Neighborhood character
- Predominantly Black (87%)
- Race & ethnicity
- Black 87% White 8% Hispanic / Latino 4% Two or more races 3%
- Common ancestry
- Romanian 1%
- Foreign-born
- 4% · Canada
- Languages at home
- 96% English-only · Spanish 2%
Political lean MEDSL · Cook
- 2024 margin
- Solid D (+42.0) · D 70.4% · R 28.4% · Other 1.2%
- 2008→2024 swing
- -11.4pp toward R · 2008: 53.4pp · 2024: 42.0pp
- All cycles
- 2024: D+42.0 2020: D+50.3 2016: D+53.0 2012: D+49.4 2008: D+53.4
Not yet ingested
- Civics
- —
Market trends
- HPI YoY
- ▼ -79.73%
- Current HPI
- 212.3917
- Rent YoY
- —
- Metro
- —
- State GDP YoY
- ▲ 1.59%
- F500 in state
- 60
Industry mix (Fortune 500 HQ in IL)
| Industry | F500 HQs | Revenue |
|---|---|---|
| Insurance | 4 | $201B |
|
||
| Consumer Goods | 4 | $87B |
|
||
| Industrial Machinery | 3 | $64B |
|
||
| Healthcare | 2 | $55B |
|
||
| Retail / Pharmacy | 1 | $148B |
|
||
| Agriculture / Food | 1 | $86B |
|
||
Price history
+237.0% since first listed28 events — show timeline
- 2026-04-13 Price Changed $155,000 MRED as Distributed by MLS Grid
- 2026-03-03 Price Changed $150,000 MRED as Distributed by MLS Grid
- 2026-02-03 Price Changed $157,000 MRED as Distributed by MLS Grid
- 2026-01-15 Listing Removed — MRED as Distributed by MLS Grid
- 2026-01-15 Listed $160,000 MRED as Distributed by MLS Grid
- 2025-12-05 Listed — MRED as Distributed by MLS Grid
- 2022-06-21 Sold (Public Records) $135,000 Public Records
- 2022-06-06 Sold (MLS) $135,000 MRED as Distributed by MLS Grid
- 2022-05-23 Contingent — MRED as Distributed by MLS Grid
- 2022-05-23 Relisted — MRED as Distributed by MLS Grid
- 2022-05-11 Contingent — MRED as Distributed by MLS Grid
- 2022-05-02 Listing Removed — MRED as Distributed by MLS Grid
- 2022-04-22 Listed $135,000 MRED as Distributed by MLS Grid
- 2010-06-28 Sold (MLS) $16,500 MRED as Distributed by MLS Grid
- 2010-06-15 Pending — MRED as Distributed by MLS Grid
- 2010-06-09 Relisted — MRED as Distributed by MLS Grid
- 2010-06-09 Price Changed $18,899 MRED as Distributed by MLS Grid
- 2010-05-24 Contingent — MRED as Distributed by MLS Grid
- 2010-05-04 Price Changed $18,000 MRED as Distributed by MLS Grid
- 2010-04-15 Price Changed $19,900 MRED as Distributed by MLS Grid
- 2010-04-09 Relisted — MRED as Distributed by MLS Grid
- 2010-01-13 Contingent — MRED as Distributed by MLS Grid
- 2009-12-31 Price Changed $20,500 MRED as Distributed by MLS Grid
- 2009-12-11 Listed $22,900 MRED as Distributed by MLS Grid
- 1997-05-19 Sold (Public Records) $62,500 Public Records
- 1992-07-13 Sold (Public Records) $34,675 Public Records
- 1992-04-13 Sold (Public Records) $34,675 Public Records
- 1979-06-21 Sold (Public Records) $46,000 Public Records
Property tax history
+7.3%/yrLatest (2023): $7,103 · +649.2% YoY. Source: county tax records.
Cash-flow waterfall
monthlySold comps — $/sqft
last 12 mo · ≤1 miLoading sold comps…