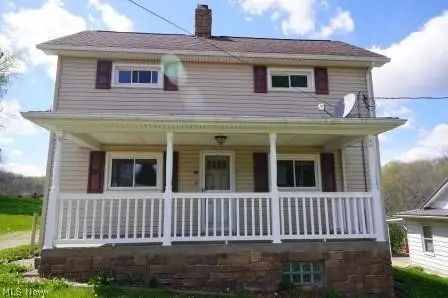
84 Powerhouse Rd · Adena, OH
Flood risk 1/10 · Minimal
- FEMA flood zone
- X (unshaded)
- Chance of flooding over 30 yrs
- 0.0%
- Est. flood insurance / yr
- $473 – $860
Fire risk 2/10 · Minimal
- Est. fire insurance / yr
- $713 – $1,323
Heat risk 3/10 · Minor
- Hot days now (above 96°F)
- 7 days/yr
- Hot days in 30 yrs
- 17 days/yr
Wind risk 1/10 · Minimal
- Chance of severe wind over 30 yrs
- —
Air-quality risk 2/10 · Minimal
- Unhealthy air days now
- 1 days/yr
- Unhealthy air days in 30 yrs
- 1 days/yr
Risk factors via First Street. Map © Google.
Why this score? — see what drove the B- grade
The composite is a weighted blend of 9 inputs, each scored 0–100. Each bar is that input's sub-score; the figure is the points it added to the 100-point composite (weight × sub-score).
- Cash flow +26.8/30.0
- DSCR +9.2/10.0
- ARV discount +7.5/15.0
- 1% rule +6.6/10.0
- Appreciation +4.7/10.0
- Schools +4.1/10.0
- Livability +3.0/5.0
- Rent growth +2.5/5.0
- Condition / age +2.5/5.0
$82,500
🖨 Deal sheet 📄 Offer letter ✓ Due diligence
Listing remarks MLS
Beautifully maintained 2 bedroom bi-level in Piney Fork. Shows pride in ownership Septic tank cleaned in October 2015, Water bill only $34 for 3000 gallons and trash costs $35 every 2 months. 2 car garage and more, A must see!!!!! USDA eligible for a no money down loan. Has a Dillonvale mailing address
Key facts
- Outside access
- Spacious kitchen
- Full basement
Tags
Property features AI
Exterior
- Parking: Attached garage with 2 parking spaces; Garage parking
- Utilities: Well water; Septic tank sewer
- Home design: Two-story frame house; Asphalt/fiberglass roof
- Construction: Frame construction; Asphalt/Fiberglass roof
- Exterior features: Approximately 0.79-acre lot
Interior
- Kitchen: Eat-in kitchen
- Bedrooms: Two bedrooms on the second floor (both about 11 x 15)
- Bathrooms: One full bathroom on the main level
- Heating & cooling: Forced-air heating (oil); Central air conditioning
- Interior features: Full unfinished walk-out basement
- Laundry & utility: Basement utility space
Neighborhood map
What this means for you Summary
Snapshot
- This is a 2-bed/1.0-bath single-family listed at $82k.
Deal economics
- At list price, monthly cash flow is $226 ($3k/yr) — positive.
- The deal already cash-flows at list — no discount required.
- Meets the 1% rule at list price ($955 rent vs $82k).
Location & tenants
- Location reads 60/100 on livability (#978 in OH) — a middle-class / working-renter tenant base. Strengths: cost of living A+, housing A+; Watch: crime D, amenities F, commute F.
- Buckeye Local (rural): math 44% / reading 53% proficiency, ranked #471 of 656 in OH (top 72%) — families likely to look elsewhere, expect single-tenant / working-renter base with shorter leases.
- Market conditions: 9 active listings in the ZIP; 2 units permitted in Jefferson County in 2024 (0 in 5+ unit buildings).
Forward outlook
- In year one you build about $44 of equity ($570 loan paydown + $-526 appreciation (-0.6% local appreciation)).
- Jefferson County population projected at -19% by 2050 — secular population decline; favor cash flow + early exit over multi-decade hold.
- At projected returns (-0.6% appreciation + 3.0% rent growth), your $23k cash investment doubles in ~7 years — after that, you're playing with house money.
Negotiation context
- Only 10 days on market — expect competitive offers; lowballing is unlikely to land.
- 2 sale attempts since 9y ago with the ask held roughly flat each time — persistent listings suggest the price (not the market) is what's stuck; bring a comps-based counter.
- Current owner paid $66k; 25% above their basis — modest negotiation headroom, anchor on the comps not their cost.
Risks & watch-outs
- Watch-outs: built in 1920 — expect roof / HVAC / electrical / plumbing capex.
Questions for the listing agent
- Built in 1920 — when were the roof, HVAC, electrical panel, plumbing, and water heater last replaced?
- Is there a deadline driving the sale (1031 exchange, divorce, estate, relocation)? That informs how much negotiation room exists.
- Schools are B-rated — typically a magnet for longer-tenancy family renters. What's the average tenant stay here, and is there a school-zone premium baked into asking?
- Crime grade is D in this area — have there been break-ins, vandalism, or insurance claims at this property in the last 3 years? What carrier currently insures it and at what premium?
- What's the average days-on-market for RENTAL listings here right now (not sales)? A rising rental-DOM trend means longer vacancies and softer asking-rent achievability than the comps imply.
- What's the recent tenant-quality profile in this submarket — average credit score on applications, eviction rate, late-payment / NSF rate, and stable-employment percentage? A property-management company in the area should have these aggregated.
- How much new for-sale + rental construction is in the pipeline within 1–3 miles? Heavy new supply typically softens prices + rents 12–24 months out; constrained supply supports both.
Investment metrics
- 1% rule
- 1.16% ✓
- Cap rate
- 9.58%
- Cash-on-cash
- 11.75%
- DSCR
- 1.52
- GRM
- 7.2
CMA / ARV
No comps found within radius.
Projected returns pro-forma
-0.64% appreciation · 3.0% rent growth · sell at horizon
- IRR
- 9.0%
- Equity multiple
- 1.41×
- Total profit
- $9,543
- Equity at exit
- $21,358
- IRR
- 14.7%
- Equity multiple
- 2.51×
- Total profit
- $34,962
- Equity at exit
- $23,683
Cash invested: $23,100 (down + closing). Projections, not guarantees.
Landlord ↔ Tenant lean methodology
- Overall (STATE)
- 73 Landlord-Friendly
- State Ohio
- 73 Landlord-Friendly · R+6
- County
- — inherits STATE
- City
- — inherits STATE
ZIP-level market 43917
- Home prices YoY
- -0.3%
- Active inventory
- 9
- Price-to-rent
- 7.2×
Monthly cashflow live
- Estimated rent
- $955 medium interval (Pro) →
- Mortgage (P&I)
- −$433
- Tax from tax record
- −$61 /mo · $734/yr
- Insurance
- −$34
- HOA
- −$0
- Vacancy / Maint / Mgmt
- −$201
- Net cashflow
- $226
Break-even live
UW: 25.0% down · 7.5% · 30yr · 1.5% tax · 5.0% vac · 8.0% maint · 8.0% mgmt
Financing live
Cash to close
- Down payment
- $20,625
- Closing costs
- $2,475
- Reserves months
- —
- Total cash needed
- —
Loan-product check · same deal, 3 products live
Conventional
25% down · 7.5% · 30yr
- Down + closing
- —
- Monthly P&I
- —
- Monthly cashflow
- —
- DSCR
- —
- Eligible?
- —
Personal DTI + credit; lowest rate.
DSCR
20% down · 8.5% · 30yr
- Down + closing
- —
- Monthly P&I
- —
- Monthly cashflow
- —
- DSCR
- —
- Eligible?
- —
No personal income docs; deal must DSCR.
Hard money
10% down · 12.0% · 12mo
- Down + closing
- —
- Monthly P&I
- —
- Monthly cashflow
- —
- DSCR
- —
- Eligible?
- —
Short-term bridge; refi at stabilization.
Listing history 2 events
-
2026-05-31remarks 474-char remark
-
2026-05-31$82,500 Pending 10 DOM
ⓘ Source: listings_history table (triggers on properties + properties_extension) + one-shot
backfill from property_details.listing_events for pre-trigger history.
Tax reassessment forecast OH · Partial reset (capped growth)
- Current annual tax
- $734 · $61/mo
- Projected year-2 tax
- $1,010 · $84/mo
- Expected delta
- +$277/yr (+$23/mo · 37.7%)
ⓘ Screening estimate from a state-policy table — verify with the county assessor before closing.
Climate risk First Street
- Flood 1/10 Low FEMA zone X (unshaded) · 0% chance over 30 yrs
- Wildfire 2/10 Low
- Heat 3/10 Moderate 7 d/yr ≥96°F today · 17 d/yr by 30 yrs out
- Wind 1/10 Low
- Air quality 2/10 Low 1 unhealthy d/yr today · 1 by 30 yrs out
Nearby sold comps map
Loading sold comps map…
Walkable amenities ~0.75 mi
Loading nearby amenities…
Taxation est. · year 1
- Rental income
- $11,459
- − Mortgage interest
- −$4,621
- − Property taxes
- −$734
- − Insurance
- −$412
- − Repairs & maintenance
- −$917
- − Management
- −$917
- − Depreciation
- −$2,400
- Taxable income
- $1,458
- Est. tax owed @ 24.0%
- −$350
- After-tax cash flow
- $2,365/yr
For passive investors: Depreciation is non-cash, so a rental often shows a tax loss while cash-flowing — sheltering income. Rental losses are passive: they offset passive income freely, and up to $25,000/yr can offset ordinary (W-2) income if you actively participate and your MAGI is under $100k (phasing out to $0 by $150k); unused losses carry forward. On sale, claimed depreciation is recaptured at up to 25%, and gains may owe capital-gains tax (a 1031 exchange can defer both). Figures are a year-1 estimate at your 24.0% rate — not tax advice; consult a CPA.
Schools (NCES district)
- District
- Buckeye Local
- NCES district ID
- 3904778
- Math proficiency
- 44% ▼ -18.00%
- Reading proficiency
- 53% ▼ -10.00%
- Median HH income
- $41,332
- Composite
- 40.68/100
- National rank
- #3673
- State rank
- #471 of 656 in OH
Livability — Adena
- Score
- 60/100
- State rank
- #978
- US rank
- #19033
Category grades
Schools grade is shown separately in the Schools card above.
Census & demographics
- County
- Jefferson · 64,369 people
- Metro
- Weirton-Steubenville, WV-OH
- Population (ZIP)
- 2,647
- Household income
- $60,750
- Rent vs Own
- Severe rent burden
- 38.0
Population outlook (Jefferson County) Hauer SSP2
- Today (2025)
- 63,481 people
- By 2030
- 61,067 · -3.8%
- By 2040
- 55,860 · -12.0%
- By 2050
- 51,236 · -19.3%
- By 2075
- 41,804 · -34.1%
- By 2100
- 32,344 · -49.0%
Race, ethnicity, and origin ACS 2023
- Neighborhood character
- Predominantly White (98%)
- Race & ethnicity
- White 98% Hispanic / Latino 2%
- Common ancestry
- Romanian 19% Hungarian 4% Slovak 3%
- Foreign-born
- 0%
Political lean MEDSL · Jefferson
- 2024 margin
- Solid R (+43.9) · D 27.5% · R 71.4% · Other 1.1%
- 2008→2024 swing
- -44.1pp toward R · 2008: 0.2pp · 2024: -43.9pp
- All cycles
- 2024: R+43.9 2020: R+38.4 2016: R+35.7 2012: R+5.5 2008: D+0.2
Not yet ingested
- Civics
- —
Market trends
- HPI YoY
- ▼ -0.64%
- Current HPI
- 234.9381
- Rent YoY
- —
- Metro
- —
- State GDP YoY
- ▲ 1.98%
- F500 in state
- 48
Industry mix (Fortune 500 HQ in OH)
| Industry | F500 HQs | Revenue |
|---|---|---|
| Insurance | 3 | $145B |
|
||
| Industrial Machinery | 3 | $49B |
|
||
| Financial Services | 3 | $24B |
|
||
| Consumer Goods | 2 | $93B |
|
||
| Aerospace / Defense | 2 | $47B |
|
||
| Utilities | 2 | $33B |
|
||
Price history
+33.1% since first listed6 events — show timeline
- 2026-05-06 Pending — MLSNOW
- 2026-04-26 Listed $82,500 MLSNOW
- 2025-12-23 Sold (Public Records) $66,200 Public Records
- 2017-05-10 Sold (Public Records) $63,600 Public Records
- 2017-05-05 Sold (MLS) $63,600 MLSNOW
- 2017-01-23 Listed $62,000 MLSNOW
Property tax history
+14.1%/yrLatest (2025): $734 · +2.2% YoY. Source: county tax records.
Cash-flow waterfall
monthlySold comps — $/sqft
last 12 mo · ≤1 miLoading sold comps…