 11-Plex
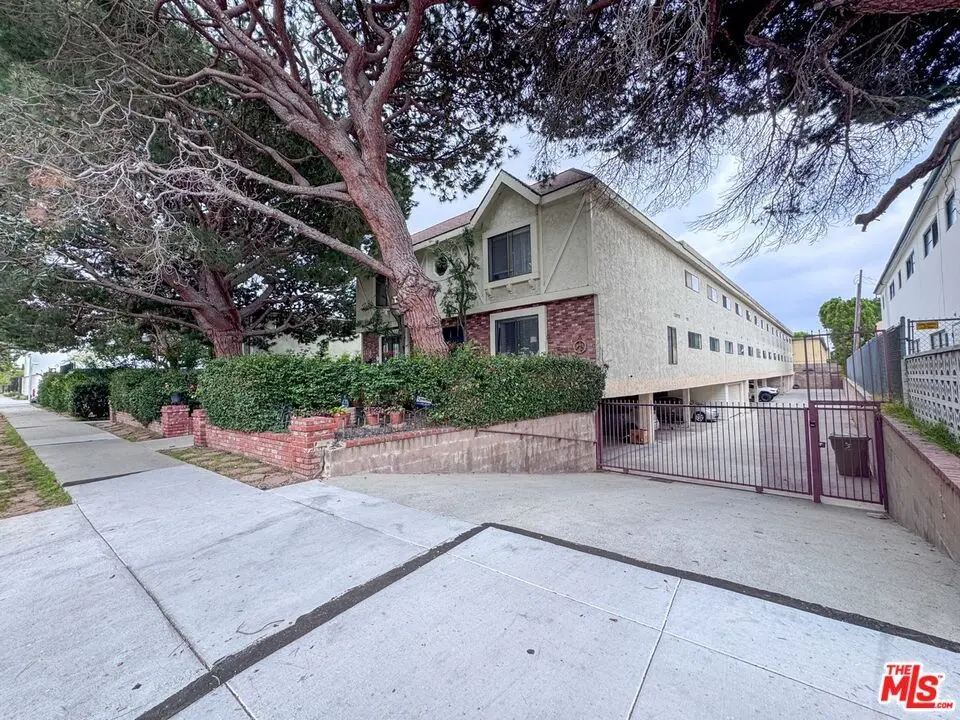
2318 16th St · Santa Monica, CA
Flood risk 1/10 · Minimal
- FEMA flood zone
- X (unshaded)
- Chance of flooding over 30 yrs
- 0.0%
- Est. flood insurance / yr
- $507 – $1,088
Fire risk 1/10 · Minimal
- Est. fire insurance / yr
- $659 – $1,223
Heat risk 6/10 · Moderate
- Hot days now (above 83°F)
- 7 days/yr
- Hot days in 30 yrs
- 20 days/yr
Wind risk 1/10 · Minimal
- Chance of severe wind over 30 yrs
- —
Air-quality risk 4/10 · Minor
- Unhealthy air days now
- 5 days/yr
- Unhealthy air days in 30 yrs
- 6 days/yr
Risk factors via First Street. Map © Google.
Why this score? — see what drove the B+ grade
The composite is a weighted blend of 9 inputs, each scored 0–100. Each bar is that input's sub-score; the figure is the points it added to the 100-point composite (weight × sub-score).
- Cash flow +30.0/30.0
- DSCR +10.0/10.0
- 1% rule +8.1/10.0
- ARV discount +7.5/15.0
- Appreciation +7.5/10.0
- Schools +6.2/10.0
- Livability +3.6/5.0
- Rent growth +2.8/5.0
- Condition / age +2.5/5.0
$4,950,000
🖨 Deal sheet 📄 Offer letter ✓ Due diligence
Multi-family units
County records classify this as Multi-Family (5+ Unit). Listing-text estimate: 11 units. confirmed
5+ unit building — per-unit beds/baths from public records are typically unavailable; the breakdown below (if shown) is an estimate from the listing text.
Listing remarks
Offered as part of a rare six-property portfolio, 2318 16th Street, Santa Monica, CA 90405 presents an outstanding opportunity to acquire a larger-scale, low-density asset with highly desirable unit sizes in one of the Westside's most sought-after coastal neighborhoods. Built in 1977 by the Seller's family, the property reflects long-term pride of ownership and offers investors the ability to establish a meaningful rental footprint in prime Sunset Park. The property consists of 15 exceptionally large units, featuring a dynamic and extremely rare unit mix comprised of 12 two bedroom/two-bath units and 3 three-bedroom/two-bath units. This concentration of larger floor plans is highly sought a
Key facts
- 0.44 acre lot
- 28 parking spots
- Built 1977
Tags
Property features AI
Finance
- Other: One building on the parcel; Unit mix includes three 3-bedroom like-units and twelve 2-bedroom like-units; Example rents: 3-bed unit rent $2,480 (actual $7,441 aggregated), 2-bed unit rent $2,181 (actual $26,169 aggregated)
- Financial info: Gross income reported at 403,322; Gross operating income reported at $406,322; Net operating income reported at $267,164; Total annual expenses reported at $127,058; Cap rate reported at 5.4; Gross rent multiplier reported at 12.18; Reported vacancy rate 0%; Income reported as Actual
- HOA & community: 15 units in the complex
Exterior
- Parking: Assigned gated garage parking; Total of 28 parking spaces
- Security: Gated parking
- Home design: Residential income property; Two floors total; One level unit configuration
- Construction: SMR2* zoning
- Exterior features: No other structures on site; Prime Sunset Park location, north of Ocean Park Blvd
Interior
- Kitchen: Dishwasher; Microwave; Range/Oven; Refrigerator
- Bedrooms: Three-bedroom units (multiple units); Two-bedroom units (multiple units)
- Bathrooms: Two bathrooms in listed unit types
- Heating & cooling: Wall heat; Wall/window cooling units
- Interior features: Built-ins; As-is disclosures
- Laundry & utility: Wall/Window unit cooling; Wall heat
Neighborhood map
What this means for you Summary
Snapshot
- This is a 11 × 3-bed/2.7-bath units multifamily listed at $4.95M.
Deal economics
- At list price, monthly cash flow is $21k ($257k/yr) — positive. Per door: $2k/mo.
- The deal already cash-flows at list — no discount required.
- Meets the 1% rule at list price ($65k rent vs $4.95M).
- Recommended offer: $4.88M (1.5% below list) — sets the bar for market timing.
- Cap rate 11.5% vs local median 1.2% in Santa Monica — top-decile yield for the area; either an underpriced asset or a hidden risk that comps aren't pricing in. Stress-test before assuming the spread holds.
Location & tenants
- Location reads 72/100 on livability (#178 in CA) — a middle-class / working-renter tenant base. Strengths: schools A+, amenities A+, commute A+; Watch: health & safety C-, crime F, cost of living F.
- Santa Monica-Malibu Unified (urban): math 61% / reading 74% proficiency, ranked #123 of 1,400 in CA (top 9%) — acceptable for families but not a draw, mixed tenant base, ~2y average lease.
- Market conditions: Rents rising (+1.1%/yr); 100 active listings in the ZIP; high-income renter base; 19,697 units permitted in Los Angeles County in 2024 (9,426 in 5+ unit buildings).
- At $64,789/mo this rent would consume 641% of the median local household income ($121k/yr) (locally 2402% of renters already pay >50% of income on rent) — very limited rent-growth headroom before tenants either downsize or default.
Forward outlook
- In year one you build about $280k of equity ($34k loan paydown + $246k appreciation (5.0% local appreciation)).
- Los Angeles County population projected at +9% by 2050 — modest demand growth; plan on rents tracking national, not racing it.
- At projected returns (5.0% appreciation + 1.1% rent growth), your $1.39M cash investment doubles in ~3 years — after that, you're playing with house money.
- By year 2, paydown + projected appreciation supports a ~$449k cash-out refi (75% LTV) — recoverable capital for the next deal without selling this one.
Negotiation context
- It's been on market 21 days — a 2% lower offer ($4.88M) is reasonable based on typical stale-listing flexibility.
Risks & watch-outs
- Climate carrying-cost: extreme-heat days projected 7→20/yr by 2055 (HVAC capex compounding) — expect insurance premiums to compound above CPI over the hold.
Questions for the listing agent
- Can we see the unit-by-unit rent roll, current vacancy, and any below-market leases? What's the average tenancy length?
- What capital expenditures (roof, boiler, parking lot, exteriors) have been made in the last 5 years, and what's planned in the next 2?
- Built in 1977 — when were the roof, HVAC, electrical panel, plumbing, and water heater last replaced?
- Is there a deadline driving the sale (1031 exchange, divorce, estate, relocation)? That informs how much negotiation room exists.
- Schools are A-rated — typically a magnet for longer-tenancy family renters. What's the average tenant stay here, and is there a school-zone premium baked into asking?
- Crime grade is F in this area — have there been break-ins, vandalism, or insurance claims at this property in the last 3 years? What carrier currently insures it and at what premium?
- What's the average days-on-market for RENTAL listings here right now (not sales)? A rising rental-DOM trend means longer vacancies and softer asking-rent achievability than the comps imply.
- What's the recent tenant-quality profile in this submarket — average credit score on applications, eviction rate, late-payment / NSF rate, and stable-employment percentage? A property-management company in the area should have these aggregated.
- How much new apartment / multifamily construction is in the pipeline within 1–3 miles? Heavy new supply (>2% of stock underway) typically softens rents 12–24 months out; light construction supports rent growth.
Investment metrics
- 1% rule
- 1.31% ✓
- Cap rate
- 11.49%
- Cash-on-cash
- 18.57%
- DSCR
- 1.83
- GRM
- 6.4
CMA / ARV
No comps found within radius.
Projected returns pro-forma
4.97% appreciation · 1.05% rent growth · sell at horizon
- IRR
- 27.7%
- Equity multiple
- 2.71×
- Total profit
- $2,371,001
- Equity at exit
- $2,794,790
- IRR
- 25.8%
- Equity multiple
- 5.16×
- Total profit
- $5,764,876
- Equity at exit
- $4,814,923
Cash invested: $1,386,000 (down + closing). Projections, not guarantees.
Landlord ↔ Tenant lean methodology
- Overall (STATE)
- 18 Strongly Tenant-Friendly
- State California
- 18 Strongly Tenant-Friendly · D+13
- County
- — inherits STATE
- City
- — inherits STATE
ZIP-level market 90405
- Home prices YoY
- 1.2%
- Rents YoY
- 1.1%
- Active inventory
- 100
- Price-to-rent
- 70.0×
Monthly cashflow live
- Estimated rent
- $64,789 high interval (Pro) →
- Mortgage (P&I)
- −$25,958
- Tax from tax record
- −$1,711 /mo · $20,531/yr
- Insurance
- −$2,062
- HOA
- −$0
- Vacancy / Maint / Mgmt
- −$13,606
- Net cashflow
- $21,452
Break-even live
11-unit breakdown (identical units grouped — click to expand)
| Units | Beds | Baths | Est. rent |
|---|---|---|---|
| 11× units | 3 | 2.7 | $64,790 |
| #1 | 3 | 2.7 | $5,890 |
| #2 | 3 | 2.7 | $5,890 |
| #3 | 3 | 2.7 | $5,890 |
| #4 | 3 | 2.7 | $5,890 |
| #5 | 3 | 2.7 | $5,890 |
| #6 | 3 | 2.7 | $5,890 |
| #7 | 3 | 2.7 | $5,890 |
| #8 | 3 | 2.7 | $5,890 |
| #9 | 3 | 2.7 | $5,890 |
| #10 | 3 | 2.7 | $5,890 |
| #11 | 3 | 2.7 | $5,890 |
| Total (11 units) | $64,789 | ||
UW: 25.0% down · 7.5% · 30yr · 1.5% tax · 5.0% vac · 8.0% maint · 8.0% mgmt
Financing live
Cash to close
- Down payment
- $1,237,500
- Closing costs
- $148,500
- Reserves months
- —
- Total cash needed
- —
Loan-product check · same deal, 3 products live
Conventional
25% down · 7.5% · 30yr
- Down + closing
- —
- Monthly P&I
- —
- Monthly cashflow
- —
- DSCR
- —
- Eligible?
- —
Personal DTI + credit; lowest rate.
DSCR
20% down · 8.5% · 30yr
- Down + closing
- —
- Monthly P&I
- —
- Monthly cashflow
- —
- DSCR
- —
- Eligible?
- —
No personal income docs; deal must DSCR.
Hard money
10% down · 12.0% · 12mo
- Down + closing
- —
- Monthly P&I
- —
- Monthly cashflow
- —
- DSCR
- —
- Eligible?
- —
Short-term bridge; refi at stabilization.
Listing history 15 events
-
2026-06-17status $4,950,000 Pending 21 DOM
-
2026-06-17days on market $4,950,000 Active 21 DOM
-
2026-06-16days on market $4,950,000 Active 20 DOM
-
2026-06-15days on market $4,950,000 Active 19 DOM
-
2026-06-13days on market $4,950,000 Active 17 DOM
-
2026-06-13days on market $4,950,000 Active 16 DOM
-
2026-06-09days on market $4,950,000 Active 13 DOM
-
2026-06-08days on market $4,950,000 Active 12 DOM
-
2026-06-07days on market $4,950,000 Active 11 DOM
-
2026-06-04days on market $4,950,000 Active 8 DOM
-
2026-06-03days on market $4,950,000 Active 7 DOM
-
2026-06-02days on market $4,950,000 Active 6 DOM
-
2026-06-01days on market $4,950,000 Active 5 DOM
-
2026-05-31days on market $4,950,000 Active 4 DOM
-
2026-05-27$4,950,000 Active
ⓘ Source: listings_history table (triggers on properties + properties_extension) + one-shot
backfill from property_details.listing_events for pre-trigger history.
Tax reassessment forecast CA · Resets to sale price
- Current annual tax
- $20,531 · $1,711/mo
- Projected year-2 tax
- $37,620 · $3,135/mo
- Expected delta
- +$17,089/yr (+$1,424/mo · 83.2%)
ⓘ Screening estimate from a state-policy table — verify with the county assessor before closing.
Climate risk First Street
- Flood 1/10 Low FEMA zone X (unshaded) · 0% chance over 30 yrs
- Wildfire 1/10 Low
- Heat 6/10 Major 7 d/yr ≥83°F today · 20 d/yr by 30 yrs out
- Wind 1/10 Low
- Air quality 4/10 Moderate 5 unhealthy d/yr today · 6 by 30 yrs out
Nearby sold comps map
Loading sold comps map…
Walkable amenities ~0.75 mi
Loading nearby amenities…
Taxation est. · year 1
- Rental income
- $777,468
- − Mortgage interest
- −$277,277
- − Property taxes
- −$20,531
- − Insurance
- −$24,750
- − Repairs & maintenance
- −$62,197
- − Management
- −$62,197
- − Depreciation
- −$144,000
- Taxable income
- $186,515
- Est. tax owed @ 24.0%
- −$44,764
- After-tax cash flow
- $212,655/yr
For passive investors: Depreciation is non-cash, so a rental often shows a tax loss while cash-flowing — sheltering income. Rental losses are passive: they offset passive income freely, and up to $25,000/yr can offset ordinary (W-2) income if you actively participate and your MAGI is under $100k (phasing out to $0 by $150k); unused losses carry forward. On sale, claimed depreciation is recaptured at up to 25%, and gains may owe capital-gains tax (a 1031 exchange can defer both). Figures are a year-1 estimate at your 24.0% rate — not tax advice; consult a CPA.
Schools (NCES district)
- District
- Santa Monica-Malibu Unified
- NCES district ID
- 0635700
- Math proficiency
- 61% ▬ 0.00%
- Reading proficiency
- 74% ▬ 0.00%
- Median HH income
- $81,489
- Composite
- 61.58/100
- National rank
- #1535
- State rank
- #123 of 1400 in CA
Livability — Santa Monica
- Score
- 72/100
- State rank
- #178
- US rank
- #5878
Category grades
Schools grade is shown separately in the Schools card above.
Census & demographics
- Census place
- Santa Monica, CA
- County
- Los Angeles County · 9,444,647 people
- City population
- 93,581
- Metro
- Los Angeles-Long Beach-Anaheim, CA
- Population (ZIP)
- 27,298
- Household income
- $121,241
- Rent vs Own
- Severe rent burden
- 2402.0
Population outlook (Los Angeles County) Hauer SSP2
- Today (2025)
- 10,940,515 people
- By 2030
- 11,256,481 · +2.9%
- By 2040
- 11,729,929 · +7.2%
- By 2050
- 11,948,407 · +9.2%
- By 2075
- 11,818,114 · +8.0%
- By 2100
- 10,842,928 · -0.9%
Race, ethnicity, and origin ACS 2023
- Neighborhood character
- Predominantly White (66%)
- Race & ethnicity
- White 66% Hispanic / Latino 15% Two or more races 12% Asian 8% Black 4%
- Hispanic origin (detail)
- Mexican 9%
- Common ancestry
- Romanian 5% Italian 4% Scotch-Irish 4%
- Foreign-born
- 22% · Canada, China, Dominican Republic
- Languages at home
- 73% English-only · Spanish 10% Other Indo-European 5% Other Asian/Pacific 3%
Political lean MEDSL · Los Angeles
- 2024 margin
- Solid D (+32.9) · D 64.8% · R 31.9% · Other 3.3%
- 2008→2024 swing
- -7.4pp toward R · 2008: 40.4pp · 2024: 32.9pp
- All cycles
- 2024: D+32.9 2020: D+44.2 2016: D+48.0 2012: D+40.0 2008: D+40.4
Not yet ingested
- Civics
- —
Market trends
- HPI YoY
- ▲ 4.97%
- Current HPI
- 434.8689
- Rent YoY
- ▲ 1.05%
- Metro
- Los Angeles-Long Beach-Anaheim, CA
- State GDP YoY
- ▲ 3.21%
- F500 in state
- 116
Industry mix (Fortune 500 HQ in CA)
| Industry | F500 HQs | Revenue |
|---|---|---|
| Technology | 27 | $1,492B |
|
||
| Financial Services | 3 | $174B |
|
||
| Retail | 3 | $44B |
|
||
| Insurance | 3 | $26B |
|
||
| Media / Entertainment | 2 | $115B |
|
||
| Pharmaceuticals / Biotech | 2 | $62B |
|
||
Price history
1 event — show timeline
- 2026-05-27 Listed $4,950,000 TheMLS
Property tax history
+2.3%/yrLatest (2025): $20,531 · +6.9% YoY. Source: county tax records.
Cash-flow waterfall
monthlySold comps — $/sqft
last 12 mo · ≤1 miLoading sold comps…