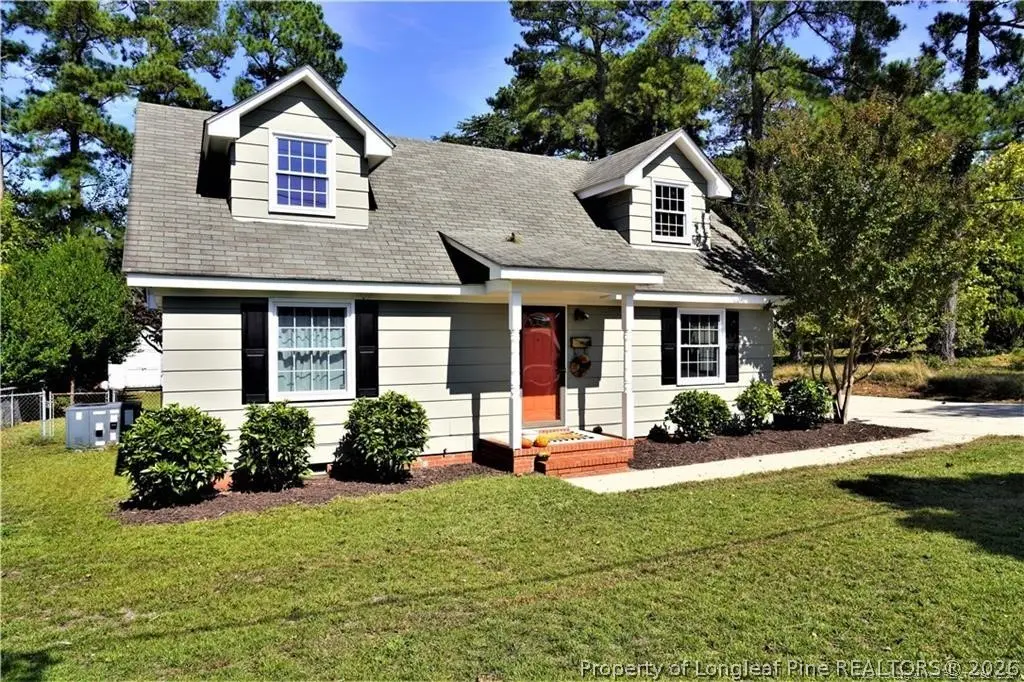
524 Country Club Dr · Fayetteville, NC
Flood risk 7/10 · Major
- FEMA flood zone
- X (unshaded)
- Chance of flooding over 30 yrs
- 0.77%
- Est. flood insurance / yr
- $507 – $1,088
Fire risk 4/10 · Minor
- Est. fire insurance / yr
- $906 – $1,684
Heat risk 8/10 · Major
- Hot days now (above 106°F)
- 7 days/yr
- Hot days in 30 yrs
- 16 days/yr
Wind risk 7/10 · Major
- Chance of severe wind over 30 yrs
- 75.0%
Air-quality risk 2/10 · Minimal
- Unhealthy air days now
- 0 days/yr
- Unhealthy air days in 30 yrs
- 1 days/yr
Risk factors via First Street. Map © Google.
Why this score? — see what drove the D+ grade
The composite is a weighted blend of 9 inputs, each scored 0–100. Each bar is that input's sub-score; the figure is the points it added to the 100-point composite (weight × sub-score).
- Cash flow +14.7/30.0
- ARV discount +12.7/15.0
- DSCR +4.5/10.0
- Livability +3.8/5.0
- 1% rule +3.7/10.0
- Rent growth +3.4/5.0
- Schools +3.1/10.0
- Condition / age +2.5/5.0
- Appreciation +0.0/10.0
$210,000
🖨 Deal sheet (PDF) 📄 Offer letter ✓ Due diligence
Listing remarks MLS
COUNTRY CLUB DRIVE - MOVE IN READY- NO CARPET - Home has hardwood floors, luxury vinyl in Kitchen - This great home offers four bedrooms - two up and two down and each floor has a full bath. The gorgeous hardwood floors are throughout the home & the Kitchen has luxury vinyl. SS appliances to include refrigerator and dishwasher less than 2 yrs old, gas stove, and shelving made of cherry wood. The open space of the Great Room & Dining Rm is flooded with natural light! The sliding doors at the dining room allow entertaining with ease for inside/outside gatherings! The deck is very spacious and the back yard is huge! Shed in backyard and firepit. Drive poured within the last year. Located up the road from Ramsey w/ access to I-295 allows for an easy commute to Fort Bragg, Pope Airfield, Raleigh. ..
Key facts
- Fenced back yard
- Updates in bathrooms
- Updates in kitchen
Tags
Property features AI
Exterior
- Parking: Parking details not provided
- Security: Smoke detectors
- Utilities: Public water; Public sewer
- Home design: Single‑family residence; Two levels; Zoned SF10 (Single Family Res 10)
- Construction: Frame and Masonite construction
- Exterior features: Porch; Fenced back yard; Exterior storage
Interior
- Kitchen: Free‑standing electric range; Free‑standing refrigerator; Dishwasher; Electric water heater
- Bedrooms: Total of 5 rooms (bedroom count not specified)
- Flooring: Hardwood; Laminate; Vinyl
- Bathrooms: 2 full bathrooms
- Heating & cooling: Natural gas heating; Central electric air conditioning
- Interior features: Laminate counters; Window coverings / treatments; Storage
- Laundry & utility: Washer and dryer included; Washer hookup in unit; Crawl space
Neighborhood map
What this means for you Summary
Snapshot
- This is a 4-bed/2.0-bath single-family listed at $210k.
Deal economics
- At list price, monthly cash flow is $-12 ($-141/yr) — negative.
- To cash-flow at today's rent, offer at most $208k (1.0% below list).
- To meet the 1% rule (rent ≥ 1% of price), the offer needs to be $183k (12.8% below list).
- Recommended offer: $183k (12.8% below list) — sets the bar for 1% rule.
- Cap rate 6.6% vs local median 4.9% in Fayetteville — top-decile yield for the area; either an underpriced asset or a hidden risk that comps aren't pricing in. Stress-test before assuming the spread holds.
Location & tenants
- Location reads 75/100 on livability (#45 in NC, #4,031 nationally) — a middle-class / working-renter tenant base. Strengths: commute A+, cost of living A+, housing A+; Watch: crime F, employment D-.
- Cumberland County Schools (urban): math 32% / reading 41% proficiency, ranked #126 of 178 in NC (top 71%) — families likely to look elsewhere, expect single-tenant / working-renter base with shorter leases.
- Zoned schools: E E Smith High (math 42% / reading 41%, grade F, #381 of 535 statewide, top 72%, 1,004 students, 99% FRL) — zoned schools average 99% FRL vs 55% district-wide (45 pts higher); higher-poverty schools than district average — tighter screening recommended.
- Market conditions: Rents rising (+3.5%/yr); 132 active listings in the ZIP; 20 comparable units currently listed for rent nearby; rentals at typical pace (median 24d on market — plan ~3-4 weeks tenant-placement turnaround); lower-income renter base — watch delinquency; 1,125 units permitted in Cumberland County in 2024 (104 in 5+ unit buildings).
- At $1,832/mo this rent would consume 56% of the median local household income ($39k/yr) (locally 1389% of renters already pay >50% of income on rent) — very limited rent-growth headroom before tenants either downsize or default.
Forward outlook
- Local home prices are declining (-3.0%/yr); year-one equity from $1k of loan paydown is wiped out by about $6k of value loss. Plan a longer hold.
Negotiation context
- It's been on market 20 days — a 2% lower offer ($207k) is reasonable based on typical stale-listing flexibility.
- 4 sale attempts since 6y ago with the ask held roughly flat each time — persistent listings suggest the price (not the market) is what's stuck; bring a comps-based counter.
- Current owner paid $180k; 17% above their basis — modest negotiation headroom, anchor on the comps not their cost.
Risks & watch-outs
- Watch-outs: flood insurance adds $66/mo.
- Climate carrying-cost: major flood risk; major wind risk, 75% chance of damaging wind over 30y; extreme-heat days projected 7→16/yr by 2055 (HVAC capex compounding) — expect insurance premiums to compound above CPI over the hold.
Questions for the listing agent
- What do current leases actually rent for vs. the listed asking? Can we see a recent rent roll and the last 12 months of T-12 income?
- Built in 1964 — when were the roof, HVAC, electrical panel, plumbing, and water heater last replaced?
- What's the actual annual flood-insurance premium (NFIP or private), and is the property in a SFHA with mandatory coverage?
- Is there a deadline driving the sale (1031 exchange, divorce, estate, relocation)? That informs how much negotiation room exists.
- Crime grade is F in this area — have there been break-ins, vandalism, or insurance claims at this property in the last 3 years? What carrier currently insures it and at what premium?
- The area grade is low — what's the realistic commute time and amenity access for the typical tenant pool here? Any planned neighborhood developments (good or bad) we should know about?
- What's the average days-on-market for RENTAL listings here right now (not sales)? A rising rental-DOM trend means longer vacancies and softer asking-rent achievability than the comps imply.
- What's the recent tenant-quality profile in this submarket — average credit score on applications, eviction rate, late-payment / NSF rate, and stable-employment percentage? A property-management company in the area should have these aggregated.
- How much new for-sale + rental construction is in the pipeline within 1–3 miles? Heavy new supply typically softens prices + rents 12–24 months out; constrained supply supports both.
Investment metrics
- 1% rule
- 0.87% ✗
- Cap rate
- 6.61%
- Cash-on-cash
- 1.12%
- DSCR
- 1.05
- GRM
- 9.6
CMA / ARV
- ARV (on-the-fly)
- $237,576
- Comps found
- 12
Show comp detail 12 sales within ~0.75 mi
| Address | Dist | Beds/Ba | Sqft | Sold | Price | $/sf | Match |
|---|---|---|---|---|---|---|---|
| 3420 Green Valley Rd | 0.18mi | 3/2.0 (-1) | 1,440 (-8%) | 1mo | $242,500 | $168 | 73 |
| 3597 St Andrews Ct | 0.29mi | 3/2.0 (-1) | 1,689 (+8%) | 8mo | $243,900 | $144 | 62 |
| 3538 Gables Dr | 0.32mi | 3/2.5 (-1) | 1,701 (+9%) | 3mo | $263,000 | $155 | 61 |
| 230 Chloe Dr | 0.30mi | 3/2.5 (-1) | 1,671 (+7%) | 9mo | $235,000 | $141 | 60 |
| 1655 Rock Creek Ln | 0.39mi | 4/2.0 | 1,788 (+14%) | 3mo | $274,500 | $154 | 55 |
| 225 Chloe Dr | 0.33mi | 3/2.5 (-1) | 1,740 (+11%) | 4mo | $240,000 | $138 | 55 |
| 3115 Wedgewood Dr | 0.36mi | 4/3.0 | 1,797 (+15%) | 2mo | $195,000 | $109 | 53 |
| 607 Oakdale Dr | 0.57mi | 3/2.0 (-1) | 1,479 (-5%) | 8mo | $225,000 | $152 | 53 |
| 3565 Hastings Dr | 0.39mi | 3/2.5 (-1) | 1,719 (+10%) | 10mo | $235,000 | $137 | 50 |
| 529 Grafton Ave | 0.33mi | 3/1.0 (-1) | 1,350 (-14%) | 7mo | $172,500 | $128 | 47 |
| 3640 Hastings Dr | 0.56mi | 3/2.0 (-1) | 1,368 (-12%) | 2mo | $217,500 | $159 | 46 |
| 3644 Hastings Dr | 0.57mi | 3/2.0 (-1) | 1,350 (-14%) | 2mo | $229,977 | $170 | 44 |
Match score weights: distance 35% · size 25% · config 20% · recency 20%. Top-matched comps best support the ARV.
Projected returns pro-forma
-3.0% appreciation · 3.49% rent growth · sell at horizon
- IRR
- -16.1%
- Equity multiple
- 0.42×
- Total profit
- $-33,835
- Equity at exit
- $31,312
- IRR
- -6.9%
- Equity multiple
- 0.55×
- Total profit
- $-26,531
- Equity at exit
- $18,157
Cash invested: $58,800 (down + closing). Projections, not guarantees.
Landlord ↔ Tenant lean methodology
- Overall (STATE)
- 85 Strongly Landlord-Friendly
- State North Carolina
- 85 Strongly Landlord-Friendly · R+3
- County
- — inherits STATE
- City
- — inherits STATE
ZIP-level market 28301
- Home prices YoY
- -12.5%
- Rents YoY
- 3.5%
- Active inventory
- 132
- Price-to-rent
- 9.6×
Monthly cashflow live
- Estimated rent
- $1,832 high interval (Pro) →
- Mortgage (P&I)
- −$1,101
- Tax from tax record
- −$204 /mo · $2,444/yr
- Insurance
- −$88
- Flood insurance flood zone
- −$66 /mo · $798/yr
- HOA
- −$0
- Vacancy / Maint / Mgmt
- −$385
- Net cashflow
- $-12
Break-even live
Sensitivity live
| Price | -10% $107 | -5% $48 | +0% $-12 | +5% $-71 | +10% $-131 |
|---|---|---|---|---|---|
| Rent | -10% $-156 | -5% $-84 | +0% $-12 | +5% $61 | +10% $133 |
| Rate | -1.0pp $94 | -0.5pp $42 | base $-12 | +0.5pp $-66 | +1.0pp $-121 |
UW: 25.0% down · 7.5% · 30yr · 1.5% tax · 5.0% vac · 8.0% maint · 8.0% mgmt
Financing live
Cash to close
- Down payment
- $52,500
- Closing costs
- $6,300
- Reserves months
- —
- Total cash needed
- —
Loan-product check · same deal, 3 products live
Conventional
25% down · 7.5% · 30yr
- Down + closing
- —
- Monthly P&I
- —
- Monthly cashflow
- —
- DSCR
- —
- Eligible?
- —
Personal DTI + credit; lowest rate.
DSCR
20% down · 8.5% · 30yr
- Down + closing
- —
- Monthly P&I
- —
- Monthly cashflow
- —
- DSCR
- —
- Eligible?
- —
No personal income docs; deal must DSCR.
Hard money
10% down · 12.0% · 12mo
- Down + closing
- —
- Monthly P&I
- —
- Monthly cashflow
- —
- DSCR
- —
- Eligible?
- —
Short-term bridge; refi at stabilization.
Rent comps 20 comps
| Address | Beds | Baths | Sqft | Rent | $/sqft | DOM | Units | Dist |
|---|---|---|---|---|---|---|---|---|
| 1641 Mount Rainer Dr Fayetteville, NC | 3.0 | 2.5 | 2000 | $1,950 | $0.97 | 14d | 1 | 0.33mi |
| 1645 Mount Rainer Dr Fayetteville, NC | 4.0 | 2.5 | 2130 | $2,100 | $0.99 | 24d | 1 | 0.33mi |
| 1659 Rock Creek Ln Fayetteville, NC | 4.0 | 2.5 | 1777 | $2,100 | $1.18 | 14d | 1 | 0.35mi |
| 3557 Hastings Dr Fayetteville, NC | 4.0 | 2.5 | 1652 | $1,795 | $1.09 | 24d | 1 | 0.41mi |
| 715 Ashburton Dr Fayetteville, NC | 3.0 | 2.0 | 1278 | $1,600 | $1.25 | 24d | 1 | 0.68mi |
| 733 Ashburton Dr Fayetteville, NC | 3.0 | 1.5 | 1118 | $1,300 | $1.16 | 24d | 1 | 0.72mi |
| 3523 Rosehill Rd Fayetteville, NC | 4.0 | 1.0 | 1448 | $1,450 | $1.00 | 14d | 1 | 0.78mi |
| 3446 Sandystone Cir Fayetteville, NC | 3.0 | 2.5 | 1489 | $1,700 | $1.14 | 24d | 1 | 0.92mi |
| 3517 Gowan Ln Fayetteville, NC | 3.0 | 2.5 | 1792 | $1,750 | $0.98 | 24d | 1 | 0.98mi |
| 4453 Oakmont Cir Fayetteville, NC | 3.0 | 1.0 | 1101 | $1,300 | $1.18 | 14d | 1 | 1.00mi |
| 118 Circle Ct Fayetteville, NC | 3.0 | 2.0 | 1496 | $1,550 | $1.04 | 14d | 1 | 1.04mi |
| 4016 Bankside Dr Fayetteville, NC | 3.0 | 2.5 | 1846 | $1,800 | $0.98 | 14d | 1 | 1.07mi |
| 3519 Rolls Ave Fayetteville, NC | 3.0 | 2.0 | 1625 | $1,700 | $1.05 | 14d | 1 | 1.10mi |
| 228 Eastwood Ave Fayetteville, NC | 3.0 | 2.0 | 1820 | $1,755 | $0.96 | 24d | 1 | 1.12mi |
| 2737 Kentberry Ave Fayetteville, NC | 2.0–3.0 | 2.0 | 1209 | $1,400 | $1.16 | 14d | 5 | 1.17mi |
| 3963 Loufield Dr Fayetteville, NC | 3.0 | 2.0 | 1446 | $1,500 | $1.04 | 24d | 1 | 1.22mi |
| 2532 Sourwood Dr Fayetteville, NC | 4.0 | 2.0 | 1562 | $1,700 | $1.09 | 24d | 1 | 1.25mi |
| 3611 Tindall Ct Fayetteville, NC | 3.0 | 2.0 | 1813 | $2,300 | $1.27 | 14d | 1 | 1.27mi |
| 3613 Pine Lake Dr Fayetteville, NC | 1.0–3.0 | 1.0–2.0 | 1116 | $1,645 | $1.47 | 14d | 31 | 1.29mi |
| 2846 Copenhagen Dr Fayetteville, NC | 3.0 | 2.0 | 1100 | $1,600 | $1.45 | 24d | 1 | 1.42mi |
Listing history 16 events
-
2026-06-18days on market $210,000 Active 20 DOM
-
2026-06-17days on market $210,000 Active 19 DOM
-
2026-06-16days on market $210,000 Active 18 DOM
-
2026-06-15days on market $210,000 Active 17 DOM
-
2026-06-14days on market $210,000 Active 15 DOM
-
2026-06-13days on market $210,000 Active 14 DOM
-
2026-06-10days on market $210,000 Active 12 DOM
-
2026-06-09days on market $210,000 Active 11 DOM
-
2026-06-08days on market $210,000 Active 10 DOM
-
2026-06-07days on market $210,000 Active 9 DOM
-
2026-06-03days on market $210,000 Active 5 DOM
-
2026-06-02days on market $210,000 Active 4 DOM
-
2026-06-01days on market $210,000 Active 3 DOM
-
2026-05-31days on market $210,000 Active 2 DOM
-
2026-05-30remarks 273-char remark
-
2026-05-30$210,000 Active 1 DOM
ⓘ Source: listings_history table (triggers on properties + properties_extension) + one-shot
backfill from property_details.listing_events for pre-trigger history.
Tax reassessment forecast NC · Resets to sale price
- Current annual tax
- $2,444 · $204/mo
- Projected year-2 tax
- $2,444 · $204/mo
- Expected delta
- $0/yr ($0/mo · 0.0%)
ⓘ Screening estimate from a state-policy table — verify with the county assessor before closing.
Climate risk First Street
- Flood 7/10 Severe FEMA zone X (unshaded) · 77% chance over 30 yrs
- Wildfire 4/10 Moderate
- Heat 8/10 Severe 7 d/yr ≥106°F today · 16 d/yr by 30 yrs out
- Wind 7/10 Severe 75% chance of damaging wind over 30 yrs
- Air quality 2/10 Low 0 unhealthy d/yr today · 1 by 30 yrs out
Nearby sold comps map
Loading sold comps map…
Walkable amenities ~0.75 mi
Loading nearby amenities…
Taxation est. · year 1
- Rental income
- $21,982
- − Mortgage interest
- −$11,763
- − Property taxes
- −$2,444
- − Insurance
- −$1,847
- − Repairs & maintenance
- −$1,759
- − Management
- −$1,759
- − Depreciation
- −$6,109
- Taxable loss
- −$3,699
- Est. tax savings @ 24.0%
- +$888
- After-tax cash flow
- $747/yr
For passive investors: Depreciation is non-cash, so a rental often shows a tax loss while cash-flowing — sheltering income. Rental losses are passive: they offset passive income freely, and up to $25,000/yr can offset ordinary (W-2) income if you actively participate and your MAGI is under $100k (phasing out to $0 by $150k); unused losses carry forward. On sale, claimed depreciation is recaptured at up to 25%, and gains may owe capital-gains tax (a 1031 exchange can defer both). Figures are a year-1 estimate at your 24.0% rate — not tax advice; consult a CPA.
Schools (NCES district)
- District
- Cumberland County Schools
- NCES district ID
- 3700011
- Math proficiency
- 32% ▼ -2.00%
- Reading proficiency
- 41% ▼ -1.00%
- Median HH income
- $44,168
- Composite
- 31.0/100
- National rank
- #6096
- State rank
- #126 of 178 in NC
Livability — Fayetteville
- Score
- 75/100
- State rank
- #45
- US rank
- #4031
Category grades
Schools grade is shown separately in the Schools card above.
Census & demographics
- Census place
- Fayetteville, NC
- County
- Cumberland County · 265,314 people
- City population
- 226,118
- Metro
- Fayetteville, NC
- Population (ZIP)
- 16,798
- Household income
- $39,198
- Rent vs Own
- Severe rent burden
- 1389.0
Population outlook (Cumberland County) Hauer SSP2
- Today (2025)
- 330,855 people
- By 2030
- 333,523 · +0.8%
- By 2040
- 335,583 · +1.4%
- By 2050
- 335,325 · +1.4%
- By 2075
- 342,853 · +3.6%
- By 2100
- 340,698 · +3.0%
Race, ethnicity, and origin ACS 2023
- Neighborhood character
- Predominantly Black (68%)
- Race & ethnicity
- Black 68% White 19% Two or more races 6% Hispanic / Latino 5%
- Common ancestry
- Serbian 1% Slovak 1% Romanian 1%
- Foreign-born
- 3% · Canada
- Languages at home
- 95% English-only · Spanish 3% French/Haitian/Cajun 1%
Political lean MEDSL · Cumberland
- 2024 margin
- D (+13.4) · D 56.1% · R 42.7% · Other 1.2%
- 2008→2024 swing
- -4.3pp toward R · 2008: 17.7pp · 2024: 13.4pp
- All cycles
- 2024: D+13.4 2020: D+16.6 2016: D+16.0 2012: D+19.7 2008: D+17.7
Not yet ingested
- Civics
- —
Market trends
- HPI YoY
- ▼ -37.92%
- Current HPI
- 265.98
- Rent YoY
- ▲ 3.49%
- Metro
- Fayetteville, NC
- State GDP YoY
- ▲ 3.28%
- F500 in state
- 26
Industry mix (Fortune 500 HQ in NC)
| Industry | F500 HQs | Revenue |
|---|---|---|
| Financial Services | 2 | $213B |
|
||
| Retail | 2 | $95B |
|
||
| Industrial Conglomerate | 1 | $38B |
|
||
| Metals / Steel | 1 | $35B |
|
||
| Utilities | 1 | $30B |
|
||
| Industrial Machinery | 1 | $19B |
|
||
Price history
+101.0% since first listed12 events — show timeline
- 2026-05-28 Listed $210,000 LPRMLS
- 2022-12-12 Sold (Public Records) $180,000 Public Records
- 2022-12-12 Sold (MLS) $180,000 LPRMLS
- 2022-10-16 Delisted — LPRMLS
- 2022-10-11 Listed $174,900 LPRMLS
- 2020-12-09 Sold (Public Records) $137,500 Public Records
- 2020-12-08 Sold (MLS) $137,500 TMLS
- 2020-12-08 Sold (MLS) $137,500 LPRMLS
- 2020-08-06 Listed $137,500 TMLS
- 2020-08-06 Listed $137,500 LPRMLS
- 2008-07-22 Sold (Public Records) $119,000 Public Records
- 2005-03-31 Sold (Public Records) $104,500 Public Records
Property tax history
+4.6%/yrLatest (2025): $2,444 · +67.1% YoY. Source: county tax records.
Cash-flow waterfall
monthlySold comps — $/sqft
last 12 mo · ≤1 miLoading sold comps…