115 W Spencer Ave · Wildwood, NJ
Flood risk No data
- FEMA flood zone
- —
- Chance of flooding over 30 yrs
- —
- Est. flood insurance / yr
- —
Fire risk No data
- Est. fire insurance / yr
- —
Heat risk No data
- Hot days now (above threshold)
- —
- Hot days in 30 yrs
- —
Wind risk No data
- Chance of severe wind over 30 yrs
- —
Air-quality risk No data
- Unhealthy air days now
- —
- Unhealthy air days in 30 yrs
- —
Risk factors via First Street. Map © Google.
Why this score? — see what drove the D+ grade
The composite is a weighted blend of 9 inputs, each scored 0–100. Each bar is that input's sub-score; the figure is the points it added to the 100-point composite (weight × sub-score).
- Cash flow +18.4/30.0
- ARV discount +7.8/15.0
- DSCR +5.8/10.0
- 1% rule +4.9/10.0
- Condition / age +4.8/5.0
- Livability +3.7/5.0
- Rent growth +2.5/5.0
- Schools +1.6/10.0
- Appreciation +0.0/10.0
$804,900
🖨 Deal sheet 📄 Offer letter ✓ Due diligence
Listing remarks
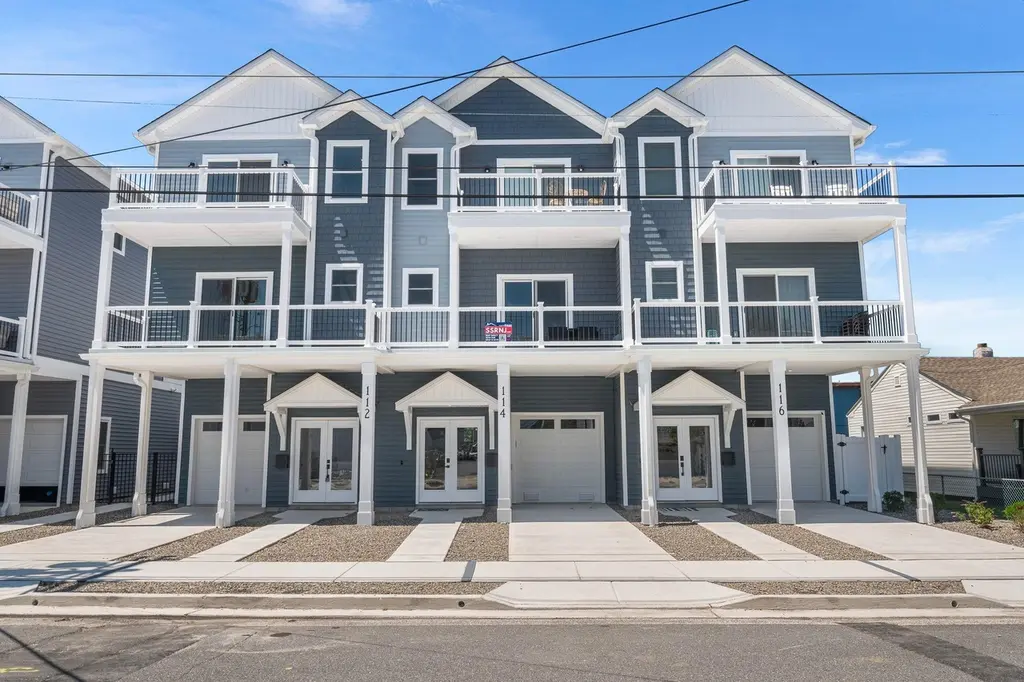
READY FOR MAY 2026! Welcome to Seaside Solis - an exclusive new community where luxury, comfort, and connection come together in perfect balance. This premier enclave features 18 fee-simple townhomes, each individually deeded and insured, arranged in six buildings of three homes each to create a beautiful neighborhood. At the heart of Seaside Solis is the resort-style pool - the perfect place to relax, refresh, and connect. Lounge under the sun, take a leisurely swim, or mingle with neighbors in a serene setting. Nearby, a dedicated kiddie pool offers a safe, fun spot for little ones to splash and play. The expansive community recreation area is ideal for gatherings of all kinds. From fam
Key facts
- Garage
- Pool
- Built 2026
Neighborhood map
What this means for you Summary
Snapshot
- This is a 4-bed/3.5-bath single-family listed at $805k. Condition is rated excellent.
Deal economics
- At list price, monthly cash flow is $758 ($9k/yr) — positive.
- The deal already cash-flows at list — no discount required.
- To meet the 1% rule (rent ≥ 1% of price), the offer needs to be $800k (0.6% below list).
- Recommended offer: $800k (0.6% below list) — sets the bar for 1% rule.
- Cap rate 7.4% vs local median 5.6% in Wildwood — top-decile yield for the area; either an underpriced asset or a hidden risk that comps aren't pricing in. Stress-test before assuming the spread holds.
Location & tenants
- Location reads 74/100 on livability (#176 in NJ, #4,679 nationally) — a middle-class / working-renter tenant base. Strengths: amenities A+, commute A+, health & safety A+; Watch: employment D, schools F, crime F.
- Wildwood City School District (suburban): math 12% / reading 27% proficiency, ranked #442 of 472 in NJ (top 94%) — low school quality limits family demand, transient renter base, plan for 1-2y turnover; 80% free/reduced lunch — lower-income household profile, screen leases tightly.
- Market conditions: 431 active listings in the ZIP; 1 comparable units currently listed for rent nearby; 877 units permitted in Cape May County in 2024 (35 in 5+ unit buildings).
Forward outlook
- Local home prices are declining (-3.0%/yr); year-one equity from $6k of loan paydown is wiped out by about $24k of value loss. Plan a longer hold.
- Cape May County population projected at -24% by 2050 — secular population decline; favor cash flow + early exit over multi-decade hold.
Negotiation context
- Only 0 days on market — expect competitive offers; lowballing is unlikely to land.
Questions for the listing agent
- Is there a deadline driving the sale (1031 exchange, divorce, estate, relocation)? That informs how much negotiation room exists.
- Schools are F-rated, which usually means shorter tenancies and higher turnover. Who's the typical renter profile here, and what's been the actual vacancy rate?
- Crime grade is F in this area — have there been break-ins, vandalism, or insurance claims at this property in the last 3 years? What carrier currently insures it and at what premium?
- The area grade is low — what's the realistic commute time and amenity access for the typical tenant pool here? Any planned neighborhood developments (good or bad) we should know about?
- What's the average days-on-market for RENTAL listings here right now (not sales)? A rising rental-DOM trend means longer vacancies and softer asking-rent achievability than the comps imply.
- What's the recent tenant-quality profile in this submarket — average credit score on applications, eviction rate, late-payment / NSF rate, and stable-employment percentage? A property-management company in the area should have these aggregated.
- How much new for-sale + rental construction is in the pipeline within 1–3 miles? Heavy new supply typically softens prices + rents 12–24 months out; constrained supply supports both.
Investment metrics
- 1% rule
- 0.99% ✗
- Cap rate
- 7.42%
- Cash-on-cash
- 4.03%
- DSCR
- 1.18
- GRM
- 8.4
CMA / ARV
- ARV (on-the-fly)
- $810,750
- Comps found
- 12
Show comp detail 12 sales within ~0.75 mi
| Address | Dist | Beds/Ba | Sqft | Sold | Price | $/sf | Match |
|---|---|---|---|---|---|---|---|
| 115 W Spencer Ave | 0.00mi | 4/3.5 | 2,350 (0%) | 1mo | $804,900 | $343 | 99 |
| 109 W Spencer Ave | 0.01mi | 4/3.5 | 2,350 (0%) | 1mo | $809,900 | $345 | 99 |
| 103 W Spencer Ave | 0.02mi | 4/3.5 | 2,350 (0%) | 1mo | $809,900 | $345 | 98 |
| 113 W Spencer Ave | 0.00mi | 4/3.5 | 2,400 (+2%) | 1mo | $829,000 | $345 | 96 |
| 111 W Spencer Ave | 0.01mi | 4/3.5 | 2,400 (+2%) | 1mo | $830,000 | $346 | 95 |
| 117 W Spencer Ave | 0.00mi | 4/3.5 | 2,400 (+2%) | 1mo | $815,000 | $340 | 95 |
| 105 W Spencer Ave | 0.01mi | 4/3.5 | 2,400 (+2%) | 1mo | $829,900 | $346 | 95 |
| 112 W Spicer Ave | 0.04mi | 4/3.5 | 2,400 (+2%) | 9mo | $829,000 | $345 | 87 |
| 108 W Spicer Ave | 0.04mi | 4/3.5 | 2,400 (+2%) | 11mo | $804,900 | $335 | 86 |
| 430 W Pine Ave | 0.45mi | 4/2.5 | 2,211 (-6%) | 10mo | $845,000 | $382 | 57 |
| 625 W Montgomery Ave | 0.63mi | 4/3.5 | 2,150 (-8%) | 9mo | $999 | — | 49 |
| 531 W Montgomery Ave | 0.50mi | 3/2.0 (-1) | 2,204 (-6%) | 12mo | $819,900 | $372 | 46 |
Match score weights: distance 35% · size 25% · config 20% · recency 20%. Top-matched comps best support the ARV.
Projected returns pro-forma
-3.0% appreciation · 3.0% rent growth · sell at horizon
- IRR
- -10.0%
- Equity multiple
- 0.64×
- Total profit
- $-82,061
- Equity at exit
- $120,013
- IRR
- -0.6%
- Equity multiple
- 0.96×
- Total profit
- $-8,842
- Equity at exit
- $69,593
Cash invested: $225,372 (down + closing). Projections, not guarantees.
Landlord ↔ Tenant lean methodology
- Overall (STATE)
- 21 Tenant-Leaning
- State New Jersey
- 21 Tenant-Leaning · D+6
- County
- — inherits STATE
- City
- — inherits STATE
ZIP-level market 08260
- Home prices YoY
- -30.7%
- Active inventory
- 431
- Price-to-rent
- 8.4×
Monthly cashflow live
- Estimated rent
- $8,000 medium interval (Pro) →
- Mortgage (P&I)
- −$4,221
- Tax est. 1.5%
- −$1,006 /mo · $12,074/yr
- Insurance
- −$335
- HOA
- −$0
- Vacancy / Maint / Mgmt
- −$1,680
- Net cashflow
- $758
Break-even live
UW: 25.0% down · 7.5% · 30yr · 1.5% tax · 5.0% vac · 8.0% maint · 8.0% mgmt
Financing live
Cash to close
- Down payment
- $201,225
- Closing costs
- $24,147
- Reserves months
- —
- Total cash needed
- —
Loan-product check · same deal, 3 products live
Conventional
25% down · 7.5% · 30yr
- Down + closing
- —
- Monthly P&I
- —
- Monthly cashflow
- —
- DSCR
- —
- Eligible?
- —
Personal DTI + credit; lowest rate.
DSCR
20% down · 8.5% · 30yr
- Down + closing
- —
- Monthly P&I
- —
- Monthly cashflow
- —
- DSCR
- —
- Eligible?
- —
No personal income docs; deal must DSCR.
Hard money
10% down · 12.0% · 12mo
- Down + closing
- —
- Monthly P&I
- —
- Monthly cashflow
- —
- DSCR
- —
- Eligible?
- —
Short-term bridge; refi at stabilization.
Rent comps 1 comps
| Address | Beds | Baths | Sqft | Rent | $/sqft | DOM | Units | Dist |
|---|---|---|---|---|---|---|---|---|
| 536 W Montgomery Ave Wildwood, NJ | 4.0 | 4.0 | 3059 | $8,000 | $2.62 | 43d | 1 | 0.51mi |
Listing history 1 events
-
2025-06-04$804,900
ⓘ Source: listings_history table (triggers on properties + properties_extension) + one-shot
backfill from property_details.listing_events for pre-trigger history.
Nearby sold comps map
Loading sold comps map…
Walkable amenities ~0.75 mi
Loading nearby amenities…
Taxation est. · year 1
- Rental income
- $96,000
- − Mortgage interest
- −$45,087
- − Property taxes
- −$12,074
- − Insurance
- −$4,024
- − Repairs & maintenance
- −$7,680
- − Management
- −$7,680
- − Depreciation
- −$23,415
- Taxable loss
- −$3,960
- Est. tax savings @ 24.0%
- +$950
- After-tax cash flow
- $10,041/yr
For passive investors: Depreciation is non-cash, so a rental often shows a tax loss while cash-flowing — sheltering income. Rental losses are passive: they offset passive income freely, and up to $25,000/yr can offset ordinary (W-2) income if you actively participate and your MAGI is under $100k (phasing out to $0 by $150k); unused losses carry forward. On sale, claimed depreciation is recaptured at up to 25%, and gains may owe capital-gains tax (a 1031 exchange can defer both). Figures are a year-1 estimate at your 24.0% rate — not tax advice; consult a CPA.
Condition & rehab AI · 3 photos
This single-family home is in excellent condition with no visible repairs or maintenance needed. It is move-in ready and offers a great opportunity for investment with potential for both resale and rental value increases through minor updates.
Value-add opportunities
- Both Painting the exterior — A fresh coat of paint can enhance the curb appeal and increase both resale and rental value.
- Both Landscaping improvements — Enhancing the landscaping can improve the overall aesthetic and increase both resale and rental value.
- Both Interior updates — Updating the interior can make the home more appealing and increase both resale and rental value.
Renovation cost estimate screening
Value-add ROI direction
- Both Painting the exterior — A fresh coat of paint can enhance the curb appeal and increase both resale and rental value. ↑
- Both Landscaping improvements — Enhancing the landscaping can improve the overall aesthetic and increase both resale and rental value. ↑
- Both Interior updates — Updating the interior can make the home more appealing and increase both resale and rental value. ↑
ⓘ Cost ranges are severity-bucket heuristics (US national rule-of-thumb). Get contractor quotes + a written scope before underwriting a rehab budget.
Schools (NCES district)
- District
- Wildwood City School District
- NCES district ID
- 3417940
- Math proficiency
- 12% ▼ -6.00%
- Reading proficiency
- 27% ▲ 5.00%
- Median HH income
- $33,232
- Composite
- 15.84/100
- National rank
- #9261
- State rank
- #442 of 472 in NJ
Livability — Wildwood
- Score
- 74/100
- State rank
- #176
- US rank
- #4679
Category grades
Schools grade is shown separately in the Schools card above.
Census & demographics
- Census place
- Wildwood, NJ
- Population (ZIP)
- 12,913
Population outlook (Cape May County) Hauer SSP2
- Today (2025)
- 88,234 people
- By 2030
- 84,144 · -4.6%
- By 2040
- 75,146 · -14.8%
- By 2050
- 67,389 · -23.6%
- By 2075
- 55,732 · -36.8%
- By 2100
- 44,972 · -49.0%
Race, ethnicity, and origin ACS 2023
- Neighborhood character
- Predominantly White (78%)
- Race & ethnicity
- White 78% Hispanic / Latino 14% Two or more races 7% Black 3% Native American 1%
- Hispanic origin (detail)
- Mexican 10% Puerto Rican 3%
- Common ancestry
- Romanian 7% Slovak 2% Lithuanian 1%
- Foreign-born
- 9% · Canada
- Languages at home
- 84% English-only · Spanish 12% Other Indo-European 3% French/Haitian/Cajun 1%
Political lean MEDSL · Cape May
- 2024 margin
- R (+19.2) · D 39.7% · R 58.9% · Other 1.4%
- 2008→2024 swing
- -10.6pp toward R · 2008: -8.7pp · 2024: -19.2pp
- All cycles
- 2024: R+19.2 2020: R+15.9 2016: R+19.9 2012: R+8.9 2008: R+8.7
Not yet ingested
- Civics
- —
Market trends
- HPI YoY
- ▼ -243.83%
- Current HPI
- 551.3393
- Rent YoY
- —
- Metro
- —
- State GDP YoY
- ▲ 2.05%
- F500 in state
- 34
Industry mix (Fortune 500 HQ in NJ)
| Industry | F500 HQs | Revenue |
|---|---|---|
| Consumer Goods | 3 | $31B |
|
||
| Pharmaceuticals | 2 | $153B |
|
||
| Technology | 2 | $21B |
|
||
| Insurance | 2 | $20B |
|
||
| Healthcare | 2 | $19B |
|
||
| Financial Services | 1 | $70B |
|
||
Price history
1 event — show timeline
- 2025-06-04 Listed $804,900 CMCMLS
Cash-flow waterfall
monthlySold comps — $/sqft
last 12 mo · ≤1 miLoading sold comps…