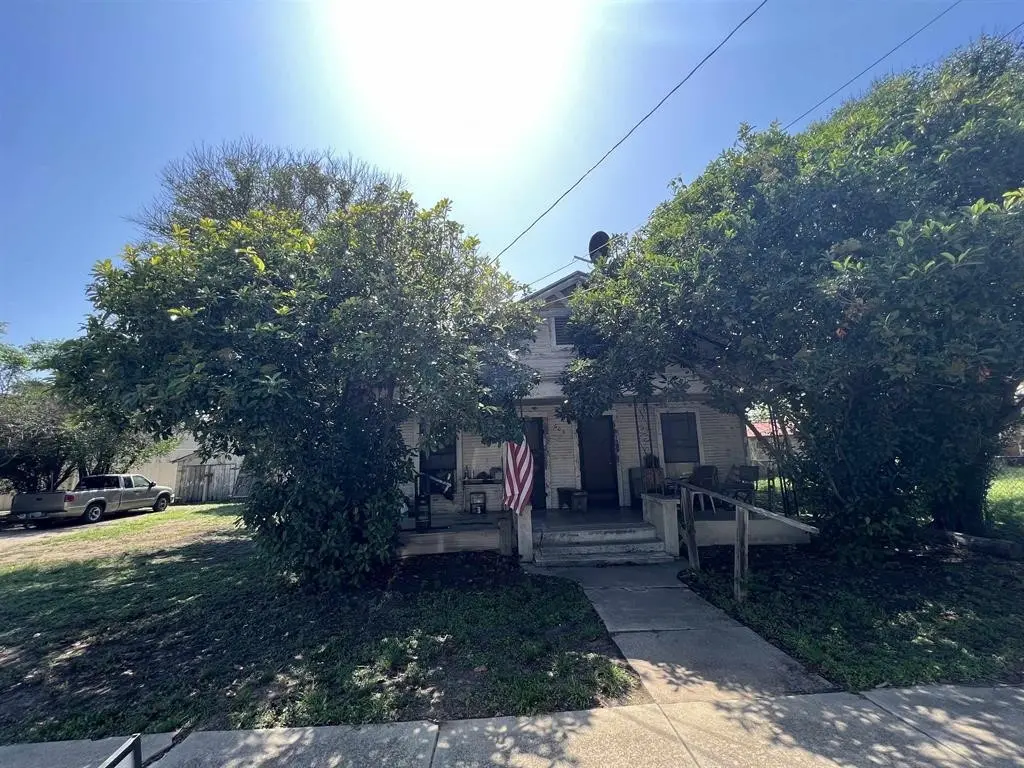
606 S Chestnut St · Lampasas, TX
Flood risk No data
- FEMA flood zone
- —
- Chance of flooding over 30 yrs
- —
- Est. flood insurance / yr
- —
Fire risk No data
- Est. fire insurance / yr
- —
Heat risk No data
- Hot days now (above threshold)
- —
- Hot days in 30 yrs
- —
Wind risk No data
- Chance of severe wind over 30 yrs
- —
Air-quality risk No data
- Unhealthy air days now
- —
- Unhealthy air days in 30 yrs
- —
Risk factors via First Street. Map © Google.
Why this score? — see what drove the C grade
The composite is a weighted blend of 9 inputs, each scored 0–100. Each bar is that input's sub-score; the figure is the points it added to the 100-point composite (weight × sub-score).
- Cash flow +20.8/30.0
- ARV discount +15.0/15.0
- DSCR +6.6/10.0
- 1% rule +4.5/10.0
- Schools +3.8/10.0
- Livability +3.8/5.0
- Rent growth +2.5/5.0
- Condition / age +2.5/5.0
- Appreciation +0.0/10.0
$120,000
🖨 Deal sheet 📄 Offer letter ✓ Due diligence
Listing remarks
Great opportunity to own this investment property 1 block off of Key Avenue in the ever growing city of Lampasas. Being close to H-E-Band behind the new laundry mat it is zoned Commercial/Residential.
Key facts
- 0.23 acre lot
- Parking
- Built 1950
Neighborhood map
What this means for you Summary
Snapshot
- This is a 2-bed/1.0-bath single-family listed at $120k.
Deal economics
- At list price, monthly cash flow is $164 ($2k/yr) — positive.
- The deal already cash-flows at list — no discount required.
- To meet the 1% rule (rent ≥ 1% of price), the offer needs to be $114k (5.1% below list).
- Recommended offer: $109k (9.0% below list) — sets the bar for market timing.
- Cap rate 7.9% vs local median 2.0% in Lampasas — top-decile yield for the area; either an underpriced asset or a hidden risk that comps aren't pricing in. Stress-test before assuming the spread holds.
Location & tenants
- Location reads 75/100 on livability (#123 in TX, #3,832 nationally) — a middle-class / working-renter tenant base. Strengths: cost of living A+, housing A+, health & safety A+; Watch: schools D+, employment D, crime F.
- Lampasas ISD (rural): math 42% / reading 46% proficiency, ranked #278 of 826 in TX (top 34%) — families likely to look elsewhere, expect single-tenant / working-renter base with shorter leases.
- Market conditions: 342 active listings in the ZIP; 7 comparable units currently listed for rent nearby; rentals leasing fast (median 13d on market — plan ~1-2 weeks tenant-placement turnaround); 18 units permitted in Lampasas County in 2024 (0 in 5+ unit buildings).
Forward outlook
- Local home prices are declining (-3.0%/yr); year-one equity from $830 of loan paydown is wiped out by about $4k of value loss. Plan a longer hold.
- Lampasas County population projected at +10% by 2050 — modest demand growth; plan on rents tracking national, not racing it.
Negotiation context
- It's been on market 95 days — a 9% lower offer ($109k) is reasonable based on typical stale-listing flexibility.
- 6 sale attempts since 3y ago; this cycle's ask has dropped $10k (8%) from the opening price — seller is motivated, your offer sets the floor, not the list.
Risks & watch-outs
- Watch-outs: built in 1950 — expect roof / HVAC / electrical / plumbing capex.
Questions for the listing agent
- It's been on market 95 days. Have you received any prior offers? Is the seller open to a 9% concession, seller financing, or rate buy-down credit?
- Built in 1950 — when were the roof, HVAC, electrical panel, plumbing, and water heater last replaced?
- Why hasn't it sold? Are there any deal-killer items the seller is aware of (foundation, flood, title, zoning, code violations)?
- Is there a deadline driving the sale (1031 exchange, divorce, estate, relocation)? That informs how much negotiation room exists.
- Schools are D-rated, which usually means shorter tenancies and higher turnover. Who's the typical renter profile here, and what's been the actual vacancy rate?
- Crime grade is F in this area — have there been break-ins, vandalism, or insurance claims at this property in the last 3 years? What carrier currently insures it and at what premium?
- What's the average days-on-market for RENTAL listings here right now (not sales)? A rising rental-DOM trend means longer vacancies and softer asking-rent achievability than the comps imply.
- What's the recent tenant-quality profile in this submarket — average credit score on applications, eviction rate, late-payment / NSF rate, and stable-employment percentage? A property-management company in the area should have these aggregated.
- How much new for-sale + rental construction is in the pipeline within 1–3 miles? Heavy new supply typically softens prices + rents 12–24 months out; constrained supply supports both.
Investment metrics
- 1% rule
- 0.95% ✗
- Cap rate
- 7.93%
- Cash-on-cash
- 5.85%
- DSCR
- 1.26
- GRM
- 8.8
CMA / ARV
- ARV (on-the-fly)
- $151,200
- Comps found
- 9
Show comp detail 9 sales within ~0.75 mi
| Address | Dist | Beds/Ba | Sqft | Sold | Price | $/sf | Match |
|---|---|---|---|---|---|---|---|
| 612 Brown St | 0.60mi | 3/1.0 (+1) | 1,008 (0%) | 3mo | $130,000 | $129 | 65 |
| 205 S Porter St | 0.75mi | 2/1.0 | 1,020 (+1%) | 4mo | $179,000 | $175 | 60 |
| 102 S Western Ave | 0.36mi | 2/1.0 | 910 (-10%) | 10mo | $126,000 | $138 | 59 |
| 1202 Bridge St | 0.63mi | 2/1.0 | 952 (-6%) | 3mo | $70,000 | $74 | 59 |
| 1005 Bridge St | 0.51mi | 2/2.0 | 1,125 (+12%) | 1mo | $215,000 | $191 | 52 |
| 404 W Avenue B | 0.55mi | 3/1.0 (+1) | 888 (-12%) | 10mo | $180,000 | $203 | 41 |
| 18 Del Norte St | 0.62mi | 3/2.0 (+1) | 1,138 (+13%) | 3mo | $120,000 | $105 | 38 |
| 11 Bellaire Ave | 0.64mi | 3/1.5 (+1) | 1,152 (+14%) | 2mo | $172,500 | $150 | 37 |
| 27 Hollywood Dr | 0.62mi | 3/2.0 (+1) | 1,100 (+9%) | 23mo | $199,900 | $182 | 28 |
Match score weights: distance 35% · size 25% · config 20% · recency 20%. Top-matched comps best support the ARV.
Projected returns pro-forma
-3.0% appreciation · 3.0% rent growth · sell at horizon
- IRR
- -7.3%
- Equity multiple
- 0.73×
- Total profit
- $-9,045
- Equity at exit
- $17,892
- IRR
- 2.3%
- Equity multiple
- 1.16×
- Total profit
- $5,402
- Equity at exit
- $10,375
Cash invested: $33,600 (down + closing). Projections, not guarantees.
Landlord ↔ Tenant lean methodology
- Overall (STATE)
- 87 Strongly Landlord-Friendly
- State Texas
- 87 Strongly Landlord-Friendly · R+5
- County
- — inherits STATE
- City
- — inherits STATE
ZIP-level market 76550
- Home prices YoY
- -22.3%
- Active inventory
- 342
- Price-to-rent
- 8.8×
Monthly cashflow live
- Estimated rent
- $1,138 high interval (Pro) →
- Mortgage (P&I)
- −$629
- Tax from tax record
- −$56 /mo · $674/yr
- Insurance
- −$50
- HOA
- −$0
- Vacancy / Maint / Mgmt
- −$239
- Net cashflow
- $164
Break-even live
UW: 25.0% down · 7.5% · 30yr · 1.5% tax · 5.0% vac · 8.0% maint · 8.0% mgmt
Financing live
Cash to close
- Down payment
- $30,000
- Closing costs
- $3,600
- Reserves months
- —
- Total cash needed
- —
Loan-product check · same deal, 3 products live
Conventional
25% down · 7.5% · 30yr
- Down + closing
- —
- Monthly P&I
- —
- Monthly cashflow
- —
- DSCR
- —
- Eligible?
- —
Personal DTI + credit; lowest rate.
DSCR
20% down · 8.5% · 30yr
- Down + closing
- —
- Monthly P&I
- —
- Monthly cashflow
- —
- DSCR
- —
- Eligible?
- —
No personal income docs; deal must DSCR.
Hard money
10% down · 12.0% · 12mo
- Down + closing
- —
- Monthly P&I
- —
- Monthly cashflow
- —
- DSCR
- —
- Eligible?
- —
Short-term bridge; refi at stabilization.
Rent comps 7 comps
| Address | Beds | Baths | Sqft | Rent | $/sqft | DOM | Units | Dist |
|---|---|---|---|---|---|---|---|---|
| 501 S Broad St Lampasas, TX | 1.0 | 1.0 | 775 | $900 | $1.16 | 13d | 1 | 0.17mi |
| 205 S Broad St Lampasas, TX | 2.0 | 1.0 | 952 | $1,000 | $1.05 | 4d | 1 | 0.28mi |
| 202 N Walnut St Lampasas, TX | 2.0 | 1.5 | 1000 | $1,000 | $1.00 | 13d | 1 | 0.43mi |
| 207 N Ridge St Unit B Lampasas, TX | 3.0 | 2.0 | 1267 | $1,875 | $1.48 | 4d | 1 | 0.50mi |
| 1109 East Avenue F Unit F Lampasas, TX | 3.0 | 2.0 | 1356 | $1,700 | $1.25 | 44d | 1 | 0.96mi |
| 106 N Fairview St Lampasas, TX | 3.0 | 1.5 | 1392 | $1,700 | $1.22 | 14d | 1 | 1.00mi |
| 1705 Taylor St Unit A Lampasas, TX | 2.0 | 1.5 | 882 | $975 | $1.11 | 23d | 1 | 1.05mi |
Listing history 17 events
-
2023-09-21status Pending
-
2023-09-21status Pending
-
2023-09-21historical
-
2023-09-08status Active
-
2023-09-08status Active
-
2023-08-31status Pending
-
2023-08-31status Pending
-
2023-08-23price $120,000
-
2023-08-23price $120,000
-
2023-08-21price $120,000
-
2023-08-17status Active
-
2023-07-10status Active
-
2023-05-25status Pending
-
2023-05-25historical Active Under Contract
-
2023-04-25$130,000 Active
-
2023-04-25$130,000 Active
-
2006-02-15soldstatus
ⓘ Source: listings_history table (triggers on properties + properties_extension) + one-shot
backfill from property_details.listing_events for pre-trigger history.
Tax reassessment forecast TX · Resets to sale price
- Current annual tax
- $674 · $56/mo
- Projected year-2 tax
- $2,196 · $183/mo
- Expected delta
- +$1,522/yr (+$127/mo · 225.7%)
ⓘ Screening estimate from a state-policy table — verify with the county assessor before closing.
Nearby sold comps map
Loading sold comps map…
Walkable amenities ~0.75 mi
Loading nearby amenities…
Taxation est. · year 1
- Rental income
- $13,662
- − Mortgage interest
- −$6,722
- − Property taxes
- −$674
- − Insurance
- −$600
- − Repairs & maintenance
- −$1,093
- − Management
- −$1,093
- − Depreciation
- −$3,491
- Taxable loss
- −$11
- Est. tax savings @ 24.0%
- +$3
- After-tax cash flow
- $1,970/yr
For passive investors: Depreciation is non-cash, so a rental often shows a tax loss while cash-flowing — sheltering income. Rental losses are passive: they offset passive income freely, and up to $25,000/yr can offset ordinary (W-2) income if you actively participate and your MAGI is under $100k (phasing out to $0 by $150k); unused losses carry forward. On sale, claimed depreciation is recaptured at up to 25%, and gains may owe capital-gains tax (a 1031 exchange can defer both). Figures are a year-1 estimate at your 24.0% rate — not tax advice; consult a CPA.
Schools (NCES district)
- District
- Lampasas ISD
- NCES district ID
- 4826640
- Math proficiency
- 42% ▼ -3.00%
- Reading proficiency
- 46% ▬ 0.00%
- Median HH income
- $51,042
- Composite
- 37.9/100
- National rank
- #4314
- State rank
- #278 of 826 in TX
Livability — Lampasas
- Score
- 75/100
- State rank
- #123
- US rank
- #3832
Category grades
Schools grade is shown separately in the Schools card above.
Census & demographics
- Census place
- Lampasas, TX
- Population (ZIP)
- 13,699
Population outlook (Lampasas County) Hauer SSP2
- Today (2025)
- 22,114 people
- By 2030
- 22,779 · +3.0%
- By 2040
- 23,812 · +7.7%
- By 2050
- 24,403 · +10.4%
- By 2075
- 25,713 · +16.3%
- By 2100
- 25,053 · +13.3%
Race, ethnicity, and origin ACS 2023
- Neighborhood character
- Predominantly White (72%)
- Race & ethnicity
- White 72% Hispanic / Latino 21% Two or more races 13%
- Hispanic origin (detail)
- Mexican 16% Puerto Rican 2%
- Common ancestry
- Lithuanian 3% Slovak 3% Romanian 2%
- Foreign-born
- 4% · Canada
- Languages at home
- 87% English-only · Spanish 11% German/W. Germanic 1%
Political lean MEDSL · Lampasas
- 2024 margin
- Solid R (+59.6) · D 19.8% · R 79.3%
- 2008→2024 swing
- -10.5pp toward R · 2008: -49.1pp · 2024: -59.6pp
- All cycles
- 2024: R+59.6 2020: R+57.1 2016: R+60.0 2012: R+57.8 2008: R+49.1
Not yet ingested
- Civics
- —
Market trends
- HPI YoY
- ▼ -71.55%
- Current HPI
- 249.3057
- Rent YoY
- —
- Metro
- —
- State GDP YoY
- ▲ 3.95%
- F500 in state
- 110
Industry mix (Fortune 500 HQ in TX)
| Industry | F500 HQs | Revenue |
|---|---|---|
| Energy | 16 | $1,198B |
|
||
| Technology | 5 | $198B |
|
||
| Engineering / Construction | 4 | $72B |
|
||
| Energy Services | 3 | $60B |
|
||
| Utilities | 3 | $41B |
|
||
| Healthcare | 2 | $330B |
|
||
Price history
-7.7% since first listed17 events — show timeline
- 2023-09-21 Pending — Unlock MLS
- 2023-09-21 Pending — CTXMLS
- 2023-09-21 Listing Removed — CTXMLS
- 2023-09-08 Relisted — Unlock MLS
- 2023-09-08 Relisted — CTXMLS
- 2023-08-31 Pending — Unlock MLS
- 2023-08-31 Pending — CTXMLS
- 2023-08-23 Price Changed $120,000 Unlock MLS
- 2023-08-23 Price Changed $120,000 CTXMLS
- 2023-08-21 Price Changed $120,000 HLMLS as distributed by MLS GRID
- 2023-08-17 Relisted — CTXMLS
- 2023-07-10 Relisted — Unlock MLS
- 2023-05-25 Pending — Unlock MLS
- 2023-05-25 Contingent — CTXMLS
- 2023-04-25 Listed $130,000 CTXMLS
- 2023-04-25 Listed $130,000 Unlock MLS
- 2006-02-15 Sold (Public Records) — Public Records
Property tax history
-0.2%/yrLatest (2025): $674 · -13.4% YoY. Source: county tax records.
Cash-flow waterfall
monthlySold comps — $/sqft
last 12 mo · ≤1 miLoading sold comps…