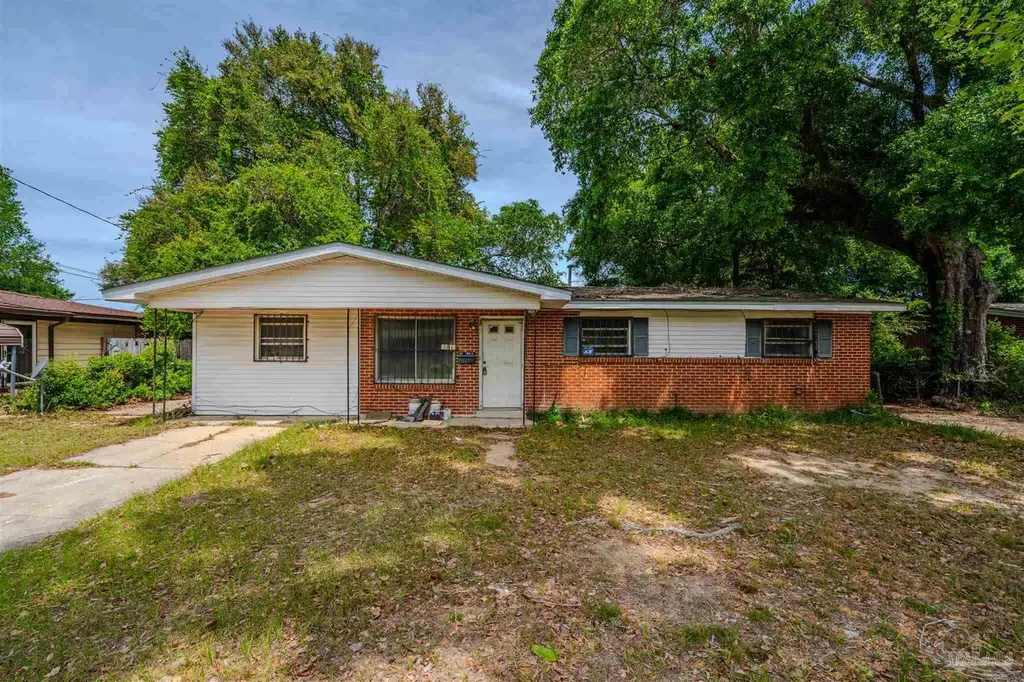
1111 Revere Dr · West Pensacola, FL
Flood risk 1/10 · Minimal
- FEMA flood zone
- X (unshaded)
- Chance of flooding over 30 yrs
- 0.0%
- Est. flood insurance / yr
- $507 – $1,088
Fire risk 1/10 · Minimal
- Est. fire insurance / yr
- $947 – $1,759
Heat risk 10/10 · Severe
- Hot days now (above 105°F)
- 7 days/yr
- Hot days in 30 yrs
- 24 days/yr
Wind risk 9/10 · Severe
- Chance of severe wind over 30 yrs
- 99.0%
Air-quality risk 1/10 · Minimal
- Unhealthy air days now
- 0 days/yr
- Unhealthy air days in 30 yrs
- 0 days/yr
Risk factors via First Street. Map © Google.
Why this score? — see what drove the B+ grade
The composite is a weighted blend of 9 inputs, each scored 0–100. Each bar is that input's sub-score; the figure is the points it added to the 100-point composite (weight × sub-score).
- Cash flow +30.0/30.0
- ARV discount +15.0/15.0
- DSCR +10.0/10.0
- 1% rule +9.0/10.0
- Rent growth +3.7/5.0
- Schools +3.6/10.0
- Livability +3.3/5.0
- Condition / age +2.5/5.0
- Appreciation +0.0/10.0
$115,000
🖨 Deal sheet 📄 Offer letter ✓ Due diligence
Listing remarks MLS
Investor special with serious upside potential! This 3-bedroom, 2-bath brick home is already in the early stages of renovation and ready for your vision to bring it to completion. Interior work has been started with portions of drywall replaced, some areas opened to the studs, and a layout that can be reimagined to maximize value. The home features a solid brick exterior, screened-in back porch, and sits on a spacious lot with mature trees. A major bonus is the large detached garage/workshop in the rear—perfect for multiple vehicles, storage, or a future workspace. Located in a convenient Pensacola area with easy access to shopping, dining, and main roads, this property presents an excellent opportunity for investors, flippers, or buyers looking to build equity. Property is being sold as-is.
Key facts
- Spacious lot
- Brick home
- Workshop
Tags
Neighborhood map
What this means for you Summary
Snapshot
- This is a 3-bed/2.0-bath single-family listed at $115k.
Deal economics
- At list price, monthly cash flow is $480 ($6k/yr) — positive.
- The deal already cash-flows at list — no discount required.
- Meets the 1% rule at list price ($2k rent vs $115k).
- Recommended offer: $112k (3.0% below list) — sets the bar for market timing.
- Cap rate 11.3% vs local median 7.7% in West Pensacola — top-decile yield for the area; either an underpriced asset or a hidden risk that comps aren't pricing in. Stress-test before assuming the spread holds.
Location & tenants
- Location reads 66/100 on livability (#629 in FL) — a middle-class / working-renter tenant base. Strengths: cost of living A+, housing A+, health & safety B+; Watch: crime D, schools F, amenities F.
- Escambia (suburban): math 40% / reading 45% proficiency, ranked #56 of 73 in FL (top 77%) — families likely to look elsewhere, expect single-tenant / working-renter base with shorter leases.
- Market conditions: Rents rising fast (+4.9%/yr); 198 active listings in the ZIP; 19 comparable units currently listed for rent nearby; rentals at typical pace (median 24d on market — plan ~3-4 weeks tenant-placement turnaround); lower-income renter base — watch delinquency; 1,479 units permitted in Escambia County in 2024 (0 in 5+ unit buildings).
- This rent runs 43% of the median local income ($45k/yr) — at the standard rent-burdened threshold; future hikes will face affordability resistance.
Forward outlook
- Local home prices are declining (-3.0%/yr); year-one equity from $795 of loan paydown is wiped out by about $3k of value loss. Plan a longer hold.
- Escambia County population projected at +13% by 2050 — modest demand growth; plan on rents tracking national, not racing it.
- At projected returns (-3.0% appreciation + 4.9% rent growth), your $32k cash investment doubles in ~6 years — after that, you're playing with house money.
Negotiation context
- It's been on market 58 days — a 3% lower offer ($112k) is reasonable based on typical stale-listing flexibility.
- 3 sale attempts since 24y ago; this cycle's ask has dropped $20k (15%) from the opening price — seller is motivated, your offer sets the floor, not the list.
- Current owner paid $68k; list at $115k implies a 69% gain — meaningful room to come down on a strong offer.
Risks & watch-outs
- Climate carrying-cost: severe wind risk, 99% chance of damaging wind over 30y; extreme-heat days projected 7→24/yr by 2055 (HVAC capex compounding) — expect insurance premiums to compound above CPI over the hold.
Questions for the listing agent
- It's been on market 58 days. Have you received any prior offers? Is the seller open to a 3% concession, seller financing, or rate buy-down credit?
- Built in 1964 — when were the roof, HVAC, electrical panel, plumbing, and water heater last replaced?
- Is there a deadline driving the sale (1031 exchange, divorce, estate, relocation)? That informs how much negotiation room exists.
- Schools are F-rated, which usually means shorter tenancies and higher turnover. Who's the typical renter profile here, and what's been the actual vacancy rate?
- Crime grade is D in this area — have there been break-ins, vandalism, or insurance claims at this property in the last 3 years? What carrier currently insures it and at what premium?
- What's the average days-on-market for RENTAL listings here right now (not sales)? A rising rental-DOM trend means longer vacancies and softer asking-rent achievability than the comps imply.
- What's the recent tenant-quality profile in this submarket — average credit score on applications, eviction rate, late-payment / NSF rate, and stable-employment percentage? A property-management company in the area should have these aggregated.
- How much new for-sale + rental construction is in the pipeline within 1–3 miles? Heavy new supply typically softens prices + rents 12–24 months out; constrained supply supports both.
Investment metrics
- 1% rule
- 1.40% ✓
- Cap rate
- 11.30%
- Cash-on-cash
- 17.88%
- DSCR
- 1.80
- GRM
- 6.0
CMA / ARV
- ARV (median comp)
- $179,717
- List price
- $115,000
- Delta
- -36.01%
- Verdict
- UNDERPRICED
- Comps
- 20 within 1.0 mi
Show comp detail 12 sales within ~0.75 mi
| Address | Dist | Beds/Ba | Sqft | Sold | Price | $/sf | Match |
|---|---|---|---|---|---|---|---|
| 1102 Revere Dr | 0.06mi | 3/1.5 | 1,396 (+10%) | 1mo | $95,000 | $68 | 78 |
| 305 N Madison Dr | 0.20mi | 4/2.0 (+1) | 1,373 (+8%) | 1mo | $200,000 | $146 | 72 |
| 832 S Madison Dr | 0.30mi | 4/1.0 (+1) | 1,290 (+1%) | 9mo | $131,000 | $102 | 67 |
| 10 Tennessee Dr | 0.57mi | 3/2.0 | 1,318 (+3%) | 1mo | $260,000 | $197 | 67 |
| 99 S Madison Dr | 0.52mi | 3/1.0 | 1,286 (+1%) | 8mo | $153,000 | $119 | 63 |
| 923 S Madison Dr | 0.40mi | 4/2.0 (+1) | 1,368 (+7%) | 2mo | $180,000 | $132 | 62 |
| 117 Aquamarine Ave | 0.68mi | 3/1.0 | 1,243 (-2%) | 1mo | $82,500 | $66 | 59 |
| 6 Georgia Dr | 0.54mi | 4/2.0 (+1) | 1,206 (-5%) | 3mo | $157,000 | $130 | 58 |
| 1012 Edison Dr | 0.33mi | 2/1.5 (-1) | 1,391 (+9%) | 8mo | $175,000 | $126 | 55 |
| 3320 Two Sisters Way | 0.57mi | 3/2.0 | 1,140 (-11%) | 0mo | $210,000 | $184 | 55 |
| 203 Opal Ave | 0.56mi | 3/1.0 | 1,412 (+11%) | 9mo | $80,000 | $57 | 44 |
| 300 Louisiana Dr | 0.50mi | 2/1.0 (-1) | 1,456 (+14%) | 8mo | $33,500 | $23 | 38 |
Match score weights: distance 35% · size 25% · config 20% · recency 20%. Top-matched comps best support the ARV.
Projected returns pro-forma
-3.0% appreciation · 4.92% rent growth · sell at horizon
- IRR
- 11.6%
- Equity multiple
- 1.47×
- Total profit
- $15,112
- Equity at exit
- $17,147
- IRR
- 22.0%
- Equity multiple
- 3.05×
- Total profit
- $66,108
- Equity at exit
- $9,943
Cash invested: $32,200 (down + closing). Projections, not guarantees.
Landlord ↔ Tenant lean methodology
- Overall (STATE)
- 87 Strongly Landlord-Friendly
- State Florida
- 87 Strongly Landlord-Friendly · R+3
- County
- — inherits STATE
- City
- — inherits STATE
ZIP-level market 32505
- Home prices YoY
- -26.5%
- Rents YoY
- 4.9%
- Active inventory
- 198
- Price-to-rent
- 6.0×
Monthly cashflow live
- Estimated rent
- $1,608 high interval (Pro) →
- Mortgage (P&I)
- −$603
- Tax from tax record
- −$139 /mo · $1,673/yr
- Insurance
- −$48
- HOA
- −$0
- Vacancy / Maint / Mgmt
- −$338
- Net cashflow
- $480
Break-even live
UW: 25.0% down · 7.5% · 30yr · 1.5% tax · 5.0% vac · 8.0% maint · 8.0% mgmt
Financing live
Cash to close
- Down payment
- $28,750
- Closing costs
- $3,450
- Reserves months
- —
- Total cash needed
- —
Loan-product check · same deal, 3 products live
Conventional
25% down · 7.5% · 30yr
- Down + closing
- —
- Monthly P&I
- —
- Monthly cashflow
- —
- DSCR
- —
- Eligible?
- —
Personal DTI + credit; lowest rate.
DSCR
20% down · 8.5% · 30yr
- Down + closing
- —
- Monthly P&I
- —
- Monthly cashflow
- —
- DSCR
- —
- Eligible?
- —
No personal income docs; deal must DSCR.
Hard money
10% down · 12.0% · 12mo
- Down + closing
- —
- Monthly P&I
- —
- Monthly cashflow
- —
- DSCR
- —
- Eligible?
- —
Short-term bridge; refi at stabilization.
Rent comps 19 comps
| Address | Beds | Baths | Sqft | Rent | $/sqft | DOM | Units | Dist |
|---|---|---|---|---|---|---|---|---|
| 221 Edison Dr Pensacola, FL | 3.0 | 1.0 | 1500 | $1,598 | $1.07 | 23d | 1 | 0.37mi |
| 707 New York Dr Pensacola, FL | 2.0 | 1.0 | 1266 | $1,185 | $0.94 | 23d | 1 | 0.46mi |
| 3296 Two Sisters Way Pensacola, FL | 4.0 | 2.5 | 1856 | $1,795 | $0.97 | 23d | 1 | 0.55mi |
| 3216 Two Sisters Way Pensacola, FL | 3.0 | 2.0 | 1117 | $1,700 | $1.52 | 23d | 1 | 0.64mi |
| 101 Vanderbilt Rd Pensacola, FL | 3.0 | 2.0 | 1104 | $1,850 | $1.68 | 21d | 1 | 0.98mi |
| 2303 W Michigan Ave Unit A6 Pensacola, FL | 2.0 | 2.0 | 1014 | $1,300 | $1.28 | 23d | 1 | 1.02mi |
| 3417 W Fisher St Unit C Pensacola, FL | 3.0 | 2.0 | 1106 | $1,350 | $1.22 | 23d | 1 | 1.04mi |
| 2301 W Michigan Ave #21 Pensacola, FL | 2.0 | 2.5 | 1164 | $1,325 | $1.14 | 23d | 1 | 1.04mi |
| 2702 Massachusetts Ave Pensacola, FL | 1.0–3.0 | 1.0–2.5 | 1150 | $1,745 | $1.52 | 13d | 9 | 1.05mi |
| 1860 Broyhill Ln Pensacola, FL | 3.0 | 2.0 | 1561 | $1,600 | $1.02 | 23d | 1 | 1.08mi |
| 2355 W Michigan Ave Pensacola, FL | 1.0–2.0 | 1.0–2.0 | 850 | $1,450 | $1.71 | 13d | 9 | 1.09mi |
| 918 Montclair Rd Pensacola, FL | 3.0 | 1.0 | 1012 | $1,500 | $1.48 | 13d | 1 | 1.09mi |
| 3418 Luke St Pensacola, FL | 4.0 | 2.0 | 1620 | $1,800 | $1.11 | 23d | 1 | 1.11mi |
| 5602 W Shore Dr Unit B Pensacola, FL | 2.0 | 2.0 | 920 | $1,250 | $1.36 | 23d | 1 | 1.13mi |
| 2300 W Michigan Ave #12 Pensacola, FL | 2.0 | 2.0 | 1050 | $1,300 | $1.24 | 23d | 1 | 1.16mi |
| 918 Fremont Ave Pensacola, FL | 3.0 | 1.0 | 1756 | $1,450 | $0.83 | 13d | 1 | 1.28mi |
| 902 Lucerne Ave Pensacola, FL | 3.0 | 2.0 | 1276 | $1,600 | $1.25 | 23d | 1 | 1.30mi |
| 5877 Tryton Cir Pensacola, FL | 4.0 | 2.0 | 1419 | $1,825 | $1.29 | 23d | 1 | 1.46mi |
| 925 Twinbrook Ave Pensacola, FL | 3.0 | 1.0 | 1105 | $1,750 | $1.58 | 23d | 1 | 1.50mi |
Listing history 22 events
-
2026-06-18status $115,000 Active 58 DOM
-
2026-06-18days on market $115,000 Contingent 58 DOM
-
2026-06-17days on market $115,000 Contingent 57 DOM
-
2026-06-16days on market $115,000 Contingent 56 DOM
-
2026-06-15days on market $115,000 Contingent 55 DOM
-
2026-06-14statusdays on market $115,000 Contingent 53 DOM
-
2026-06-10days on market $115,000 Active 50 DOM
-
2026-06-09days on market $115,000 Active 49 DOM
-
2026-06-08days on market $115,000 Active 48 DOM
-
2026-06-07pricedays on market $115,000 Active 47 DOM
-
2026-06-03days on market $120,000 Active 43 DOM
-
2026-06-02days on market $120,000 Active 42 DOM
-
2026-06-01days on market $120,000 Active 41 DOM
-
2026-05-31days on market $120,000 Active 40 DOM
-
2026-05-31days on market $120,000 Active 39 DOM
-
2026-05-14price $125,000 811-char remark
Show marketing remark (811 chars)
Investor special with serious upside potential! This 3-bedroom, 2-bath brick home is already in the early stages of renovation and ready for your vision to bring it to completion. Interior work has been started with portions of drywall replaced, some areas opened to the studs, and a layout that can be reimagined to maximize value. The home features a solid brick exterior, screened-in back porch, and sits on a spacious lot with mature trees. A major bonus is the large detached garage/workshop in the rear—perfect for multiple vehicles, storage, or a future workspace. Located in a convenient Pensacola area with easy access to shopping, dining, and main roads, this property presents an excellent opportunity for investors, flippers, or buyers looking to build equity. Property is being sold as-is.
-
2026-04-21$135,000 Active 811-char remark
Show marketing remark (811 chars)
Investor special with serious upside potential! This 3-bedroom, 2-bath brick home is already in the early stages of renovation and ready for your vision to bring it to completion. Interior work has been started with portions of drywall replaced, some areas opened to the studs, and a layout that can be reimagined to maximize value. The home features a solid brick exterior, screened-in back porch, and sits on a spacious lot with mature trees. A major bonus is the large detached garage/workshop in the rear—perfect for multiple vehicles, storage, or a future workspace. Located in a convenient Pensacola area with easy access to shopping, dining, and main roads, this property presents an excellent opportunity for investors, flippers, or buyers looking to build equity. Property is being sold as-is.
-
2005-05-05soldstatus $67,900 62-char remark
Show marketing remark (62 chars)
TO BE SOLD "AS IS" WIH SELLER OFFERING NO WARRANTIES
-
2005-03-24$69,900 62-char remark
Show marketing remark (62 chars)
TO BE SOLD "AS IS" WIH SELLER OFFERING NO WARRANTIES
-
2002-04-23soldstatus $71,000
-
2002-04-19soldstatus $71,000
-
2002-02-11$71,000
ⓘ Source: listings_history table (triggers on properties + properties_extension) + one-shot
backfill from property_details.listing_events for pre-trigger history.
Tax reassessment forecast FL · Resets to sale price
- Current annual tax
- $1,673 · $139/mo
- Projected year-2 tax
- $1,673 · $139/mo
- Expected delta
- $0/yr ($0/mo · 0.0%)
ⓘ Screening estimate from a state-policy table — verify with the county assessor before closing.
Climate risk First Street
- Flood 1/10 Low FEMA zone X (unshaded) · 0% chance over 30 yrs
- Wildfire 1/10 Low
- Heat 10/10 Extreme 7 d/yr ≥105°F today · 24 d/yr by 30 yrs out
- Wind 9/10 Extreme 99% chance of damaging wind over 30 yrs
- Air quality 1/10 Low 0 unhealthy d/yr today · 0 by 30 yrs out
Nearby sold comps map
Loading sold comps map…
Walkable amenities ~0.75 mi
Loading nearby amenities…
Taxation est. · year 1
- Rental income
- $19,294
- − Mortgage interest
- −$6,442
- − Property taxes
- −$1,673
- − Insurance
- −$575
- − Repairs & maintenance
- −$1,544
- − Management
- −$1,544
- − Depreciation
- −$3,345
- Taxable income
- $4,172
- Est. tax owed @ 24.0%
- −$1,001
- After-tax cash flow
- $4,757/yr
For passive investors: Depreciation is non-cash, so a rental often shows a tax loss while cash-flowing — sheltering income. Rental losses are passive: they offset passive income freely, and up to $25,000/yr can offset ordinary (W-2) income if you actively participate and your MAGI is under $100k (phasing out to $0 by $150k); unused losses carry forward. On sale, claimed depreciation is recaptured at up to 25%, and gains may owe capital-gains tax (a 1031 exchange can defer both). Figures are a year-1 estimate at your 24.0% rate — not tax advice; consult a CPA.
Schools (NCES district)
- District
- Escambia
- NCES district ID
- 1200510
- Math proficiency
- 40% ▼ -9.00%
- Reading proficiency
- 45% ▼ -4.00%
- Median HH income
- $44,649
- Composite
- 36.04/100
- National rank
- #4773
- State rank
- #56 of 73 in FL
Livability — West Pensacola
- Score
- 66/100
- State rank
- #629
- US rank
- #12275
Category grades
Schools grade is shown separately in the Schools card above.
Census & demographics
- Census place
- West Pensacola, FL
- County
- Escambia County · 301,722 people
- Metro
- Pensacola-Ferry Pass-Brent, FL
- Population (ZIP)
- 27,877
- Household income
- $44,783
- Rent vs Own
- Severe rent burden
- 1458.0
Population outlook (Escambia County) Hauer SSP2
- Today (2025)
- 334,637 people
- By 2030
- 345,779 · +3.3%
- By 2040
- 364,828 · +9.0%
- By 2050
- 378,514 · +13.1%
- By 2075
- 403,220 · +20.5%
- By 2100
- 386,125 · +15.4%
Race, ethnicity, and origin ACS 2023
- Neighborhood character
- Diverse neighborhood (Simpson 0.66)
- Race & ethnicity
- Black 48% White 32% Hispanic / Latino 11% Two or more races 9% Asian 2%
- Hispanic origin (detail)
- Mexican 5% Cuban 2%
- Common ancestry
- Slovak 2% Italian 1% Serbian 1%
- Foreign-born
- 9% · Canada, Vietnam
- Languages at home
- 87% English-only · Spanish 9% Other Indo-European 1% Vietnamese 1%
Political lean MEDSL · Escambia
- 2024 margin
- R (+19.5) · D 39.7% · R 59.2% · Other 1.1%
- 2008→2024 swing
- -0.2pp no change · 2008: -19.3pp · 2024: -19.5pp
- All cycles
- 2024: R+19.5 2020: R+15.1 2016: R+20.6 2012: R+20.6 2008: R+19.3
Not yet ingested
- Civics
- —
Market trends
- HPI YoY
- ▼ -74.10%
- Current HPI
- 205.45
- Rent YoY
- ▲ 4.92%
- Metro
- Pensacola-Ferry Pass-Brent, FL
- State GDP YoY
- ▲ 3.28%
- F500 in state
- 36
Industry mix (Fortune 500 HQ in FL)
| Industry | F500 HQs | Revenue |
|---|---|---|
| Industrial Technology | 2 | $29B |
|
||
| Insurance | 2 | $17B |
|
||
| Retail | 1 | $60B |
|
||
| Technology Distribution | 1 | $58B |
|
||
| Homebuilding | 1 | $35B |
|
||
| Technology Manufacturing | 1 | $35B |
|
||
Price history
+76.1% since first listed7 events — show timeline
- 2026-05-14 Price Changed $125,000 PARMLS
- 2026-04-21 Listed $135,000 PARMLS
- 2005-05-05 Sold (MLS) $67,900 PARMLS
- 2005-03-24 Listed $69,900 PARMLS
- 2002-04-23 Sold (Public Records) $71,000 Public Records
- 2002-04-19 Sold (MLS) $71,000 PARMLS
- 2002-02-11 Listed $71,000 PARMLS
Property tax history
+7.1%/yrLatest (2025): $1,673 · +18.7% YoY. Source: county tax records.
Cash-flow waterfall
monthlySold comps — $/sqft
last 12 mo · ≤1 miLoading sold comps…