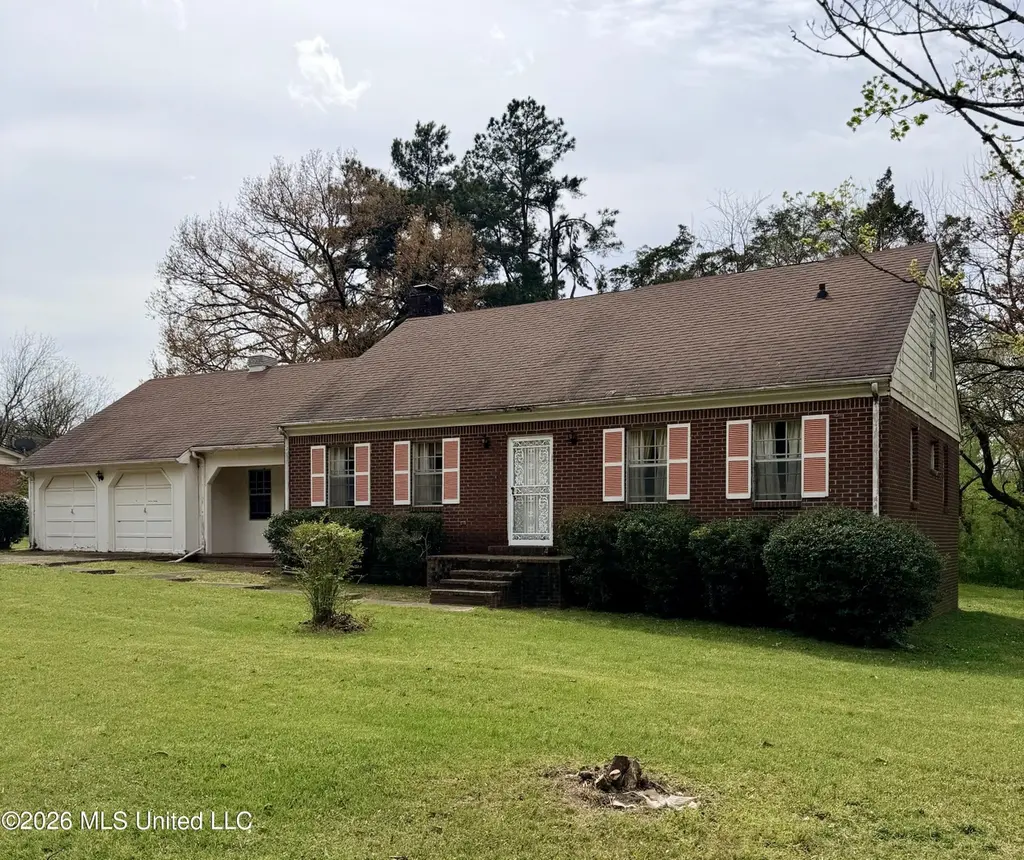
136 Weaver Dr · Holly Springs, MS
Flood risk 1/10 · Minimal
- FEMA flood zone
- X (unshaded)
- Chance of flooding over 30 yrs
- 0.0%
- Est. flood insurance / yr
- $507 – $1,088
Fire risk 3/10 · Minor
- Est. fire insurance / yr
- $1,241 – $2,305
Heat risk 6/10 · Moderate
- Hot days now (above 108°F)
- 7 days/yr
- Hot days in 30 yrs
- 21 days/yr
Wind risk 4/10 · Minor
- Chance of severe wind over 30 yrs
- 23.0%
Air-quality risk 2/10 · Minimal
- Unhealthy air days now
- 1 days/yr
- Unhealthy air days in 30 yrs
- 1 days/yr
Risk factors via First Street. Map © Google.
Why this score? — see what drove the D grade
The composite is a weighted blend of 9 inputs, each scored 0–100. Each bar is that input's sub-score; the figure is the points it added to the 100-point composite (weight × sub-score).
- ARV discount +14.3/15.0
- Cash flow +8.7/30.0
- Appreciation +5.0/10.0
- 1% rule +3.4/10.0
- Livability +3.1/5.0
- Rent growth +2.5/5.0
- Condition / age +2.5/5.0
- DSCR +2.4/10.0
- Schools +1.1/10.0
$190,000
🖨 Deal sheet 📄 Offer letter ✓ Due diligence
Listing remarks
4BR/3BA HOUSE -- 3 PARCELS OF LAND--4.3 ACRES TOTAL FOR UNDER $200,000! Positioned in an established pocket of Holly Springs experiencing continued residential interest just 5 minutes from Town Square and a short drive to Olive Branch or Memphis, this 4-bedroom, 3-bath home offers 2,600 square feet and a thoughtfully designed layout with hardwood flooring throughout. Also featuring three separate living areas plus a formal dining room and 4 generously sized bedrooms, the possibilities for value enhancement are abundant. There is also a handicap accessible bathroom on the main floor. The home is situated on two land parcels totaling 0.66-acre PLUS includes an additional 3.93 acre wooded lot
Key facts
- Wooded lot
- Two land parcels
- 4.3 acre lot
Tags
Property features AI
Finance
- Other: Lot size approximately 4.3 acres
Exterior
- Parking: Attached garage with 2 spaces; Concrete driveway; Garage faces front; Interior garage storage
- Security: Smoke detectors
- Utilities: Public water; Public sewer; Electricity available; Cable available; Phone service available; Sewer connected
- Home design: Single-family house; Two levels; Residence constructed with brick; Conventional foundation; Architectural shingle roof; Accessibility features present
- Construction: Brick construction; Conventional foundation; Architectural shingle roof
- Exterior features: Patio with awning(s); Rain gutters; Additional storage structures and garage(s); Level, wooded lot
Interior
- Kitchen: Built-in electric range; Built-in range; Convection oven; Cooktop; Oven; Dishwasher
- Bedrooms: Primary bedroom located on the main level; Additional bedrooms on the upper level
- Flooring: Hardwood floors
- Bathrooms: Three full bathrooms (main and upper levels)
- Heating & cooling: Central heating (natural gas); Central air conditioning
- Interior features: Ceiling fans; Eat-in kitchen; High ceilings; Storage; Walk-in closets; Window treatments including blinds and drapes; Security door features; Masonry fireplace in the great room
- Laundry & utility: Laundry on the main level; Electric and gas water heaters
Neighborhood map
What this means for you Summary
Snapshot
- This is a 4-bed/1.0-bath single-family listed at $190k.
Deal economics
- At list price, monthly cash flow is $-161 ($-2k/yr) — negative.
- To cash-flow at today's rent, offer at most $162k (14.9% below list).
- To meet the 1% rule (rent ≥ 1% of price), the offer needs to be $160k (15.8% below list).
- Recommended offer: $160k (15.8% below list) — sets the bar for 1% rule.
Location & tenants
- Location reads 62/100 on livability (#178 in MS) — a middle-class / working-renter tenant base. Strengths: cost of living A+, housing A+, crime B; Watch: schools F, amenities F, commute F.
- Holly Springs School District (town): math 12% / reading 15% proficiency, ranked #111 of 130 in MS (top 85%) — low school quality limits family demand, transient renter base, plan for 1-2y turnover; 92% free/reduced lunch — lower-income household profile, screen leases tightly.
- Market conditions: 146 active listings in the ZIP; 1 comparable units currently listed for rent nearby; 310 units permitted in Marshall County in 2024 (0 in 5+ unit buildings).
Forward outlook
- In year one you build about $1k of equity ($1k loan paydown + $-19 appreciation (-0.0% local appreciation)).
- Marshall County population projected at -24% by 2050 — secular population decline; favor cash flow + early exit over multi-decade hold.
Negotiation context
- It's been on market 54 days — a 3% lower offer ($184k) is reasonable based on typical stale-listing flexibility.
- 3 sale attempts since 15y ago with the ask held roughly flat each time — persistent listings suggest the price (not the market) is what's stuck; bring a comps-based counter.
Risks & watch-outs
- Climate carrying-cost: extreme-heat days projected 7→21/yr by 2055 (HVAC capex compounding) — expect insurance premiums to compound above CPI over the hold.
Questions for the listing agent
- What do current leases actually rent for vs. the listed asking? Can we see a recent rent roll and the last 12 months of T-12 income?
- It's been on market 54 days. Have you received any prior offers? Is the seller open to a 16% concession, seller financing, or rate buy-down credit?
- Built in 1970 — when were the roof, HVAC, electrical panel, plumbing, and water heater last replaced?
- Is there a deadline driving the sale (1031 exchange, divorce, estate, relocation)? That informs how much negotiation room exists.
- Schools are F-rated, which usually means shorter tenancies and higher turnover. Who's the typical renter profile here, and what's been the actual vacancy rate?
- The area grade is low — what's the realistic commute time and amenity access for the typical tenant pool here? Any planned neighborhood developments (good or bad) we should know about?
- What's the average days-on-market for RENTAL listings here right now (not sales)? A rising rental-DOM trend means longer vacancies and softer asking-rent achievability than the comps imply.
- What's the recent tenant-quality profile in this submarket — average credit score on applications, eviction rate, late-payment / NSF rate, and stable-employment percentage? A property-management company in the area should have these aggregated.
- How much new for-sale + rental construction is in the pipeline within 1–3 miles? Heavy new supply typically softens prices + rents 12–24 months out; constrained supply supports both.
Investment metrics
- 1% rule
- 0.84% ✗
- Cap rate
- 5.28%
- Cash-on-cash
- -3.62%
- DSCR
- 0.84
- GRM
- 9.9
CMA / ARV
- ARV (median comp)
- $224,035
- List price
- $190,000
- Delta
- -15.19%
- Verdict
- UNDERPRICED
- Comps
- 14 within 1.0 mi
Show comp detail 3 sales within ~0.75 mi
| Address | Dist | Beds/Ba | Sqft | Sold | Price | $/sf | Match |
|---|---|---|---|---|---|---|---|
| 250 NW Boundary St | 0.24mi | 4/2.0 | 1,916 (-3%) | 20mo | $90,000 | $47 | 62 |
| 296 Johnson Park | 0.43mi | 3/2.0 (-1) | 1,886 (-5%) | 5mo | $199,000 | $106 | 59 |
| 504 Gordon Dr | 0.69mi | 3/2.0 (-1) | 1,865 (-6%) | 20mo | $219,900 | $118 | 33 |
Match score weights: distance 35% · size 25% · config 20% · recency 20%. Top-matched comps best support the ARV.
Projected returns pro-forma
-0.01% appreciation · 3.0% rent growth · sell at horizon
- IRR
- -6.3%
- Equity multiple
- 0.70×
- Total profit
- $-15,780
- Equity at exit
- $55,075
- IRR
- -0.3%
- Equity multiple
- 0.97×
- Total profit
- $-1,705
- Equity at exit
- $66,127
Cash invested: $53,200 (down + closing). Projections, not guarantees.
Landlord ↔ Tenant lean methodology
- Overall (STATE)
- 90 Strongly Landlord-Friendly
- State Mississippi
- 90 Strongly Landlord-Friendly · R+11
- County
- — inherits STATE
- City
- — inherits STATE
ZIP-level market 38635
- Home prices YoY
- -0.0%
- Active inventory
- 146
- Price-to-rent
- 9.9×
Monthly cashflow live
- Estimated rent
- $1,600 medium interval (Pro) →
- Mortgage (P&I)
- −$996
- Tax from tax record
- −$349 /mo · $4,188/yr
- Insurance
- −$79
- HOA
- −$0
- Vacancy / Maint / Mgmt
- −$336
- Net cashflow
- $-161
Break-even live
UW: 25.0% down · 7.5% · 30yr · 1.5% tax · 5.0% vac · 8.0% maint · 8.0% mgmt
Financing live
Cash to close
- Down payment
- $47,500
- Closing costs
- $5,700
- Reserves months
- —
- Total cash needed
- —
Loan-product check · same deal, 3 products live
Conventional
25% down · 7.5% · 30yr
- Down + closing
- —
- Monthly P&I
- —
- Monthly cashflow
- —
- DSCR
- —
- Eligible?
- —
Personal DTI + credit; lowest rate.
DSCR
20% down · 8.5% · 30yr
- Down + closing
- —
- Monthly P&I
- —
- Monthly cashflow
- —
- DSCR
- —
- Eligible?
- —
No personal income docs; deal must DSCR.
Hard money
10% down · 12.0% · 12mo
- Down + closing
- —
- Monthly P&I
- —
- Monthly cashflow
- —
- DSCR
- —
- Eligible?
- —
Short-term bridge; refi at stabilization.
Rent comps 1 comps
| Address | Beds | Baths | Sqft | Rent | $/sqft | DOM | Units | Dist |
|---|---|---|---|---|---|---|---|---|
| 275 W Chulahoma Ave Holly Springs, MS | 3.0 | 3.0 | 2243 | $1,600 | $0.71 | 21d | 1 | 0.51mi |
Listing history 19 events
-
2026-06-18days on market $190,000 Active 54 DOM
-
2026-06-17days on market $190,000 Active 53 DOM
-
2026-06-16days on market $190,000 Active 52 DOM
-
2026-06-15days on market $190,000 Active 51 DOM
-
2026-06-13days on market $190,000 Active 49 DOM
-
2026-06-12days on market $190,000 Active 48 DOM
-
2026-06-09days on market $190,000 Active 45 DOM
-
2026-06-08days on market $190,000 Active 44 DOM
-
2026-06-07days on market $190,000 Active 43 DOM
-
2026-06-07days on market $190,000 Active 42 DOM
-
2026-06-04days on market $190,000 Active 39 DOM
-
2026-06-02days on market $190,000 Active 38 DOM
-
2026-06-01days on market $190,000 Active 37 DOM
-
2026-05-31days on market $190,000 Active 36 DOM
-
2026-04-25$190,000 Active 959-char remark
-
2021-10-11historical
-
2021-03-19historical
-
2013-05-20$130,000
-
2011-12-12$165,000
ⓘ Source: listings_history table (triggers on properties + properties_extension) + one-shot
backfill from property_details.listing_events for pre-trigger history.
Tax reassessment forecast MS · Resets to sale price
- Current annual tax
- $4,188 · $349/mo
- Projected year-2 tax
- $4,188 · $349/mo
- Expected delta
- $0/yr ($0/mo · 0.0%)
ⓘ Screening estimate from a state-policy table — verify with the county assessor before closing.
Climate risk First Street
- Flood 1/10 Low FEMA zone X (unshaded) · 0% chance over 30 yrs
- Wildfire 3/10 Moderate
- Heat 6/10 Major 7 d/yr ≥108°F today · 21 d/yr by 30 yrs out
- Wind 4/10 Moderate 23% chance of damaging wind over 30 yrs
- Air quality 2/10 Low 1 unhealthy d/yr today · 1 by 30 yrs out
Nearby sold comps map
Loading sold comps map…
Walkable amenities ~0.75 mi
Loading nearby amenities…
Taxation est. · year 1
- Rental income
- $19,200
- − Mortgage interest
- −$10,643
- − Property taxes
- −$4,188
- − Insurance
- −$950
- − Repairs & maintenance
- −$1,536
- − Management
- −$1,536
- − Depreciation
- −$5,527
- Taxable loss
- −$5,180
- Est. tax savings @ 24.0%
- +$1,243
- After-tax cash flow
- $-683/yr
For passive investors: Depreciation is non-cash, so a rental often shows a tax loss while cash-flowing — sheltering income. Rental losses are passive: they offset passive income freely, and up to $25,000/yr can offset ordinary (W-2) income if you actively participate and your MAGI is under $100k (phasing out to $0 by $150k); unused losses carry forward. On sale, claimed depreciation is recaptured at up to 25%, and gains may owe capital-gains tax (a 1031 exchange can defer both). Figures are a year-1 estimate at your 24.0% rate — not tax advice; consult a CPA.
Schools (NCES district)
- District
- Holly Springs School District
- NCES district ID
- 2801950
- Math proficiency
- 12% ▼ -12.00%
- Reading proficiency
- 15% ▼ -7.00%
- Median HH income
- $33,106
- Composite
- 10.9/100
- National rank
- #9752
- State rank
- #111 of 130 in MS
Livability — Holly Springs
- Score
- 62/100
- State rank
- #178
- US rank
- #16836
Category grades
Schools grade is shown separately in the Schools card above.
Census & demographics
- Census place
- Holly Springs, MS
- Population (ZIP)
- 15,312
Population outlook (Marshall County) Hauer SSP2
- Today (2025)
- 33,542 people
- By 2030
- 31,983 · -4.6%
- By 2040
- 28,556 · -14.9%
- By 2050
- 25,352 · -24.4%
- By 2075
- 20,032 · -40.3%
- By 2100
- 16,738 · -50.1%
Race, ethnicity, and origin ACS 2023
- Neighborhood character
- Majority Black (64%)
- Race & ethnicity
- Black 64% White 29% Two or more races 5%
- Common ancestry
- Serbian 1% English 1%
- Foreign-born
- 3%
- Languages at home
- 97% English-only · Spanish 1%
Political lean MEDSL · Marshall
- 2024 margin
- Lean R (+7.3) · D 46.0% · R 53.2%
- 2008→2024 swing
- -25.5pp toward R · 2008: 18.2pp · 2024: -7.3pp
- All cycles
- 2024: R+7.3 2020: D+3.1 2016: D+9.7 2012: D+19.4 2008: D+18.2
Not yet ingested
- Civics
- —
Market trends
- HPI YoY
- ▬ -0.01%
- Current HPI
- 245.68
- Rent YoY
- —
- Metro
- —
- State GDP YoY
- —
- F500 in state
- 0
Price history
+15.2% since first listed5 events — show timeline
- 2026-04-25 Listed $190,000 MLSU
- 2021-10-11 Listing Removed — MLSU
- 2021-03-19 Listing Removed — MLSU
- 2013-05-20 Listed $130,000 MLSU
- 2011-12-12 Listed $165,000 MLSU
Property tax history
+3.0%/yrLatest (2025): $4,188 · +20.1% YoY. Source: county tax records.
Cash-flow waterfall
monthlySold comps — $/sqft
last 12 mo · ≤1 miLoading sold comps…