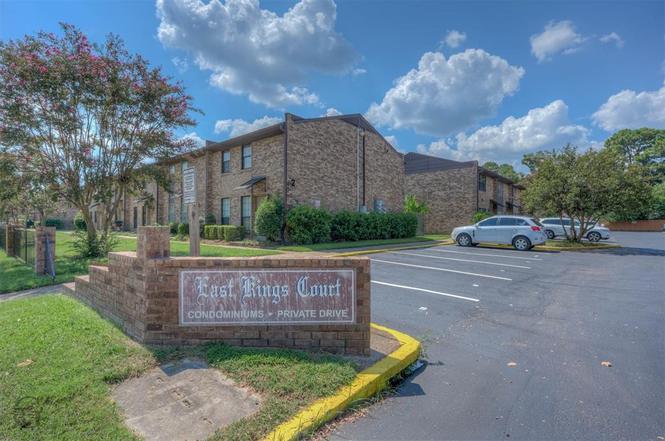
1820 E Kings Hwy #262 · Shreveport, LA
Flood risk 1/10 · Minimal
- FEMA flood zone
- X (unshaded)
- Chance of flooding over 30 yrs
- 0.0%
- Est. flood insurance / yr
- $507 – $1,088
Fire risk 1/10 · Minimal
- Est. fire insurance / yr
- $1,269 – $2,357
Heat risk 7/10 · Major
- Hot days now (above 110°F)
- 7 days/yr
- Hot days in 30 yrs
- 22 days/yr
Wind risk 6/10 · Moderate
- Chance of severe wind over 30 yrs
- 68.0%
Air-quality risk 2/10 · Minimal
- Unhealthy air days now
- 1 days/yr
- Unhealthy air days in 30 yrs
- 2 days/yr
Risk factors via First Street. Map © Google.
Why this score? — see what drove the C grade
The composite is a weighted blend of 9 inputs, each scored 0–100. Each bar is that input's sub-score; the figure is the points it added to the 100-point composite (weight × sub-score).
- Cash flow +22.1/30.0
- 1% rule +8.3/10.0
- ARV discount +7.5/15.0
- DSCR +7.1/10.0
- Condition / age +3.8/5.0
- Rent growth +3.5/5.0
- Livability +3.0/5.0
- Schools +2.2/10.0
- Appreciation +0.0/10.0
$99,600
🖨 Deal sheet (PDF) 📄 Offer letter ✓ Due diligence
Listing remarks
If you are looking for a great, low maintenance condo to own in a location of Shreveport that is convenient to many amenities such as shopping, dining and entertainment, look here! Schedule your showing today and you'll see why this condo is an amazing offer for the price!
Key facts
- $199 HOA
- 2 parking spots
- Built 1970
Property features AI
Finance
- Other: Unit 262, Building 12 in East Kings Court subdivision; Possession negotiable
- Financial info: Treat As Clear loan type; No second mortgage indicated
- HOA & community: Mandatory association (East Kings Court HOA); Association fee $199 monthly; Association covers grounds and structure maintenance, water and sewer
Exterior
- Parking: 2-space carport; Off-street parking
- Utilities: City water; City sewer; Not in a municipal utility district
- Home design: Condominium (attached); One level
- Construction: Built in 1970
- Exterior features: Condominium lot (subdivided)
Interior
- Kitchen: Dishwasher; Electric range
- Bedrooms: 2 bedrooms total; Primary bedroom (12 x 12)
- Bathrooms: 2 full bathrooms
- Interior features: One living area; One dining area; 2 total rooms; Other interior features
Neighborhood map
What this means for you Summary
Snapshot
- This is a 2-bed/2.0-bath condo listed at $100k. Condition is rated good.
Deal economics
- At list price, monthly cash flow is $161 ($2k/yr) — positive.
- The deal already cash-flows at list — no discount required.
- Meets the 1% rule at list price ($1k rent vs $100k).
- Recommended offer: $88k (12.0% below list) — sets the bar for market timing.
- Cap rate 8.2% vs local median 5.7% in Shreveport — top-decile yield for the area; either an underpriced asset or a hidden risk that comps aren't pricing in. Stress-test before assuming the spread holds.
Location & tenants
- Location reads 59/100 on livability (#270 in LA) — a working-class tenant base; expect higher turnover. Strengths: cost of living A+, housing A; Watch: schools D+, crime F, amenities F.
- Caddo Parish (urban): math 21% / reading 32% proficiency, ranked #53 of 98 in LA (top 54%) — low school quality limits family demand, transient renter base, plan for 1-2y turnover; 64% free/reduced lunch — lower-income household profile, screen leases tightly.
- Market conditions: Rents rising (+3.9%/yr); 149 active listings in the ZIP; 14 comparable units currently listed for rent nearby; rentals at typical pace (median 22d on market — plan ~3-4 weeks tenant-placement turnaround); 221 units permitted in Caddo Parish in 2024 (0 in 5+ unit buildings).
Forward outlook
- Local home prices are declining (-3.0%/yr); year-one equity from $689 of loan paydown is wiped out by about $3k of value loss. Plan a longer hold.
- Caddo County population projected at -15% by 2050 — secular population decline; favor cash flow + early exit over multi-decade hold.
Negotiation context
- It's been on market 279 days — a 12% lower offer ($88k) is reasonable based on typical stale-listing flexibility.
- 2 sale attempts with the ask held roughly flat each time — persistent listings suggest the price (not the market) is what's stuck; bring a comps-based counter.
Risks & watch-outs
- Climate carrying-cost: major wind risk, 68% chance of damaging wind over 30y; extreme-heat days projected 7→22/yr by 2055 (HVAC capex compounding) — expect insurance premiums to compound above CPI over the hold.
Questions for the listing agent
- It's been on market 279 days. Have you received any prior offers? Is the seller open to a 12% concession, seller financing, or rate buy-down credit?
- Built in 1970 — when were the roof, HVAC, electrical panel, plumbing, and water heater last replaced?
- What does the HOA fee cover, when was the last increase, and are there any pending special assessments or reserve-fund shortfalls?
- Any open or pending special assessments — roof, HVAC, plumbing, elevator, façade? What's the per-unit balance and payoff schedule, and is the seller paying it off at close or rolling it to the buyer?
- Why hasn't it sold? Are there any deal-killer items the seller is aware of (foundation, flood, title, zoning, code violations)?
- Is there a deadline driving the sale (1031 exchange, divorce, estate, relocation)? That informs how much negotiation room exists.
- Schools are D-rated, which usually means shorter tenancies and higher turnover. Who's the typical renter profile here, and what's been the actual vacancy rate?
- Crime grade is F in this area — have there been break-ins, vandalism, or insurance claims at this property in the last 3 years? What carrier currently insures it and at what premium?
- What's the average days-on-market for RENTAL listings here right now (not sales)? A rising rental-DOM trend means longer vacancies and softer asking-rent achievability than the comps imply.
- What's the recent tenant-quality profile in this submarket — average credit score on applications, eviction rate, late-payment / NSF rate, and stable-employment percentage? A property-management company in the area should have these aggregated.
- How much new apartment / multifamily construction is in the pipeline within 1–3 miles? Heavy new supply (>2% of stock underway) typically softens rents 12–24 months out; light construction supports rent growth.
Investment metrics
- 1% rule
- 1.33% ✓
- Cap rate
- 8.23%
- Cash-on-cash
- 6.91%
- DSCR
- 1.31
- GRM
- 6.3
CMA / ARV
No comps found within radius.
Projected returns pro-forma
-3.0% appreciation · 3.93% rent growth · sell at horizon
- IRR
- -4.3%
- Equity multiple
- 0.84×
- Total profit
- $-4,516
- Equity at exit
- $14,851
- IRR
- 6.8%
- Equity multiple
- 1.54×
- Total profit
- $15,055
- Equity at exit
- $8,612
Cash invested: $27,888 (down + closing). Projections, not guarantees.
Landlord ↔ Tenant lean methodology
- Overall (STATE)
- 90 Strongly Landlord-Friendly
- State Louisiana
- 90 Strongly Landlord-Friendly · R+12
- County
- — inherits STATE
- City
- — inherits STATE
ZIP-level market 71105
- Rents YoY
- 3.9%
- Active inventory
- 149
- Price-to-rent
- 6.3×
Monthly cashflow live
- Estimated rent
- $1,326 high interval (Pro) →
- Mortgage (P&I)
- −$522
- Tax est. 1.5%
- −$124 /mo · $1,494/yr
- Insurance
- −$42
- HOA
- −$199
- Vacancy / Maint / Mgmt
- −$279
- Net cashflow
- $161
Break-even live
Sensitivity live
| Price | -10% $229 | -5% $195 | +0% $161 | +5% $126 | +10% $92 |
|---|---|---|---|---|---|
| Rent | -10% $56 | -5% $108 | +0% $161 | +5% $213 | +10% $265 |
| Rate | -1.0pp $211 | -0.5pp $186 | base $161 | +0.5pp $135 | +1.0pp $109 |
UW: 25.0% down · 7.5% · 30yr · 1.5% tax · 5.0% vac · 8.0% maint · 8.0% mgmt
Financing live
Cash to close
- Down payment
- $24,900
- Closing costs
- $2,988
- Reserves months
- —
- Total cash needed
- —
Loan-product check · same deal, 3 products live
Conventional
25% down · 7.5% · 30yr
- Down + closing
- —
- Monthly P&I
- —
- Monthly cashflow
- —
- DSCR
- —
- Eligible?
- —
Personal DTI + credit; lowest rate.
DSCR
20% down · 8.5% · 30yr
- Down + closing
- —
- Monthly P&I
- —
- Monthly cashflow
- —
- DSCR
- —
- Eligible?
- —
No personal income docs; deal must DSCR.
Hard money
10% down · 12.0% · 12mo
- Down + closing
- —
- Monthly P&I
- —
- Monthly cashflow
- —
- DSCR
- —
- Eligible?
- —
Short-term bridge; refi at stabilization.
Rent comps 14 comps
| Address | Beds | Baths | Sqft | Rent | $/sqft | DOM | Units | Dist |
|---|---|---|---|---|---|---|---|---|
| 216 Pennsylvania Ave Shreveport, LA | 3.0 | 1.0 | 1199 | $1,250 | $1.04 | 21d | 1 | 0.36mi |
| 243 Justin Ave Shreveport, LA | 3.0 | 1.0 | 1236 | $1,400 | $1.13 | 44d | 1 | 0.49mi |
| 186 Charles Ave Shreveport, LA | 3.0 | 1.0 | 1320 | $1,675 | $1.27 | 21d | 1 | 0.56mi |
| 154 Southfield Rd Shreveport, LA | 3.0 | 1.0 | 1258 | $1,395 | $1.11 | 44d | 1 | 0.58mi |
| 4024 Reily Ln Shreveport, LA | 3.0 | 1.0 | 1220 | $1,275 | $1.05 | 21d | 1 | 0.68mi |
| 1105 Island Park Blvd Shreveport, LA | 2.0–3.0 | 2.0 | 1280 | $1,449 | $1.13 | 14d | 9 | 1.15mi |
| 3501 Champion Lake Blvd Shreveport, LA | 1.0–2.0 | 1.0–2.0 | 845 | $1,415 | $1.67 | 14d | 20 | 1.16mi |
| 3201 Knight St Shreveport, LA | 1.0–2.0 | 1.0 | 781 | $900 | $1.15 | 14d | 3 | 1.18mi |
| 215 Sand Beach Blvd Shreveport, LA | 1.0–2.0 | 1.0–2.0 | 814 | $1,640 | $2.01 | 14d | 6 | 1.19mi |
| 1000 Riverwalk Blvd Shreveport, LA | 1.0–3.0 | 1.0–2.0 | 928 | $1,630 | $1.76 | 14d | 11 | 1.20mi |
| 3215 Knight St Shreveport, LA | 1.0–2.0 | 1.0–2.0 | 862 | $1,065 | $1.24 | 14d | 7 | 1.23mi |
| 3131 Knight St Shreveport, LA | 1.0–2.0 | 1.0–2.0 | 866 | $985 | $1.14 | 14d | 11 | 1.33mi |
| 219 E Slattery Blvd Shreveport, LA | 2.0 | 1.0 | 1047 | $1,000 | $0.96 | 44d | 1 | 1.41mi |
| 818 E Washington St Shreveport, LA | 3.0 | 1.0 | 1100 | $1,300 | $1.18 | 21d | 1 | 1.48mi |
HOA detail condo
- Monthly dues
- $199 · $2,388/yr
- Assessments
- None detected in remarks — confirm with the listing agent.
Listing history 9 events
-
2026-06-18days on market $99,600 Active 279 DOM
-
2026-06-17days on market $99,600 Active 278 DOM
-
2026-06-16days on market $99,600 Active 277 DOM
-
2026-06-15days on market $99,600 Active 276 DOM
-
2026-06-14days on market $99,600 Active 274 DOM
-
2026-06-13days on market $99,600 Active 273 DOM
-
2026-06-10days on market $99,600 Active 271 DOM
-
2026-06-09remarks 273-char remark
-
2026-06-09$99,600 Active 270 DOM
ⓘ Source: listings_history table (triggers on properties + properties_extension) + one-shot
backfill from property_details.listing_events for pre-trigger history.
Climate risk First Street
- Flood 1/10 Low FEMA zone X (unshaded) · 0% chance over 30 yrs
- Wildfire 1/10 Low
- Heat 7/10 Severe 7 d/yr ≥110°F today · 22 d/yr by 30 yrs out
- Wind 6/10 Major 68% chance of damaging wind over 30 yrs
- Air quality 2/10 Low 1 unhealthy d/yr today · 2 by 30 yrs out
Nearby sold comps map
Loading sold comps map…
Walkable amenities ~0.75 mi
Loading nearby amenities…
Taxation est. · year 1
- Rental income
- $15,918
- − Mortgage interest
- −$5,579
- − Property taxes
- −$1,494
- − Insurance
- −$498
- − Repairs & maintenance
- −$1,273
- − Management
- −$1,273
- − HOA
- −$2,388
- − Depreciation
- −$2,897
- Taxable income
- $514
- Est. tax owed @ 24.0%
- −$123
- After-tax cash flow
- $1,804/yr
For passive investors: Depreciation is non-cash, so a rental often shows a tax loss while cash-flowing — sheltering income. Rental losses are passive: they offset passive income freely, and up to $25,000/yr can offset ordinary (W-2) income if you actively participate and your MAGI is under $100k (phasing out to $0 by $150k); unused losses carry forward. On sale, claimed depreciation is recaptured at up to 25%, and gains may owe capital-gains tax (a 1031 exchange can defer both). Figures are a year-1 estimate at your 24.0% rate — not tax advice; consult a CPA.
Condition & rehab AI · 13 photos
This well-maintained, low-maintenance condo is ready for a fresh coat of paint and new countertops to enhance its curb appeal and interior aesthetics.
Repairs flagged
- Minor Kitchen countertops — Worn appearance
- Minor Carpeted floors — Signs of wear
Value-add opportunities
- Both Paint interior walls — Fresh paint enhances curb appeal and interior aesthetics.
- Both Replace worn kitchen countertops — New countertops improve functionality and appearance.
- Both Deep clean and reorganize bathrooms — Clean bathrooms are essential for both resale and rental value.
- Both Replace worn carpeted floors — Fresh carpeting improves comfort and aesthetics, attracting more buyers/renters.
Renovation cost estimate screening
| Repair item | Severity | Est. cost |
|---|---|---|
| Kitchen countertops · Worn appearance | Minor | $500–3,000 |
| Carpeted floors · Signs of wear | Minor | $500–3,000 |
| Total estimated repair cost · 2 items | $1,000–6,000 |
Value-add ROI direction
- Both Paint interior walls — Fresh paint enhances curb appeal and interior aesthetics. ↑
- Both Replace worn kitchen countertops — New countertops improve functionality and appearance. ↑
- Both Deep clean and reorganize bathrooms — Clean bathrooms are essential for both resale and rental value. ↑
- Both Replace worn carpeted floors — Fresh carpeting improves comfort and aesthetics, attracting more buyers/renters. ↑
ⓘ Cost ranges are severity-bucket heuristics (US national rule-of-thumb). Get contractor quotes + a written scope before underwriting a rehab budget.
Schools (NCES district)
- District
- Caddo Parish
- NCES district ID
- 2200300
- Math proficiency
- 21% ▼ -33.00%
- Reading proficiency
- 32% ▼ -30.00%
- Median HH income
- $39,227
- Composite
- 22.23/100
- National rank
- #8148
- State rank
- #53 of 98 in LA
Livability — Shreveport
- Score
- 59/100
- State rank
- #270
- US rank
- #19730
Category grades
Schools grade is shown separately in the Schools card above.
Census & demographics
- Census place
- Shreveport, LA
- County
- Caddo Parish · 178,536 people
- City population
- 164,123
- Metro
- Shreveport-Bossier City, LA
- Population (ZIP)
- 20,179
- Household income
- $67,968
- Rent vs Own
- Severe rent burden
- 1007.0
Population outlook (Caddo County) Hauer SSP2
- Today (2025)
- 243,190 people
- By 2030
- 237,231 · -2.5%
- By 2040
- 222,502 · -8.5%
- By 2050
- 206,516 · -15.1%
- By 2075
- 165,706 · -31.9%
- By 2100
- 122,262 · -49.7%
Race, ethnicity, and origin ACS 2023
- Neighborhood character
- Predominantly White (68%)
- Race & ethnicity
- White 68% Black 20% Two or more races 7% Hispanic / Latino 5% Asian 4%
- Hispanic origin (detail)
- Mexican 2%
- Common ancestry
- Lithuanian 3% Serbian 3% Slovak 2%
- Foreign-born
- 5% · Canada, China
- Languages at home
- 93% English-only · Spanish 2% Other Indo-European 1% Russian/Polish/Slavic 1%
Political lean MEDSL · Caddo
- 2024 margin
- Toss-up / Even · D 51.6% · R 47.0% · Other 1.4%
- 2008→2024 swing
- +1.6pp toward D · 2008: 3.0pp · 2024: 4.6pp
- All cycles
- 2024: D+4.6 2020: D+6.8 2016: D+4.2 2012: D+4.9 2008: D+3.0
Not yet ingested
- Civics
- —
Market trends
- HPI YoY
- ▼ -96.75%
- Current HPI
- 129.572
- Rent YoY
- ▲ 3.93%
- Metro
- Shreveport-Bossier City, LA
- State GDP YoY
- ▲ 3.29%
- F500 in state
- 10
Industry mix (Fortune 500 HQ in LA)
| Industry | F500 HQs | Revenue |
|---|---|---|
| Telecommunications | 2 | $23B |
|
||
| Utilities | 1 | $12B |
|
||
| Wholesale / Distribution | 1 | $5B |
|
||
| Advertising | 1 | $2B |
|
||
Price history
-0.3% since first listed6 events — show timeline
- 2026-04-14 Relisted — NTREIS
- 2026-03-03 Contingent — NTREIS
- 2025-10-18 Price Changed $99,600 NTREIS
- 2025-10-11 Price Changed $99,700 NTREIS
- 2025-10-09 Price Changed $99,800 NTREIS
- 2025-09-12 Listed $99,900 NTREIS
Cash-flow waterfall
monthlySold comps — $/sqft
last 12 mo · ≤1 miLoading sold comps…