1581 Crestview Dr · Sedalia, MO
Flood risk 1/10 · Minimal
- FEMA flood zone
- X (unshaded)
- Chance of flooding over 30 yrs
- 0.0%
- Est. flood insurance / yr
- $507 – $1,088
Fire risk 1/10 · Minimal
- Est. fire insurance / yr
- $1,054 – $1,958
Heat risk 4/10 · Minor
- Hot days now (above 106°F)
- 7 days/yr
- Hot days in 30 yrs
- 18 days/yr
Wind risk 2/10 · Minimal
- Chance of severe wind over 30 yrs
- 1.0%
Air-quality risk 2/10 · Minimal
- Unhealthy air days now
- 0 days/yr
- Unhealthy air days in 30 yrs
- 1 days/yr
Risk factors via First Street. Map © Google.
Why this score? — see what drove the B- grade
The composite is a weighted blend of 9 inputs, each scored 0–100. Each bar is that input's sub-score; the figure is the points it added to the 100-point composite (weight × sub-score).
- Cash flow +30.0/30.0
- 1% rule +10.0/10.0
- DSCR +10.0/10.0
- ARV discount +7.5/15.0
- Livability +3.6/5.0
- Schools +3.1/10.0
- Rent growth +2.5/5.0
- Condition / age +2.5/5.0
- Appreciation +0.0/10.0
$42,900
🖨 Deal sheet (PDF) 📄 Offer letter ✓ Due diligence
Listing remarks
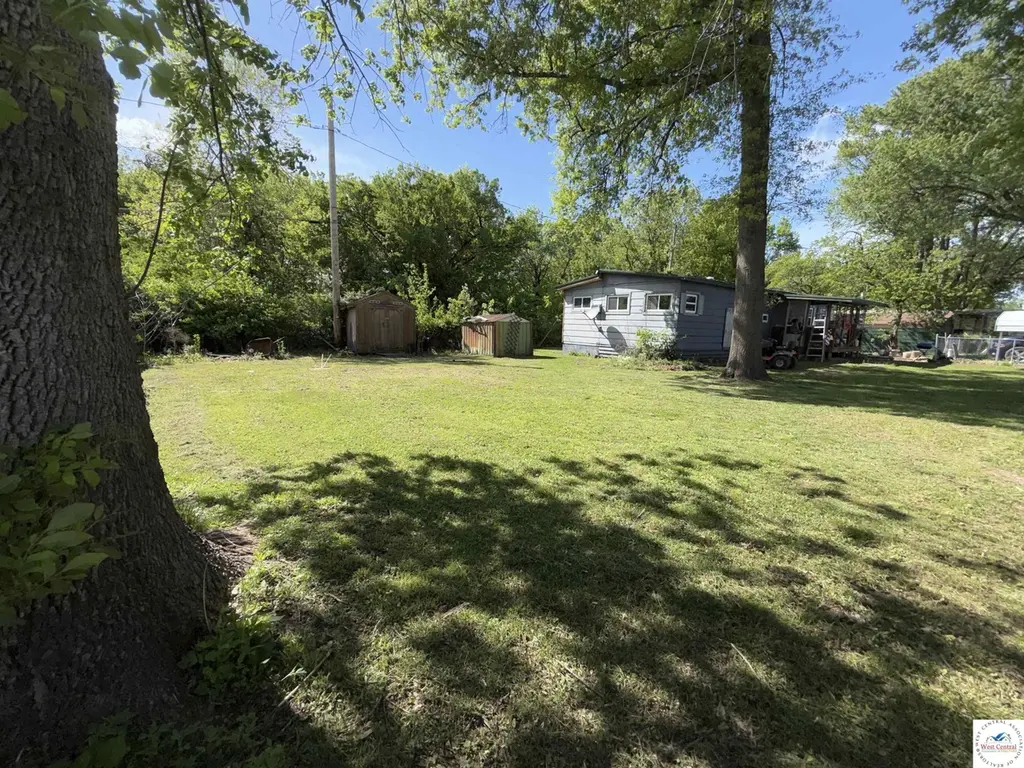
SELLERS MOTIVATED! Affordable country living opportunity just outside the Sedalia city limits! This fixer-upper single wide trailer sits on 4 lots and offers plenty of potential for an investor, handyman, or buyer looking to make it their own. Property is being sold AS IS. Features include 1 remodeled bedroom and an updated kitchen, a large living room and dining area, mud room, and 1 full bathroom. The home sits on a permanent foundation and includes propane heat, 2 window A/C units, vinyl windows, and a 3yr old metal roof. Outside you’ll find a fully fenced yard, 2 carports, and 2 storage sheds offering extra space for tools, equipment, or hobbies. All appliances stay including wash
Key facts
- 2 carports
- 2 storage sheds
- Remodeled bedroom
Tags
Property features AI
Finance
- Other: Lot approximately 0.28 acres
- HOA & community: Homeowners association with a $100 monthly fee
Exterior
- Parking: No garage
- Utilities: Water and sewer information not provided; Power information not provided
- Home design: Manufactured house (single wide); Single-family residence
- Construction: Manufactured construction
- Exterior features: Full chain-link fence; Fenced yard
Interior
- Bathrooms: One full bathroom
- Heating & cooling: Propane heating; Window unit cooling
- Interior features: Window air conditioning units; Propane heating
Neighborhood map
What this means for you Summary
Snapshot
- This is a 1-bed/1.0-bath manufactured listed at $43k.
Deal economics
- At list price, monthly cash flow is $303 ($4k/yr) — positive.
- The deal already cash-flows at list — no discount required.
- Meets the 1% rule at list price ($830 rent vs $43k).
- Recommended offer: $42k (1.5% below list) — sets the bar for market timing.
- Cap rate 14.8% vs local median 4.3% in Sedalia — top-decile yield for the area; either an underpriced asset or a hidden risk that comps aren't pricing in. Stress-test before assuming the spread holds.
Location & tenants
- Location reads 71/100 on livability (#107 in MO) — a middle-class / working-renter tenant base. Strengths: cost of living A+, housing A+, health & safety A+; Watch: amenities D, crime F, commute F.
- Smithton R-VI (rural): math 36% / reading 36% proficiency, ranked #200 of 324 in MO (top 62%) — families likely to look elsewhere, expect single-tenant / working-renter base with shorter leases.
- Market conditions: 213 active listings in the ZIP; 109 units permitted in Pettis County in 2024 (46 in 5+ unit buildings).
- This rent is only 17% of the median local income ($58k/yr) — well below the 30% rent-burden line; pricing power to push rent on renewal without tenant pushback.
Forward outlook
- Local home prices are declining (-3.0%/yr); year-one equity from $297 of loan paydown is wiped out by about $1k of value loss. Plan a longer hold.
- Pettis County population projected to shrink 7% by 2050 — rents likely to lag national; underwrite the cash flow, not the appreciation.
- At projected returns (-3.0% appreciation + 3.0% rent growth), your $12k cash investment doubles in ~4 years — after that, you're playing with house money.
Negotiation context
- It's been on market 27 days — a 2% lower offer ($42k) is reasonable based on typical stale-listing flexibility.
Questions for the listing agent
- Built in 1971 — when were the roof, HVAC, electrical panel, plumbing, and water heater last replaced?
- What does the HOA fee cover, when was the last increase, and are there any pending special assessments or reserve-fund shortfalls?
- Is there a deadline driving the sale (1031 exchange, divorce, estate, relocation)? That informs how much negotiation room exists.
- Crime grade is F in this area — have there been break-ins, vandalism, or insurance claims at this property in the last 3 years? What carrier currently insures it and at what premium?
- What's the average days-on-market for RENTAL listings here right now (not sales)? A rising rental-DOM trend means longer vacancies and softer asking-rent achievability than the comps imply.
- What's the recent tenant-quality profile in this submarket — average credit score on applications, eviction rate, late-payment / NSF rate, and stable-employment percentage? A property-management company in the area should have these aggregated.
- How much new for-sale + rental construction is in the pipeline within 1–3 miles? Heavy new supply typically softens prices + rents 12–24 months out; constrained supply supports both.
Investment metrics
- 1% rule
- 1.94% ✓
- Cap rate
- 14.78%
- Cash-on-cash
- 30.30%
- DSCR
- 2.35
- GRM
- 4.3
CMA / ARV
No comps found within radius.
Projected returns pro-forma
-3.0% appreciation · 3.0% rent growth · sell at horizon
- IRR
- 25.0%
- Equity multiple
- 2.03×
- Total profit
- $12,410
- Equity at exit
- $6,397
- IRR
- 32.8%
- Equity multiple
- 3.99×
- Total profit
- $35,868
- Equity at exit
- $3,709
Cash invested: $12,012 (down + closing). Projections, not guarantees.
Landlord ↔ Tenant lean methodology
- Overall (STATE)
- 81 Strongly Landlord-Friendly
- State Missouri
- 81 Strongly Landlord-Friendly · R+10
- County
- — inherits STATE
- City
- — inherits STATE
ZIP-level market 65301
- Home prices YoY
- -21.8%
- Active inventory
- 213
- Price-to-rent
- 4.3×
Monthly cashflow live
- Estimated rent
- $830 medium interval (Pro) →
- Mortgage (P&I)
- −$225
- Tax from tax record
- −$10 /mo · $116/yr
- Insurance
- −$18
- HOA
- −$100
- Vacancy / Maint / Mgmt
- −$174
- Net cashflow
- $303
Break-even live
Sensitivity live
| Price | -10% $328 | -5% $315 | +0% $303 | +5% $291 | +10% $279 |
|---|---|---|---|---|---|
| Rent | -10% $238 | -5% $270 | +0% $303 | +5% $336 | +10% $369 |
| Rate | -1.0pp $325 | -0.5pp $314 | base $303 | +0.5pp $292 | +1.0pp $281 |
UW: 25.0% down · 7.5% · 30yr · 1.5% tax · 5.0% vac · 8.0% maint · 8.0% mgmt
Financing live
Cash to close
- Down payment
- $10,725
- Closing costs
- $1,287
- Reserves months
- —
- Total cash needed
- —
Loan-product check · same deal, 3 products live
Conventional
25% down · 7.5% · 30yr
- Down + closing
- —
- Monthly P&I
- —
- Monthly cashflow
- —
- DSCR
- —
- Eligible?
- —
Personal DTI + credit; lowest rate.
DSCR
20% down · 8.5% · 30yr
- Down + closing
- —
- Monthly P&I
- —
- Monthly cashflow
- —
- DSCR
- —
- Eligible?
- —
No personal income docs; deal must DSCR.
Hard money
10% down · 12.0% · 12mo
- Down + closing
- —
- Monthly P&I
- —
- Monthly cashflow
- —
- DSCR
- —
- Eligible?
- —
Short-term bridge; refi at stabilization.
HOA detail
- Monthly dues
- $100 · $1,200/yr
Listing history 22 events
-
2026-06-19days on market $42,900 Active 27 DOM
-
2026-06-18days on market $42,900 Active 26 DOM
-
2026-06-17days on market $42,900 Active 25 DOM
-
2026-06-16days on market $42,900 Active 24 DOM
-
2026-06-15days on market $42,900 Active 23 DOM
-
2026-06-14days on market $42,900 Active 21 DOM
-
2026-06-13remarks 693-char remark
-
2026-06-13price $42,900 Active 20 DOM
-
2026-06-12days on market $44,900 Active 20 DOM
-
2026-06-09days on market $44,900 Active 17 DOM
-
2026-06-08days on market $44,900 Active 16 DOM
-
2026-06-07days on market $44,900 Active 15 DOM
-
2026-06-05days on market $44,900 Active 12 DOM
-
2026-06-03days on market $44,900 Active 11 DOM
-
2026-06-02days on market $44,900 Active 10 DOM
-
2026-06-01days on market $44,900 Active 9 DOM
-
2026-05-31days on market $44,900 Active 8 DOM
-
2026-05-30days on market $44,900 Active 7 DOM
-
2026-05-23price $44,900
-
2026-05-23$44,009 Active
-
2008-01-03soldstatus
-
2002-06-10soldstatus
ⓘ Source: listings_history table (triggers on properties + properties_extension) + one-shot
backfill from property_details.listing_events for pre-trigger history.
Tax reassessment forecast MO · Resets to sale price
- Current annual tax
- $116 · $10/mo
- Projected year-2 tax
- $416 · $35/mo
- Expected delta
- +$300/yr (+$25/mo · 257.4%)
ⓘ Screening estimate from a state-policy table — verify with the county assessor before closing.
Climate risk First Street
- Flood 1/10 Low FEMA zone X (unshaded) · 0% chance over 30 yrs
- Wildfire 1/10 Low
- Heat 4/10 Moderate 7 d/yr ≥106°F today · 18 d/yr by 30 yrs out
- Wind 2/10 Low 100% chance of damaging wind over 30 yrs
- Air quality 2/10 Low 0 unhealthy d/yr today · 1 by 30 yrs out
Nearby sold comps map
Loading sold comps map…
Walkable amenities ~0.75 mi
Loading nearby amenities…
Taxation est. · year 1
- Rental income
- $9,962
- − Mortgage interest
- −$2,403
- − Property taxes
- −$116
- − Insurance
- −$214
- − Repairs & maintenance
- −$797
- − Management
- −$797
- − HOA
- −$1,200
- − Depreciation
- −$1,248
- Taxable income
- $3,186
- Est. tax owed @ 24.0%
- −$765
- After-tax cash flow
- $2,875/yr
For passive investors: Depreciation is non-cash, so a rental often shows a tax loss while cash-flowing — sheltering income. Rental losses are passive: they offset passive income freely, and up to $25,000/yr can offset ordinary (W-2) income if you actively participate and your MAGI is under $100k (phasing out to $0 by $150k); unused losses carry forward. On sale, claimed depreciation is recaptured at up to 25%, and gains may owe capital-gains tax (a 1031 exchange can defer both). Figures are a year-1 estimate at your 24.0% rate — not tax advice; consult a CPA.
Schools (NCES district)
- District
- Smithton R-VI
- NCES district ID
- 2928380
- Math proficiency
- 36% ▼ -4.00%
- Reading proficiency
- 36% ▼ -9.00%
- Median HH income
- $45,716
- Composite
- 30.77/100
- National rank
- #6155
- State rank
- #200 of 324 in MO
Livability — Sedalia
- Score
- 71/100
- State rank
- #107
- US rank
- #6990
Category grades
Schools grade is shown separately in the Schools card above.
Census & demographics
- County
- Pettis County · 35,091 people
- City population
- 35,091
- Metro
- Sedalia, MO
- Population (ZIP)
- 35,091
- Household income
- $58,064
- Rent vs Own
- Severe rent burden
- 1021.0
Population outlook (Pettis County) Hauer SSP2
- Today (2025)
- 41,992 people
- By 2030
- 41,584 · -1.0%
- By 2040
- 40,483 · -3.6%
- By 2050
- 39,049 · -7.0%
- By 2075
- 35,413 · -15.7%
- By 2100
- 30,870 · -26.5%
Race, ethnicity, and origin ACS 2023
- Neighborhood character
- Predominantly White (81%)
- Race & ethnicity
- White 81% Hispanic / Latino 10% Two or more races 7% Black 3%
- Hispanic origin (detail)
- Mexican 8%
- Common ancestry
- Subsaharan African 3% Lithuanian 2% Italian 1%
- Foreign-born
- 7% · Canada
- Languages at home
- 87% English-only · Spanish 7% Russian/Polish/Slavic 4% German/W. Germanic 1%
Political lean MEDSL · Pettis
- 2024 margin
- Solid R (+48.8) · D 24.9% · R 73.7% · Other 1.4%
- 2008→2024 swing
- -26.3pp toward R · 2008: -22.4pp · 2024: -48.8pp
- All cycles
- 2024: R+48.8 2020: R+47.5 2016: R+46.9 2012: R+28.8 2008: R+22.4
Not yet ingested
- Civics
- —
Market trends
- HPI YoY
- ▼ -81.80%
- Current HPI
- 292.8224
- Rent YoY
- —
- Metro
- Sedalia, MO
- State GDP YoY
- ▲ 1.84%
- F500 in state
- 20
Industry mix (Fortune 500 HQ in MO)
| Industry | F500 HQs | Revenue |
|---|---|---|
| Healthcare | 1 | $163B |
|
||
| Insurance | 1 | $21B |
|
||
| Industrial Technology | 1 | $17B |
|
||
| Retail | 1 | $16B |
|
||
| Industrial Distribution | 1 | $10B |
|
||
| Utilities | 1 | $9B |
|
||
Price history
+2.0% since first listed4 events — show timeline
- 2026-05-23 Price Changed $44,900 WCAR
- 2026-05-23 Listed $44,009 WCAR
- 2008-01-03 Sold (Public Records) — Public Records
- 2002-06-10 Sold (Public Records) — Public Records
Property tax history
+1.3%/yrLatest (2025): $116 · +4.3% YoY. Source: county tax records.
Cash-flow waterfall
monthlySold comps — $/sqft
last 12 mo · ≤1 miLoading sold comps…