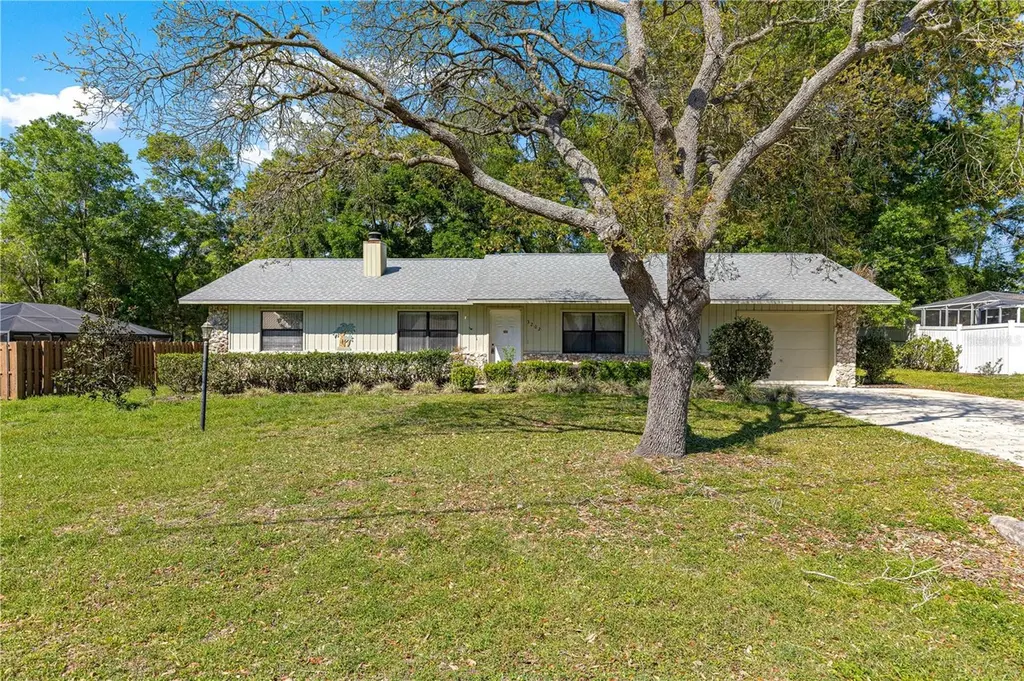
3202 NE 30th Ct · Ocala, FL
Flood risk 1/10 · Minimal
- FEMA flood zone
- X (unshaded)
- Chance of flooding over 30 yrs
- 0.0%
- Est. flood insurance / yr
- $507 – $1,088
Fire risk 4/10 · Minor
- Est. fire insurance / yr
- $947 – $1,759
Heat risk 8/10 · Major
- Hot days now (above 108°F)
- 7 days/yr
- Hot days in 30 yrs
- 22 days/yr
Wind risk 9/10 · Severe
- Chance of severe wind over 30 yrs
- 99.0%
Air-quality risk 4/10 · Minor
- Unhealthy air days now
- 5 days/yr
- Unhealthy air days in 30 yrs
- 5 days/yr
Risk factors via First Street. Map © Google.
Why this score? — see what drove the D+ grade
The composite is a weighted blend of 9 inputs, each scored 0–100. Each bar is that input's sub-score; the figure is the points it added to the 100-point composite (weight × sub-score).
- Cash flow +15.5/30.0
- ARV discount +12.3/15.0
- DSCR +4.8/10.0
- Schools +3.6/10.0
- Livability +3.5/5.0
- 1% rule +3.3/10.0
- Rent growth +2.5/5.0
- Condition / age +2.5/5.0
- Appreciation +0.0/10.0
$214,900
🖨 Deal sheet (PDF) 📄 Offer letter ✓ Due diligence
Listing remarks
3-bedroom, 2-bath home in the established Carol Estates neighborhood of NE Ocala. Features a spacious family room with a wood-burning fireplace and a functional layout The kitchen offers ample cabinet and counter space. The screened in porch overlooks a spacious and well landscaped yard. The backyard is fully fenced with mature trees, a deck area, and storage sheds. Additional features include a single-car garage and convenient access to shopping and dining.
Key facts
- Deck area
- Screened in porch
- Well landscaped yard
Tags
Neighborhood map
What this means for you Summary
Snapshot
- This is a 3-bed/2.0-bath single-family listed at $215k.
Deal economics
- At list price, monthly cash flow is $87 ($1k/yr) — positive.
- The deal already cash-flows at list — no discount required.
- To meet the 1% rule (rent ≥ 1% of price), the offer needs to be $179k (16.9% below list).
- Recommended offer: $179k (16.9% below list) — sets the bar for 1% rule.
- Cap rate 6.8% vs local median 4.1% in Ocala — top-decile yield for the area; either an underpriced asset or a hidden risk that comps aren't pricing in. Stress-test before assuming the spread holds.
Location & tenants
- Location reads 69/100 on livability (#476 in FL) — a middle-class / working-renter tenant base. Strengths: cost of living A+, housing A+, health & safety A+; Watch: crime F, amenities F, commute F.
- Marion (rural): math 42% / reading 43% proficiency, ranked #61 of 73 in FL (top 84%) — families likely to look elsewhere, expect single-tenant / working-renter base with shorter leases; 61% free/reduced lunch — lower-income household profile, screen leases tightly.
- Zoned schools: Ocala Springs Elementary School (math 56% / reading 45%, grade D+, #1,055 of 2,144 statewide, top 50%, 690 students, 67% FRL); Fort King Middle School (math 37% / reading 35%, grade F, #410 of 571 statewide, top 72%, 1,092 students, 71% FRL); Vanguard High School (math 22% / reading 48%, grade F, #379 of 667 statewide, top 58%, 1,661 students, 59% FRL) — zoned schools at 66% FRL track the district average.
- Market conditions: 173 active listings in the ZIP; 10 comparable units currently listed for rent nearby; rentals at typical pace (median 16d on market — plan ~3-4 weeks tenant-placement turnaround); 7,071 units permitted in Marion County in 2024 (534 in 5+ unit buildings).
- This rent runs 39% of the median local income ($54k/yr) — at the standard rent-burdened threshold; future hikes will face affordability resistance.
Forward outlook
- Local home prices are declining (-3.0%/yr); year-one equity from $1k of loan paydown is wiped out by about $6k of value loss. Plan a longer hold.
- Marion County population projected at +13% by 2050 — modest demand growth; plan on rents tracking national, not racing it.
Negotiation context
- Only 14 days on market — expect competitive offers; lowballing is unlikely to land.
- Current owner paid $62k; list at $215k implies a 244% gain — meaningful room to come down on a strong offer.
Risks & watch-outs
- Climate carrying-cost: severe wind risk, 99% chance of damaging wind over 30y; extreme-heat days projected 7→22/yr by 2055 (HVAC capex compounding) — expect insurance premiums to compound above CPI over the hold.
Questions for the listing agent
- Is there a deadline driving the sale (1031 exchange, divorce, estate, relocation)? That informs how much negotiation room exists.
- Crime grade is F in this area — have there been break-ins, vandalism, or insurance claims at this property in the last 3 years? What carrier currently insures it and at what premium?
- The area grade is low — what's the realistic commute time and amenity access for the typical tenant pool here? Any planned neighborhood developments (good or bad) we should know about?
- What's the average days-on-market for RENTAL listings here right now (not sales)? A rising rental-DOM trend means longer vacancies and softer asking-rent achievability than the comps imply.
- What's the recent tenant-quality profile in this submarket — average credit score on applications, eviction rate, late-payment / NSF rate, and stable-employment percentage? A property-management company in the area should have these aggregated.
- How much new for-sale + rental construction is in the pipeline within 1–3 miles? Heavy new supply typically softens prices + rents 12–24 months out; constrained supply supports both.
Investment metrics
- 1% rule
- 0.83% ✗
- Cap rate
- 6.78%
- Cash-on-cash
- 1.73%
- DSCR
- 1.08
- GRM
- 10.0
CMA / ARV
- ARV (on-the-fly)
- $240,828
- Comps found
- 12
Show comp detail 12 sales within ~0.75 mi
| Address | Dist | Beds/Ba | Sqft | Sold | Price | $/sf | Match |
|---|---|---|---|---|---|---|---|
| 3202 NE 30th Ct | 0.00mi | 3/2.0 | 1,316 (0%) | 1mo | $212,000 | $161 | 99 |
| 3115 NE 36th Pl | 0.33mi | 3/2.5 | 1,428 (+8%) | 2mo | $222,000 | $155 | 67 |
| 3155 NE 38th St | 0.46mi | 3/2.0 | 1,263 (-4%) | 9mo | $235,530 | $186 | 65 |
| 4025 NE 29th Ct | 0.61mi | 3/2.0 | 1,300 (-1%) | 9mo | $240,000 | $185 | 62 |
| 3226 NE 35th Pl | 0.27mi | 3/2.0 | 1,440 (+9%) | 12mo | $245,000 | $170 | 62 |
| 3125 NE 38th St | 0.46mi | 3/2.0 | 1,428 (+8%) | 4mo | $250,500 | $175 | 61 |
| 3601 NE 24th Ct | 0.61mi | 3/2.0 | 1,308 (-1%) | 12mo | $199,900 | $153 | 60 |
| 3781 NE 32nd Ct | 0.47mi | 3/2.0 | 1,428 (+8%) | 5mo | $222,000 | $155 | 60 |
| 3537 NE 32nd Ct | 0.47mi | 3/2.0 | 1,276 (-3%) | 19mo | $248,000 | $194 | 57 |
| 2802 NE 25th Ave | 0.50mi | 3/2.0 | 1,471 (+12%) | 1mo | $285,000 | $194 | 56 |
| 3183 NE 35th Ln | 0.46mi | 3/2.0 | 1,440 (+9%) | 13mo | $263,900 | $183 | 52 |
| 4055 NE 29th Ct | 0.63mi | 3/2.0 | 1,250 (-5%) | 16mo | $239,900 | $192 | 49 |
Match score weights: distance 35% · size 25% · config 20% · recency 20%. Top-matched comps best support the ARV.
Projected returns pro-forma
-3.0% appreciation · 3.0% rent growth · sell at horizon
- IRR
- -13.6%
- Equity multiple
- 0.51×
- Total profit
- $-29,354
- Equity at exit
- $32,042
- IRR
- -4.7%
- Equity multiple
- 0.69×
- Total profit
- $-18,719
- Equity at exit
- $18,581
Cash invested: $60,172 (down + closing). Projections, not guarantees.
Landlord ↔ Tenant lean methodology
- Overall (STATE)
- 87 Strongly Landlord-Friendly
- State Florida
- 87 Strongly Landlord-Friendly · R+3
- County
- — inherits STATE
- City
- — inherits STATE
ZIP-level market 34479
- Home prices YoY
- -31.0%
- Active inventory
- 173
- Price-to-rent
- 10.0×
Monthly cashflow live
- Estimated rent
- $1,786 high interval (Pro) →
- Mortgage (P&I)
- −$1,127
- Tax from tax record
- −$108 /mo · $1,293/yr
- Insurance
- −$90
- HOA
- −$0
- Vacancy / Maint / Mgmt
- −$375
- Net cashflow
- $87
Break-even live
Sensitivity live
| Price | -10% $209 | -5% $148 | +0% $87 | +5% $26 | +10% $-35 |
|---|---|---|---|---|---|
| Rent | -10% $-54 | -5% $16 | +0% $87 | +5% $158 | +10% $228 |
| Rate | -1.0pp $195 | -0.5pp $142 | base $87 | +0.5pp $31 | +1.0pp $-25 |
UW: 25.0% down · 7.5% · 30yr · 1.5% tax · 5.0% vac · 8.0% maint · 8.0% mgmt
Financing live
Cash to close
- Down payment
- $53,725
- Closing costs
- $6,447
- Reserves months
- —
- Total cash needed
- —
Loan-product check · same deal, 3 products live
Conventional
25% down · 7.5% · 30yr
- Down + closing
- —
- Monthly P&I
- —
- Monthly cashflow
- —
- DSCR
- —
- Eligible?
- —
Personal DTI + credit; lowest rate.
DSCR
20% down · 8.5% · 30yr
- Down + closing
- —
- Monthly P&I
- —
- Monthly cashflow
- —
- DSCR
- —
- Eligible?
- —
No personal income docs; deal must DSCR.
Hard money
10% down · 12.0% · 12mo
- Down + closing
- —
- Monthly P&I
- —
- Monthly cashflow
- —
- DSCR
- —
- Eligible?
- —
Short-term bridge; refi at stabilization.
Rent comps 10 comps
| Address | Beds | Baths | Sqft | Rent | $/sqft | DOM | Units | Dist |
|---|---|---|---|---|---|---|---|---|
| 3656 NE 30th Ter Ocala, FL | 4.0 | 2.5 | 1853 | $2,150 | $1.16 | 15d | 1 | 0.30mi |
| 3380 NE 44th Pl Ocala, FL | 3.0 | 2.0 | 1392 | $1,650 | $1.19 | 23d | 1 | 0.90mi |
| 2855 NE 20th Ter Ocala, FL | 3.0 | 2.0 | 1504 | $1,875 | $1.25 | 15d | 1 | 0.92mi |
| 2122 NE 28th Pl Ocala, FL | 3.0 | 2.0 | 1328 | $2,100 | $1.58 | 15d | 1 | 0.94mi |
| 3651 NE 20th Pl Ocala, FL | 2.0 | 1.5 | 1178 | $1,350 | $1.15 | 23d | 1 | 1.03mi |
| 2305 NE 40th Ave Ocala, FL | 2.0 | 2.0 | 1110 | $1,425 | $1.28 | 15d | 1 | 1.07mi |
| 1725 NE 36th Ave Ocala, FL | 2.0–3.0 | 1.0–2.0 | 1186 | $1,600 | $1.35 | 15d | 5 | 1.11mi |
| 3219 NE 16th Ct Unit 3219 Ocala, FL | 3.0 | 2.0 | 1200 | $1,700 | $1.42 | 15d | 1 | 1.27mi |
| NE 21st St Ocala, FL | 2.0 | 1.5 | 1178 | $1,199 | $1.02 | 23d | 1 | 1.38mi |
| 1312 NE 33rd Ave Ocala, FL | 2.0 | 1.0 | 950 | $1,499 | $1.58 | 15d | 1 | 1.40mi |
Listing history 4 events
-
2026-04-15status Pending
-
2026-04-01$214,900 Active
-
1992-07-01soldstatus $62,500
-
1985-10-01soldstatus $62,000
ⓘ Source: listings_history table (triggers on properties + properties_extension) + one-shot
backfill from property_details.listing_events for pre-trigger history.
Tax reassessment forecast FL · Resets to sale price
- Current annual tax
- $1,293 · $108/mo
- Projected year-2 tax
- $1,784 · $149/mo
- Expected delta
- +$491/yr (+$41/mo · 38.0%)
ⓘ Screening estimate from a state-policy table — verify with the county assessor before closing.
Climate risk First Street
- Flood 1/10 Low FEMA zone X (unshaded) · 0% chance over 30 yrs
- Wildfire 4/10 Moderate
- Heat 8/10 Severe 7 d/yr ≥108°F today · 22 d/yr by 30 yrs out
- Wind 9/10 Extreme 99% chance of damaging wind over 30 yrs
- Air quality 4/10 Moderate 5 unhealthy d/yr today · 5 by 30 yrs out
Nearby sold comps map
Loading sold comps map…
Walkable amenities ~0.75 mi
Loading nearby amenities…
Taxation est. · year 1
- Rental income
- $21,436
- − Mortgage interest
- −$12,038
- − Property taxes
- −$1,293
- − Insurance
- −$1,074
- − Repairs & maintenance
- −$1,715
- − Management
- −$1,715
- − Depreciation
- −$6,252
- Taxable loss
- −$2,650
- Est. tax savings @ 24.0%
- +$636
- After-tax cash flow
- $1,680/yr
For passive investors: Depreciation is non-cash, so a rental often shows a tax loss while cash-flowing — sheltering income. Rental losses are passive: they offset passive income freely, and up to $25,000/yr can offset ordinary (W-2) income if you actively participate and your MAGI is under $100k (phasing out to $0 by $150k); unused losses carry forward. On sale, claimed depreciation is recaptured at up to 25%, and gains may owe capital-gains tax (a 1031 exchange can defer both). Figures are a year-1 estimate at your 24.0% rate — not tax advice; consult a CPA.
Schools (NCES district)
- District
- Marion
- NCES district ID
- 1201260
- Math proficiency
- 42% ▼ -7.00%
- Reading proficiency
- 43% ▼ -4.00%
- Median HH income
- $40,015
- Composite
- 35.61/100
- National rank
- #4890
- State rank
- #61 of 73 in FL
Livability — Ocala
- Score
- 69/100
- State rank
- #476
- US rank
- #8461
Category grades
Schools grade is shown separately in the Schools card above.
Census & demographics
- County
- Marion County · 315,796 people
- City population
- 263,375
- Metro
- Ocala, FL
- Population (ZIP)
- 13,264
- Household income
- $54,283
- Rent vs Own
- Severe rent burden
- 664.0
Population outlook (Marion County) Hauer SSP2
- Today (2025)
- 365,905 people
- By 2030
- 376,768 · +3.0%
- By 2040
- 396,555 · +8.4%
- By 2050
- 412,723 · +12.8%
- By 2075
- 446,090 · +21.9%
- By 2100
- 436,193 · +19.2%
Race, ethnicity, and origin ACS 2023
- Neighborhood character
- Predominantly White (66%)
- Race & ethnicity
- White 66% Hispanic / Latino 15% Black 14% Two or more races 9%
- Hispanic origin (detail)
- Mexican 5% Puerto Rican 6% Cuban 2%
- Common ancestry
- Lithuanian 2% Italian 2% Estonian 1%
- Foreign-born
- 5% · Canada, Jamaica
- Languages at home
- 87% English-only · Spanish 11% Other Indo-European 1%
Political lean MEDSL · Marion
- 2024 margin
- Solid R (+31.6) · D 33.8% · R 65.5%
- 2008→2024 swing
- -20.0pp toward R · 2008: -11.6pp · 2024: -31.6pp
- All cycles
- 2024: R+31.6 2020: R+25.9 2016: R+26.2 2012: R+16.2 2008: R+11.6
Not yet ingested
- Civics
- —
Market trends
- HPI YoY
- ▼ -111.70%
- Current HPI
- 248.7063
- Rent YoY
- —
- Metro
- Ocala, FL
- State GDP YoY
- ▲ 3.28%
- F500 in state
- 36
Industry mix (Fortune 500 HQ in FL)
| Industry | F500 HQs | Revenue |
|---|---|---|
| Industrial Technology | 2 | $29B |
|
||
| Insurance | 2 | $17B |
|
||
| Retail | 1 | $60B |
|
||
| Technology Distribution | 1 | $58B |
|
||
| Homebuilding | 1 | $35B |
|
||
| Technology Manufacturing | 1 | $35B |
|
||
Price history
+246.6% since first listed4 events — show timeline
- 2026-04-15 Pending — Stellar MLS as Distributed by MLS Grid
- 2026-04-01 Listed $214,900 Stellar MLS as Distributed by MLS Grid
- 1992-07-01 Sold (Public Records) $62,500 Public Records
- 1985-10-01 Sold (Public Records) $62,000 Public Records
Property tax history
+3.4%/yrLatest (2025): $1,293 · +328.2% YoY. Source: county tax records.
Cash-flow waterfall
monthlySold comps — $/sqft
last 12 mo · ≤1 miLoading sold comps…