 Duplex
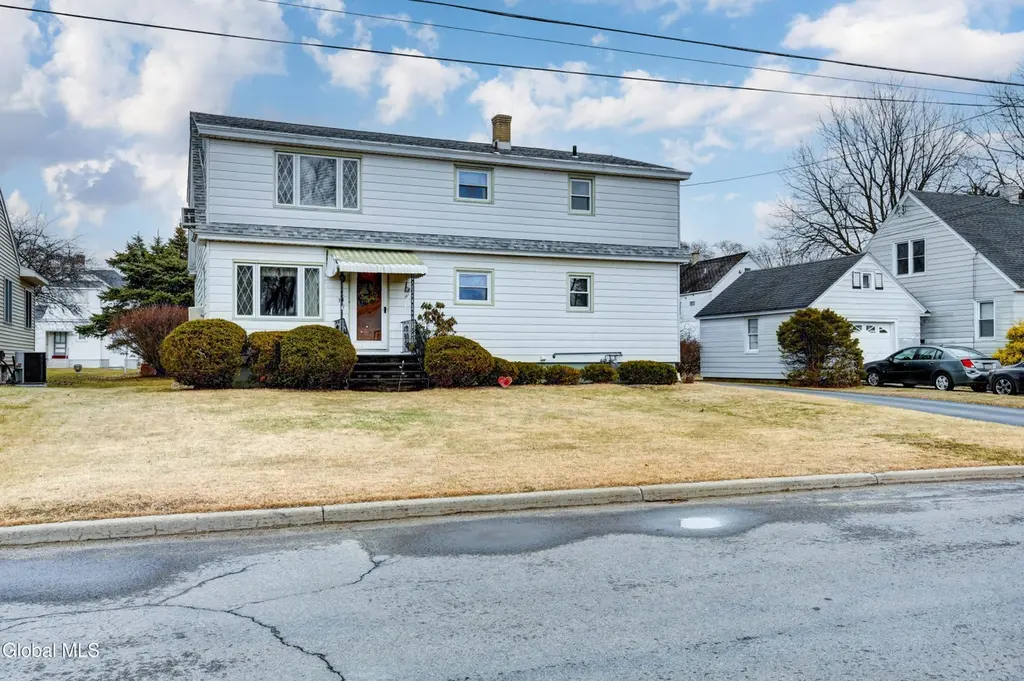
34 Cochrane Ave · Amsterdam, NY
Flood risk 1/10 · Minimal
- FEMA flood zone
- X (unshaded)
- Chance of flooding over 30 yrs
- 0.0%
- Est. flood insurance / yr
- $473 – $860
Fire risk 1/10 · Minimal
- Est. fire insurance / yr
- $691 – $1,283
Heat risk 3/10 · Minor
- Hot days now (above 94°F)
- 7 days/yr
- Hot days in 30 yrs
- 17 days/yr
Wind risk 3/10 · Minor
- Chance of severe wind over 30 yrs
- 5.0%
Air-quality risk 1/10 · Minimal
- Unhealthy air days now
- 0 days/yr
- Unhealthy air days in 30 yrs
- 0 days/yr
Risk factors via First Street. Map © Google.
Why this score? — see what drove the B- grade
The composite is a weighted blend of 9 inputs, each scored 0–100. Each bar is that input's sub-score; the figure is the points it added to the 100-point composite (weight × sub-score).
- Cash flow +29.4/30.0
- DSCR +10.0/10.0
- Appreciation +10.0/10.0
- 1% rule +8.4/10.0
- Livability +3.8/5.0
- Schools +3.2/10.0
- Rent growth +2.5/5.0
- Condition / age +2.5/5.0
- ARV discount +0.0/15.0
$225,000
🖨 Deal sheet 📄 Offer letter ✓ Due diligence
Multi-family units
County records classify this as Multi-Family (2-4 Unit). Listing-text estimate: 2 units. confirmed
Listing remarks
Open House Cancelled! Lovingly owned by the same family for generations, this beautifully maintained two-family home reflects true owner-occupied pride. Each spacious unit offers 2 bedrooms (upstairs 2+) large living rooms with a picture windows, eat-in kitchens, and full baths. You'll also appreciate the generous storage space found throughout the home. The finished basement provides a fantastic recreation area with built in bar and plenty of room for card tables, a pool table, and more. A separate utility/laundry room houses the furnace and hot water tank. The exterior is equally inviting, featuring a patio, mature landscaping, and a 2-car garage with plenty of off street parking.
Key facts
- Built in bar
- Finished basement
- Patio
Tags
Neighborhood map
What this means for you Summary
Snapshot
- This is a 2 × 2-bed/1.0-bath units multifamily listed at $225k.
Deal economics
- At list price, monthly cash flow is $796 ($10k/yr) — positive. Per door: $398/mo.
- The deal already cash-flows at list — no discount required.
- Meets the 1% rule at list price ($3k rent vs $225k).
- Cap rate 10.5% vs local median 6.3% in Amsterdam — top-decile yield for the area; either an underpriced asset or a hidden risk that comps aren't pricing in. Stress-test before assuming the spread holds.
Location & tenants
- Location reads 75/100 on livability (#247 in NY, #3,884 nationally) — a middle-class / working-renter tenant base. Strengths: cost of living A+, housing A+, health & safety A+; Watch: crime F, employment F.
- Amsterdam City School District (town): math 35% / reading 41% proficiency, ranked #546 of 590 in NY (top 92%) — families likely to look elsewhere, expect single-tenant / working-renter base with shorter leases.
- Zoned schools: Amsterdam High School (math 75% / reading 82%, grade A-, #563 of 1,100 statewide, top 52%, 1,179 students, 68% FRL) — zoned schools average 68% FRL vs 40% district-wide (28 pts higher); higher-poverty schools than district average — tighter screening recommended.
- Zoned-school proficiency averages 78% at this address vs 38% district-wide (+40 pts) — the actual schools serving this property are materially stronger than the Amsterdam City School District average implies; a family-tenant draw the district grade alone would hide.
- Market conditions: 164 active listings in the ZIP; 210 units permitted in Montgomery County in 2024 (168 in 5+ unit buildings).
Forward outlook
- In year one you build about $24k of equity ($2k loan paydown + $22k appreciation (10.0% local appreciation)).
- Montgomery County population projected at -11% by 2050 — secular population decline; favor cash flow + early exit over multi-decade hold.
- At projected returns (10.0% appreciation + 3.0% rent growth), your $63k cash investment doubles in ~2 years — after that, you're playing with house money.
- By year 2, paydown + projected appreciation supports a ~$39k cash-out refi (75% LTV) — recoverable capital for the next deal without selling this one.
Negotiation context
- Only 5 days on market — expect competitive offers; lowballing is unlikely to land.
Risks & watch-outs
- Watch-outs: built in 1952 — expect roof / HVAC / electrical / plumbing capex.
Questions for the listing agent
- Can we see the unit-by-unit rent roll, current vacancy, and any below-market leases? What's the average tenancy length?
- What capital expenditures (roof, boiler, parking lot, exteriors) have been made in the last 5 years, and what's planned in the next 2?
- Built in 1952 — when were the roof, HVAC, electrical panel, plumbing, and water heater last replaced?
- Is there a deadline driving the sale (1031 exchange, divorce, estate, relocation)? That informs how much negotiation room exists.
- Schools are D-rated, which usually means shorter tenancies and higher turnover. Who's the typical renter profile here, and what's been the actual vacancy rate?
- Crime grade is F in this area — have there been break-ins, vandalism, or insurance claims at this property in the last 3 years? What carrier currently insures it and at what premium?
- What's the average days-on-market for RENTAL listings here right now (not sales)? A rising rental-DOM trend means longer vacancies and softer asking-rent achievability than the comps imply.
- What's the recent tenant-quality profile in this submarket — average credit score on applications, eviction rate, late-payment / NSF rate, and stable-employment percentage? A property-management company in the area should have these aggregated.
- How much new apartment / multifamily construction is in the pipeline within 1–3 miles? Heavy new supply (>2% of stock underway) typically softens rents 12–24 months out; light construction supports rent growth.
Investment metrics
- 1% rule
- 1.34% ✓
- Cap rate
- 10.54%
- Cash-on-cash
- 15.16%
- DSCR
- 1.67
- GRM
- 6.2
CMA / ARV
- ARV (on-the-fly)
- $171,360
- Comps found
- 8
Show comp detail 8 sales within ~0.75 mi
| Address | Dist | Beds/Ba | Sqft | Sold | Price | $/sf | Match |
|---|---|---|---|---|---|---|---|
| 249 Forest Ave | 0.32mi | 5/3.0 (+1) | 2,590 (+3%) | 13mo | $175,000 | $68 | 61 |
| 225-227 Brookside Ave | 0.55mi | 4/2.0 | 2,358 (-6%) | 8mo | $112,000 | $47 | 57 |
| 40 3rd St | 0.30mi | 4/2.0 | 2,193 (-13%) | 14mo | $134,020 | $61 | 53 |
| 28 Gorski St | 0.64mi | 5/2.0 (+1) | 2,388 (-5%) | 7mo | $271,000 | $113 | 51 |
| 20 Milton Ave | 0.70mi | 4/2.0 | 2,286 (-9%) | 18mo | $128,000 | $56 | 37 |
| 298-300 Locust Ave | 0.57mi | 5/2.0 (+1) | 2,156 (-14%) | 10mo | $110,000 | $51 | 36 |
| 17 Pleasant Ave | 0.61mi | 5/2.0 (+1) | 2,888 (+15%) | 23mo | $220,000 | $76 | 23 |
| 50 Gorski St | 0.74mi | 4/2.0 | 2,160 (-14%) | 23mo | $227,000 | $105 | 22 |
Match score weights: distance 35% · size 25% · config 20% · recency 20%. Top-matched comps best support the ARV.
Projected returns pro-forma
10.0% appreciation · 3.0% rent growth · sell at horizon
- IRR
- 35.5%
- Equity multiple
- 3.75×
- Total profit
- $173,304
- Equity at exit
- $202,698
- IRR
- 30.6%
- Equity multiple
- 8.47×
- Total profit
- $470,612
- Equity at exit
- $437,126
Cash invested: $63,000 (down + closing). Projections, not guarantees.
Landlord ↔ Tenant lean methodology
- Overall (STATE)
- 15 Strongly Tenant-Friendly
- State New York
- 15 Strongly Tenant-Friendly · D+10
- County
- — inherits STATE
- City
- — inherits STATE
ZIP-level market 12010
- Home prices YoY
- 4.0%
- Active inventory
- 164
- Price-to-rent
- 12.4×
Monthly cashflow live
- Estimated rent
- $3,016 high interval (Pro) →
- Mortgage (P&I)
- −$1,180
- Tax from tax record
- −$313 /mo · $3,756/yr
- Insurance
- −$94
- HOA
- −$0
- Vacancy / Maint / Mgmt
- −$633
- Net cashflow
- $796
Break-even live
2-unit breakdown (identical units grouped — click to expand)
| Units | Beds | Baths | Est. rent |
|---|---|---|---|
| 2× units | 2 | 1 | $3,016 |
| #1 | 2 | 1 | $1,508 |
| #2 | 2 | 1 | $1,508 |
| Total (2 units) | $3,016 | ||
UW: 25.0% down · 7.5% · 30yr · 1.5% tax · 5.0% vac · 8.0% maint · 8.0% mgmt
Financing live
Cash to close
- Down payment
- $56,250
- Closing costs
- $6,750
- Reserves months
- —
- Total cash needed
- —
Loan-product check · same deal, 3 products live
Conventional
25% down · 7.5% · 30yr
- Down + closing
- —
- Monthly P&I
- —
- Monthly cashflow
- —
- DSCR
- —
- Eligible?
- —
Personal DTI + credit; lowest rate.
DSCR
20% down · 8.5% · 30yr
- Down + closing
- —
- Monthly P&I
- —
- Monthly cashflow
- —
- DSCR
- —
- Eligible?
- —
No personal income docs; deal must DSCR.
Hard money
10% down · 12.0% · 12mo
- Down + closing
- —
- Monthly P&I
- —
- Monthly cashflow
- —
- DSCR
- —
- Eligible?
- —
Short-term bridge; refi at stabilization.
Listing history 2 events
-
2026-03-28status Pending
-
2026-03-23$225,000 Active
ⓘ Source: listings_history table (triggers on properties + properties_extension) + one-shot
backfill from property_details.listing_events for pre-trigger history.
Tax reassessment forecast NY · Partial reset (capped growth)
- Current annual tax
- $3,756 · $313/mo
- Projected year-2 tax
- $3,779 · $315/mo
- Expected delta
- +$23/yr (+$2/mo · 0.6%)
ⓘ Screening estimate from a state-policy table — verify with the county assessor before closing.
Climate risk First Street
- Flood 1/10 Low FEMA zone X (unshaded) · 0% chance over 30 yrs
- Wildfire 1/10 Low
- Heat 3/10 Moderate 7 d/yr ≥94°F today · 17 d/yr by 30 yrs out
- Wind 3/10 Moderate 5% chance of damaging wind over 30 yrs
- Air quality 1/10 Low 0 unhealthy d/yr today · 0 by 30 yrs out
Nearby sold comps map
Loading sold comps map…
Walkable amenities ~0.75 mi
Loading nearby amenities…
Taxation est. · year 1
- Rental income
- $36,192
- − Mortgage interest
- −$12,603
- − Property taxes
- −$3,756
- − Insurance
- −$1,125
- − Repairs & maintenance
- −$2,895
- − Management
- −$2,895
- − Depreciation
- −$6,545
- Taxable income
- $6,372
- Est. tax owed @ 24.0%
- −$1,529
- After-tax cash flow
- $8,023/yr
For passive investors: Depreciation is non-cash, so a rental often shows a tax loss while cash-flowing — sheltering income. Rental losses are passive: they offset passive income freely, and up to $25,000/yr can offset ordinary (W-2) income if you actively participate and your MAGI is under $100k (phasing out to $0 by $150k); unused losses carry forward. On sale, claimed depreciation is recaptured at up to 25%, and gains may owe capital-gains tax (a 1031 exchange can defer both). Figures are a year-1 estimate at your 24.0% rate — not tax advice; consult a CPA.
Schools (NCES district)
- District
- Amsterdam City School District
- NCES district ID
- 3602970
- Math proficiency
- 35% ▲ 5.00%
- Reading proficiency
- 41% ▲ 10.00%
- Median HH income
- $41,735
- Composite
- 32.03/100
- National rank
- #5824
- State rank
- #546 of 590 in NY
Livability — Amsterdam
- Score
- 75/100
- State rank
- #247
- US rank
- #3884
Category grades
Schools grade is shown separately in the Schools card above.
Census & demographics
- Census place
- Amsterdam, NY
- City population
- 27,339
- Population (ZIP)
- 27,339
Population outlook (Montgomery County) Hauer SSP2
- Today (2025)
- 48,683 people
- By 2030
- 47,785 · -1.8%
- By 2040
- 45,492 · -6.6%
- By 2050
- 43,161 · -11.3%
- By 2075
- 38,134 · -21.7%
- By 2100
- 32,337 · -33.6%
Race, ethnicity, and origin ACS 2023
- Neighborhood character
- Predominantly White (68%)
- Race & ethnicity
- White 68% Hispanic / Latino 23% Two or more races 9% Black 4% Asian 1%
- Hispanic origin (detail)
- Mexican 2% Puerto Rican 18%
- Common ancestry
- Romanian 12% Lithuanian 2% Iranian 2%
- Foreign-born
- 5% · Canada
- Languages at home
- 86% English-only · Spanish 11% Russian/Polish/Slavic 1% Other Indo-European 1%
Political lean MEDSL · Montgomery
- 2024 margin
- Strong R (+28.7) · D 35.6% · R 64.4%
- 2008→2024 swing
- -20.6pp toward R · 2008: -8.1pp · 2024: -28.7pp
- All cycles
- 2024: R+28.7 2020: R+22.6 2016: R+26.5 2012: R+4.4 2008: R+8.1
Not yet ingested
- Civics
- —
Market trends
- HPI YoY
- ▲ 12.12%
- Current HPI
- 312.4966
- Rent YoY
- —
- Metro
- —
- State GDP YoY
- ▲ 2.60%
- F500 in state
- 92
Industry mix (Fortune 500 HQ in NY)
| Industry | F500 HQs | Revenue |
|---|---|---|
| Financial Services | 10 | $950B |
|
||
| Consumer Goods | 9 | $162B |
|
||
| Insurance | 4 | $225B |
|
||
| Telecommunications | 2 | $144B |
|
||
| Pharmaceuticals | 2 | $112B |
|
||
| Media / Entertainment | 2 | $69B |
|
||
Price history
2 events — show timeline
- 2026-03-28 Pending — Global MLS
- 2026-03-23 Listed $225,000 Global MLS
Property tax history
+5.8%/yrLatest (2025): $3,756 · -5.4% YoY. Source: county tax records.
Cash-flow waterfall
monthlySold comps — $/sqft
last 12 mo · ≤1 miLoading sold comps…