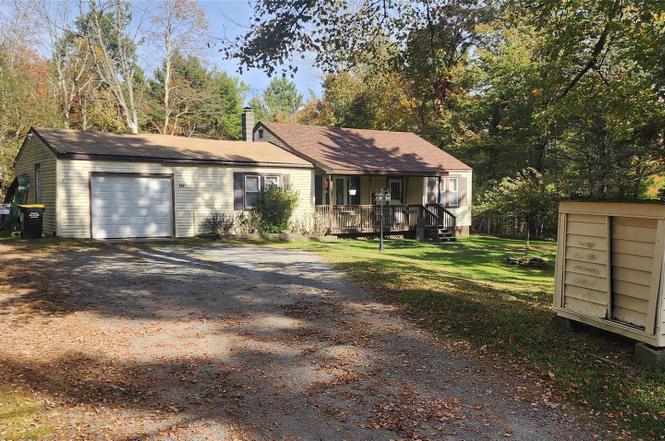
565 Cold Spring Rd · Monticello, NY
Flood risk 1/10 · Minimal
- FEMA flood zone
- X (unshaded)
- Chance of flooding over 30 yrs
- 0.0%
- Est. flood insurance / yr
- $473 – $860
Fire risk 3/10 · Minor
- Est. fire insurance / yr
- $691 – $1,283
Heat risk 2/10 · Minimal
- Hot days now (above 93°F)
- 7 days/yr
- Hot days in 30 yrs
- 15 days/yr
Wind risk 3/10 · Minor
- Chance of severe wind over 30 yrs
- 5.0%
Air-quality risk 2/10 · Minimal
- Unhealthy air days now
- 1 days/yr
- Unhealthy air days in 30 yrs
- 1 days/yr
Risk factors via First Street. Map © Google.
Why this score? — see what drove the D grade
The composite is a weighted blend of 9 inputs, each scored 0–100. Each bar is that input's sub-score; the figure is the points it added to the 100-point composite (weight × sub-score).
- Appreciation +10.0/10.0
- Cash flow +9.5/30.0
- ARV discount +7.5/15.0
- Livability +3.1/5.0
- 1% rule +2.9/10.0
- DSCR +2.7/10.0
- Rent growth +2.5/5.0
- Schools +2.5/10.0
- Condition / age +2.5/5.0
$220,000
🖨 Deal sheet (PDF) 📄 Offer letter ✓ Due diligence
Listing remarks
An affordable Ranch home in the country. This lovely property and the home features two bedrooms, one full bathroom, a spacious living room, a kitchen, and convenient main-floor laundry, hot air heat and and additional mini split for the heating and cooling. One of the highlights of this home is the beautiful sunroom, located just off the kitchen, perfect for relaxation or enjoying a cool summer breeze. The property also includes an attached one-car garage, currently used for storage, and an additional detached garage or barn. While there is a full unfinished basement, it currently lacks direct access from the main floor; however, this layout could be reversed. The home sits on a nice, leve
Key facts
- Level lot
- Sunroom
- Hot air heat
Tags
Property features AI
Exterior
- Parking: Driveway; Garage (1 space); Total parking for 1 vehicle
- Utilities: Electric service provided by NYSEG; Septic tank; Cable connected; Electricity connected; Phone connected
- Home design: Single-family residence; One level; Property condition listed as actual
- Construction: Frame construction; Block foundation
- Exterior features: Back yard; Cleared lot; Level lot; Not waterfront
Interior
- Kitchen: Oven; Range; Refrigerator
- Bedrooms: Bedroom on the first floor
- Flooring: Carpet; Wood
- Bathrooms: 1 full bathroom
- Heating & cooling: Heat pump; Hot air heating; Electric cooling
- Interior features: First-floor bedroom; Covered patio/porch; Full attic; Full basement; Five total rooms
- Laundry & utility: Laundry located in hall
Neighborhood map
What this means for you Summary
Snapshot
- This is a 2-bed/1.0-bath single-family listed at $220k.
Deal economics
- At list price, monthly cash flow is $-151 ($-2k/yr) — negative.
- To cash-flow at today's rent, offer at most $198k (9.9% below list).
- To meet the 1% rule (rent ≥ 1% of price), the offer needs to be $173k (21.2% below list).
- Recommended offer: $173k (21.2% below list) — sets the bar for 1% rule.
- Cap rate 5.5% vs local median 3.4% in Monticello — top-decile yield for the area; either an underpriced asset or a hidden risk that comps aren't pricing in. Stress-test before assuming the spread holds.
Location & tenants
- Location reads 61/100 on livability (#899 in NY) — a middle-class / working-renter tenant base. Strengths: housing A+, cost of living A-; Watch: crime D, amenities F, commute F.
- Monticello Central School District (town): math 29% / reading 30% proficiency, ranked #577 of 590 in NY (top 98%) — low school quality limits family demand, transient renter base, plan for 1-2y turnover.
- Zoned schools: George L Cooke School (592 students, 71% FRL); Robert J Kaiser Middle School (math 7% / reading 35%, grade F, #661 of 729 statewide, top 91%, 595 students, 66% FRL); Monticello High School (math 82% / reading 34%, grade C, #879 of 1,100 statewide, top 80%, 844 students, 63% FRL) — zoned schools average 67% FRL vs 50% district-wide (16 pts higher); higher-poverty schools than district average — tighter screening recommended.
- Market conditions: 188 active listings in the ZIP; 739 units permitted in Sullivan County in 2024 (5 in 5+ unit buildings).
- This rent runs 36% of the median local income ($57k/yr) — at the standard rent-burdened threshold; future hikes will face affordability resistance.
Forward outlook
- In year one you build about $24k of equity ($2k loan paydown + $22k appreciation (10.0% local appreciation)).
- Sullivan County population projected at -24% by 2050 — secular population decline; favor cash flow + early exit over multi-decade hold.
- By year 2, paydown + projected appreciation supports a ~$38k cash-out refi (75% LTV) — recoverable capital for the next deal without selling this one.
Negotiation context
- Only 5 days on market — expect competitive offers; lowballing is unlikely to land.
- 2 sale attempts with the ask held roughly flat each time — persistent listings suggest the price (not the market) is what's stuck; bring a comps-based counter.
- Current owner paid $120k; list at $220k implies a 83% gain — meaningful room to come down on a strong offer.
Risks & watch-outs
- Watch-outs: built in 1951 — expect roof / HVAC / electrical / plumbing capex.
Questions for the listing agent
- What do current leases actually rent for vs. the listed asking? Can we see a recent rent roll and the last 12 months of T-12 income?
- Built in 1951 — when were the roof, HVAC, electrical panel, plumbing, and water heater last replaced?
- Is there a deadline driving the sale (1031 exchange, divorce, estate, relocation)? That informs how much negotiation room exists.
- Schools are F-rated, which usually means shorter tenancies and higher turnover. Who's the typical renter profile here, and what's been the actual vacancy rate?
- Crime grade is D in this area — have there been break-ins, vandalism, or insurance claims at this property in the last 3 years? What carrier currently insures it and at what premium?
- The area grade is low — what's the realistic commute time and amenity access for the typical tenant pool here? Any planned neighborhood developments (good or bad) we should know about?
- What's the average days-on-market for RENTAL listings here right now (not sales)? A rising rental-DOM trend means longer vacancies and softer asking-rent achievability than the comps imply.
- What's the recent tenant-quality profile in this submarket — average credit score on applications, eviction rate, late-payment / NSF rate, and stable-employment percentage? A property-management company in the area should have these aggregated.
- How much new for-sale + rental construction is in the pipeline within 1–3 miles? Heavy new supply typically softens prices + rents 12–24 months out; constrained supply supports both.
Investment metrics
- 1% rule
- 0.79% ✗
- Cap rate
- 5.47%
- Cash-on-cash
- -2.94%
- DSCR
- 0.87
- GRM
- 10.6
CMA / ARV
No comps found within radius.
Projected returns pro-forma
10.0% appreciation · 3.0% rent growth · sell at horizon
- IRR
- 22.2%
- Equity multiple
- 2.79×
- Total profit
- $110,228
- Equity at exit
- $198,193
- IRR
- 19.9%
- Equity multiple
- 6.39×
- Total profit
- $332,217
- Equity at exit
- $427,412
Cash invested: $61,600 (down + closing). Projections, not guarantees.
Landlord ↔ Tenant lean methodology
- Overall (STATE)
- 15 Strongly Tenant-Friendly
- State New York
- 15 Strongly Tenant-Friendly · D+10
- County
- — inherits STATE
- City
- — inherits STATE
ZIP-level market 12701
- Home prices YoY
- 16.7%
- Active inventory
- 188
- Price-to-rent
- 10.6×
Monthly cashflow live
- Estimated rent
- $1,733 medium interval (Pro) →
- Mortgage (P&I)
- −$1,154
- Tax est. 1.5%
- −$275 /mo · $3,300/yr
- Insurance
- −$92
- HOA
- −$0
- Vacancy / Maint / Mgmt
- −$364
- Net cashflow
- $-151
Break-even live
Sensitivity live
| Price | -10% $1 | -5% $-75 | +0% $-151 | +5% $-227 | +10% $-303 |
|---|---|---|---|---|---|
| Rent | -10% $-288 | -5% $-219 | +0% $-151 | +5% $-83 | +10% $-14 |
| Rate | -1.0pp $-40 | -0.5pp $-95 | base $-151 | +0.5pp $-208 | +1.0pp $-266 |
UW: 25.0% down · 7.5% · 30yr · 1.5% tax · 5.0% vac · 8.0% maint · 8.0% mgmt
Financing live
Cash to close
- Down payment
- $55,000
- Closing costs
- $6,600
- Reserves months
- —
- Total cash needed
- —
Loan-product check · same deal, 3 products live
Conventional
25% down · 7.5% · 30yr
- Down + closing
- —
- Monthly P&I
- —
- Monthly cashflow
- —
- DSCR
- —
- Eligible?
- —
Personal DTI + credit; lowest rate.
DSCR
20% down · 8.5% · 30yr
- Down + closing
- —
- Monthly P&I
- —
- Monthly cashflow
- —
- DSCR
- —
- Eligible?
- —
No personal income docs; deal must DSCR.
Hard money
10% down · 12.0% · 12mo
- Down + closing
- —
- Monthly P&I
- —
- Monthly cashflow
- —
- DSCR
- —
- Eligible?
- —
Short-term bridge; refi at stabilization.
Listing history 4 events
-
2026-06-21days on market $220,000 Active 5 DOM
-
2026-06-18days on market $220,000 Active 2 DOM
-
2026-06-16remarks 699-char remark
-
2026-06-16$220,000 Active 1 DOM
ⓘ Source: listings_history table (triggers on properties + properties_extension) + one-shot
backfill from property_details.listing_events for pre-trigger history.
Climate risk First Street
- Flood 1/10 Low FEMA zone X (unshaded) · 0% chance over 30 yrs
- Wildfire 3/10 Moderate
- Heat 2/10 Low 7 d/yr ≥93°F today · 15 d/yr by 30 yrs out
- Wind 3/10 Moderate 5% chance of damaging wind over 30 yrs
- Air quality 2/10 Low 1 unhealthy d/yr today · 1 by 30 yrs out
Nearby sold comps map
Loading sold comps map…
Walkable amenities ~0.75 mi
Loading nearby amenities…
Taxation est. · year 1
- Rental income
- $20,801
- − Mortgage interest
- −$12,323
- − Property taxes
- −$3,300
- − Insurance
- −$1,100
- − Repairs & maintenance
- −$1,664
- − Management
- −$1,664
- − Depreciation
- −$6,400
- Taxable loss
- −$5,651
- Est. tax savings @ 24.0%
- +$1,356
- After-tax cash flow
- $-456/yr
For passive investors: Depreciation is non-cash, so a rental often shows a tax loss while cash-flowing — sheltering income. Rental losses are passive: they offset passive income freely, and up to $25,000/yr can offset ordinary (W-2) income if you actively participate and your MAGI is under $100k (phasing out to $0 by $150k); unused losses carry forward. On sale, claimed depreciation is recaptured at up to 25%, and gains may owe capital-gains tax (a 1031 exchange can defer both). Figures are a year-1 estimate at your 24.0% rate — not tax advice; consult a CPA.
Schools (NCES district)
- District
- Monticello Central School District
- NCES district ID
- 3619740
- Math proficiency
- 29% ▼ -4.00%
- Reading proficiency
- 30% ▼ -2.00%
- Median HH income
- $44,696
- Composite
- 25.28/100
- National rank
- #7491
- State rank
- #577 of 590 in NY
Livability — Monticello
- Score
- 61/100
- State rank
- #899
- US rank
- #17510
Category grades
Schools grade is shown separately in the Schools card above.
Census & demographics
- County
- Sullivan County · 12,197 people
- City population
- 12,197
- Metro
- nan
- Population (ZIP)
- 12,197
- Household income
- $57,222
- Rent vs Own
- Severe rent burden
- 814.0
Population outlook (Sullivan County) Hauer SSP2
- Today (2025)
- 68,974 people
- By 2030
- 65,609 · -4.9%
- By 2040
- 58,878 · -14.6%
- By 2050
- 52,500 · -23.9%
- By 2075
- 39,941 · -42.1%
- By 2100
- 28,880 · -58.1%
Race, ethnicity, and origin ACS 2023
- Neighborhood character
- Diverse neighborhood (Simpson 0.69)
- Race & ethnicity
- White 43% Hispanic / Latino 31% Black 15% Two or more races 15% Asian 5%
- Hispanic origin (detail)
- Mexican 1% Puerto Rican 19% Dominican 3%
- Common ancestry
- Scotch-Irish 3% Romanian 2% Iranian 1%
- Foreign-born
- 15% · Canada, China, Jamaica
- Languages at home
- 71% English-only · Spanish 20% Other Indo-European 3% Russian/Polish/Slavic 2%
Political lean MEDSL · Sullivan
- 2024 margin
- R (+16.7) · D 41.6% · R 58.4%
- 2008→2024 swing
- -26.2pp toward R · 2008: 9.5pp · 2024: -16.7pp
- All cycles
- 2024: R+16.7 2020: R+9.2 2016: R+13.7 2012: D+10.4 2008: D+9.5
Not yet ingested
- Civics
- —
Market trends
- HPI YoY
- ▲ 72.71%
- Current HPI
- 507.739
- Rent YoY
- —
- Metro
- nan
- State GDP YoY
- ▲ 2.60%
- F500 in state
- 92
Industry mix (Fortune 500 HQ in NY)
| Industry | F500 HQs | Revenue |
|---|---|---|
| Financial Services | 10 | $950B |
|
||
| Consumer Goods | 9 | $162B |
|
||
| Insurance | 4 | $225B |
|
||
| Telecommunications | 2 | $144B |
|
||
| Pharmaceuticals | 2 | $112B |
|
||
| Media / Entertainment | 2 | $69B |
|
||
Price history
+83.3% since first listed7 events — show timeline
- 2026-06-15 Listed $220,000 OneKey® MLS as Distributed by MLS Grid
- 2026-05-01 Listing Removed — OneKey® MLS as Distributed by MLS Grid
- 2026-02-20 Price Changed $216,500 OneKey® MLS as Distributed by MLS Grid
- 2026-01-13 Price Changed $227,525 OneKey® MLS as Distributed by MLS Grid
- 2025-12-11 Price Changed $239,500 OneKey® MLS as Distributed by MLS Grid
- 2025-10-30 Listed $250,000 OneKey® MLS as Distributed by MLS Grid
- 2009-10-23 Sold (Public Records) $120,000 Public Records
Property tax history
+15.9%/yrLatest (2025): $15,191 · +333.8% YoY. Source: county tax records.
Cash-flow waterfall
monthlySold comps — $/sqft
last 12 mo · ≤1 miLoading sold comps…