814 W Broadway St · Henryetta, OK
Flood risk 1/10 · Minimal
- FEMA flood zone
- X (unshaded)
- Chance of flooding over 30 yrs
- 0.0%
- Est. flood insurance / yr
- $507 – $1,088
Fire risk 8/10 · Major
- Est. fire insurance / yr
- $2,463 – $4,575
Heat risk 6/10 · Moderate
- Hot days now (above 111°F)
- 7 days/yr
- Hot days in 30 yrs
- 20 days/yr
Wind risk 3/10 · Minor
- Chance of severe wind over 30 yrs
- 5.0%
Air-quality risk 2/10 · Minimal
- Unhealthy air days now
- 1 days/yr
- Unhealthy air days in 30 yrs
- 3 days/yr
Risk factors via First Street. Map © Google.
Why this score? — see what drove the B+ grade
The composite is a weighted blend of 9 inputs, each scored 0–100. Each bar is that input's sub-score; the figure is the points it added to the 100-point composite (weight × sub-score).
- Cash flow +30.0/30.0
- 1% rule +10.0/10.0
- DSCR +10.0/10.0
- Appreciation +10.0/10.0
- ARV discount +7.5/15.0
- Livability +2.7/5.0
- Rent growth +2.5/5.0
- Condition / age +2.5/5.0
- Schools +1.2/10.0
$57,500
🖨 Deal sheet (PDF) 📄 Offer letter ✓ Due diligence
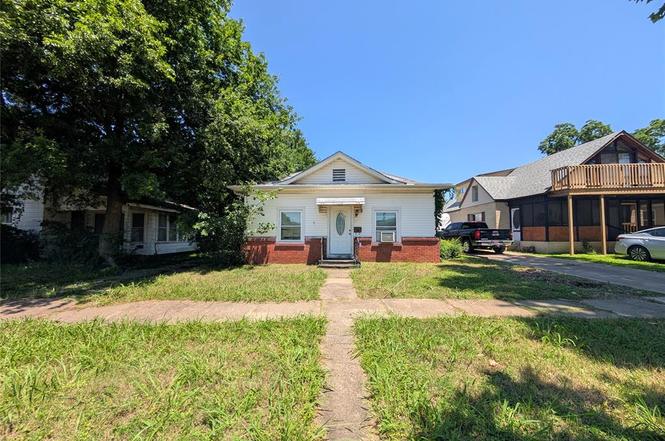
Listing remarks
Attention flippers — this one's got the bones and the numbers to work. This 3-bed, 1.5-bath home in Henryetta needs a full rehab, which is exactly where the opportunity lives. At 1,551 sq ft, there's plenty of room to create a product that commands top dollar in this market. Estimated ARV: $140,000–$175,000 for a clean, market-ready renovation based on in-town comps of similar size. A premium finish could push toward the higher end. The Henryetta market is trending up — median sold price hit $165,000 in May 2025. Seller is motivated and looking for a quick close. Bring your offers.
Key facts
- 7,000 sq ft lot
- Built 1930
- Listed 5 days
Property features AI
Finance
- Other: Homestead: Yes
- Financial info: Assumable: No; Loan qualification: Unknown; Occupancy: Vacant
- HOA & community: No mandatory association dues
Exterior
- Parking: Concrete parking
- Utilities: Public utilities
- Home design: Single family residence; One level; Faces south; Residential property
- Construction: Brick and frame construction; Vinyl siding; Shingle roof; Slab foundation; Property listed as dilapidated; Built before or by assessor-recorded living area
- Exterior features: No exterior features listed; Infill lot
Interior
- Bedrooms: 3 bedrooms
- Bathrooms: 1 full bath; 1 half bath
- Heating & cooling: Window unit(s) for cooling
- Interior features: Two living areas; No fireplace
Neighborhood map
What this means for you Summary
Snapshot
- This is a 2-bed/1.0-bath single-family listed at $58k.
Deal economics
- At list price, monthly cash flow is $482 ($6k/yr) — positive.
- The deal already cash-flows at list — no discount required.
- Meets the 1% rule at list price ($1k rent vs $58k).
- Cap rate 16.3% vs local median 4.0% in Henryetta — top-decile yield for the area; either an underpriced asset or a hidden risk that comps aren't pricing in. Stress-test before assuming the spread holds.
Location & tenants
- Location reads 54/100 on livability (#589 in OK) — a working-class tenant base; expect higher turnover. Strengths: cost of living A+, housing A+; Watch: amenities F, commute F, employment F.
- Henryetta (town): math 11% / reading 19% proficiency, ranked #228 of 270 in OK (top 84%) — low school quality limits family demand, transient renter base, plan for 1-2y turnover; 65% free/reduced lunch — lower-income household profile, screen leases tightly.
- Zoned schools: Henryetta Es (math 13% / reading 19%, grade F, #582 of 845 statewide, top 69%, 529 students, 0% FRL); Henryetta Ms (math 7% / reading 20%, grade F, #252 of 345 statewide, top 74%, 242 students, 0% FRL); Henryetta Hs (math 12% / reading 22%, grade F, #314 of 447 statewide, top 72%, 301 students, 0% FRL) — zoned schools average 0% FRL vs 65% district-wide (65 pts lower); this property's tenant base skews higher-income than the district average.
- Market conditions: 90 active listings in the ZIP; 12 units permitted in Okmulgee County in 2024 (0 in 5+ unit buildings).
Forward outlook
- In year one you build about $6k of equity ($398 loan paydown + $6k appreciation (10.0% local appreciation)).
- Okmulgee County population projected at -13% by 2050 — secular population decline; favor cash flow + early exit over multi-decade hold.
- At projected returns (10.0% appreciation + 3.0% rent growth), your $16k cash investment doubles in ~2 years — after that, you're playing with house money.
- By year 6, paydown + projected appreciation supports a ~$36k cash-out refi (75% LTV) — recoverable capital for the next deal without selling this one.
Negotiation context
- Only 6 days on market — expect competitive offers; lowballing is unlikely to land.
Risks & watch-outs
- Watch-outs: built in 1930 — expect roof / HVAC / electrical / plumbing capex.
- Climate carrying-cost: severe wildfire risk; extreme-heat days projected 7→20/yr by 2055 (HVAC capex compounding) — expect insurance premiums to compound above CPI over the hold.
Questions for the listing agent
- Built in 1930 — when were the roof, HVAC, electrical panel, plumbing, and water heater last replaced?
- Is there a deadline driving the sale (1031 exchange, divorce, estate, relocation)? That informs how much negotiation room exists.
- Schools are F-rated, which usually means shorter tenancies and higher turnover. Who's the typical renter profile here, and what's been the actual vacancy rate?
- What's the average days-on-market for RENTAL listings here right now (not sales)? A rising rental-DOM trend means longer vacancies and softer asking-rent achievability than the comps imply.
- What's the recent tenant-quality profile in this submarket — average credit score on applications, eviction rate, late-payment / NSF rate, and stable-employment percentage? A property-management company in the area should have these aggregated.
- How much new for-sale + rental construction is in the pipeline within 1–3 miles? Heavy new supply typically softens prices + rents 12–24 months out; constrained supply supports both.
Investment metrics
- 1% rule
- 1.84% ✓
- Cap rate
- 16.35%
- Cash-on-cash
- 35.90%
- DSCR
- 2.60
- GRM
- 4.5
CMA / ARV
- ARV (on-the-fly)
- $144,243
- Comps found
- 12
Show comp detail 12 sales within ~0.75 mi
| Address | Dist | Beds/Ba | Sqft | Sold | Price | $/sf | Match |
|---|---|---|---|---|---|---|---|
| 805 W Gentry St | 0.26mi | 3/1.0 (+1) | 1,470 (-5%) | 7mo | $65,000 | $44 | 69 |
| 307 N 3rd St | 0.45mi | 3/1.0 (+1) | 1,630 (+5%) | 13mo | $40,000 | $25 | 54 |
| 810 W Gentry St | 0.29mi | 3/1.5 (+1) | 1,344 (-13%) | 7mo | $45,000 | $33 | 52 |
| 507 W Gentry St | 0.34mi | 3/2.0 (+1) | 1,616 (+4%) | 22mo | $125,000 | $77 | 50 |
| 301 W Cummings St | 0.51mi | 3/2.0 (+1) | 1,680 (+8%) | 6mo | $55,000 | $33 | 48 |
| 1218 Wade Wells Dr | 0.65mi | 3/2.0 (+1) | 1,408 (-9%) | 1mo | $185,000 | $131 | 45 |
| 612 W Gentry St | 0.32mi | 3/2.0 (+1) | 1,368 (-12%) | 15mo | $117,000 | $86 | 44 |
| 1018 W Merrick St | 0.47mi | 3/2.0 (+1) | 1,392 (-10%) | 9mo | $160,000 | $115 | 44 |
| 710 N 14th St | 0.65mi | 3/2.0 (+1) | 1,644 (+6%) | 9mo | $185,000 | $113 | 44 |
| 1110 W Merrick St | 0.51mi | 3/2.0 (+1) | 1,470 (-5%) | 19mo | $155,000 | $105 | 43 |
| 1210 Wade Wells Dr | 0.62mi | 3/2.0 (+1) | 1,512 (-2%) | 21mo | $175,000 | $116 | 40 |
| 706 W Merrick St | 0.45mi | 3/2.0 (+1) | 1,340 (-14%) | 13mo | $125,000 | $93 | 36 |
Match score weights: distance 35% · size 25% · config 20% · recency 20%. Top-matched comps best support the ARV.
Projected returns pro-forma
10.0% appreciation · 3.0% rent growth · sell at horizon
- IRR
- 51.8%
- Equity multiple
- 4.85×
- Total profit
- $61,983
- Equity at exit
- $51,801
- IRR
- 45.5%
- Equity multiple
- 10.84×
- Total profit
- $158,384
- Equity at exit
- $111,710
Cash invested: $16,100 (down + closing). Projections, not guarantees.
Landlord ↔ Tenant lean methodology
- Overall (STATE)
- 83 Strongly Landlord-Friendly
- State Oklahoma
- 83 Strongly Landlord-Friendly · R+20
- County
- — inherits STATE
- City
- — inherits STATE
ZIP-level market 74437
- Home prices YoY
- 23.4%
- Active inventory
- 90
- Price-to-rent
- 4.5×
Monthly cashflow live
- Estimated rent
- $1,058 medium interval (Pro) →
- Mortgage (P&I)
- −$302
- Tax from tax record
- −$28 /mo · $342/yr
- Insurance
- −$24
- HOA
- −$0
- Vacancy / Maint / Mgmt
- −$222
- Net cashflow
- $482
Break-even live
Sensitivity live
| Price | -10% $514 | -5% $498 | +0% $482 | +5% $465 | +10% $449 |
|---|---|---|---|---|---|
| Rent | -10% $398 | -5% $440 | +0% $482 | +5% $523 | +10% $565 |
| Rate | -1.0pp $511 | -0.5pp $496 | base $482 | +0.5pp $467 | +1.0pp $452 |
UW: 25.0% down · 7.5% · 30yr · 1.5% tax · 5.0% vac · 8.0% maint · 8.0% mgmt
Financing live
Cash to close
- Down payment
- $14,375
- Closing costs
- $1,725
- Reserves months
- —
- Total cash needed
- —
Loan-product check · same deal, 3 products live
Conventional
25% down · 7.5% · 30yr
- Down + closing
- —
- Monthly P&I
- —
- Monthly cashflow
- —
- DSCR
- —
- Eligible?
- —
Personal DTI + credit; lowest rate.
DSCR
20% down · 8.5% · 30yr
- Down + closing
- —
- Monthly P&I
- —
- Monthly cashflow
- —
- DSCR
- —
- Eligible?
- —
No personal income docs; deal must DSCR.
Hard money
10% down · 12.0% · 12mo
- Down + closing
- —
- Monthly P&I
- —
- Monthly cashflow
- —
- DSCR
- —
- Eligible?
- —
Short-term bridge; refi at stabilization.
Listing history 7 events
-
2026-06-21days on market $57,500 Active 6 DOM
-
2026-06-21days on market $57,500 Active 5 DOM
-
2026-06-18days on market $57,500 Active 3 DOM
-
2026-06-17days on market $57,500 Active 2 DOM
-
2026-06-17price $57,500 Active 1 DOM
-
2026-06-16remarks 589-char remark
-
2026-06-16$75,000 Active 1 DOM
ⓘ Source: listings_history table (triggers on properties + properties_extension) + one-shot
backfill from property_details.listing_events for pre-trigger history.
Tax reassessment forecast OK · Resets to sale price
- Current annual tax
- $342 · $28/mo
- Projected year-2 tax
- $518 · $43/mo
- Expected delta
- +$176/yr (+$15/mo · 51.3%)
ⓘ Screening estimate from a state-policy table — verify with the county assessor before closing.
Climate risk First Street
- Flood 1/10 Low FEMA zone X (unshaded) · 0% chance over 30 yrs
- Wildfire 8/10 Severe
- Heat 6/10 Major 7 d/yr ≥111°F today · 20 d/yr by 30 yrs out
- Wind 3/10 Moderate 5% chance of damaging wind over 30 yrs
- Air quality 2/10 Low 1 unhealthy d/yr today · 3 by 30 yrs out
Nearby sold comps map
Loading sold comps map…
Walkable amenities ~0.75 mi
Loading nearby amenities…
Taxation est. · year 1
- Rental income
- $12,694
- − Mortgage interest
- −$3,221
- − Property taxes
- −$342
- − Insurance
- −$288
- − Repairs & maintenance
- −$1,015
- − Management
- −$1,015
- − Depreciation
- −$1,673
- Taxable income
- $5,140
- Est. tax owed @ 24.0%
- −$1,233
- After-tax cash flow
- $4,547/yr
For passive investors: Depreciation is non-cash, so a rental often shows a tax loss while cash-flowing — sheltering income. Rental losses are passive: they offset passive income freely, and up to $25,000/yr can offset ordinary (W-2) income if you actively participate and your MAGI is under $100k (phasing out to $0 by $150k); unused losses carry forward. On sale, claimed depreciation is recaptured at up to 25%, and gains may owe capital-gains tax (a 1031 exchange can defer both). Figures are a year-1 estimate at your 24.0% rate — not tax advice; consult a CPA.
Schools (NCES district)
- District
- Henryetta
- NCES district ID
- 4014370
- Math proficiency
- 11% ▼ -15.00%
- Reading proficiency
- 19% ▼ -7.00%
- Median HH income
- $37,050
- Composite
- 12.5/100
- National rank
- #9624
- State rank
- #228 of 270 in OK
Livability — Henryetta
- Score
- 54/100
- State rank
- #589
- US rank
- #24020
Category grades
Schools grade is shown separately in the Schools card above.
Census & demographics
- Census place
- Henryetta, OK
- Population (ZIP)
- 9,058
Population outlook (Okmulgee County) Hauer SSP2
- Today (2025)
- 37,543 people
- By 2030
- 36,528 · -2.7%
- By 2040
- 34,430 · -8.3%
- By 2050
- 32,498 · -13.4%
- By 2075
- 28,814 · -23.3%
- By 2100
- 25,193 · -32.9%
Race, ethnicity, and origin ACS 2023
- Neighborhood character
- Diverse neighborhood (Simpson 0.60)
- Race & ethnicity
- White 63% Native American 18% Two or more races 14% Hispanic / Latino 6% Black 2%
- Hispanic origin (detail)
- Mexican 5%
- Common ancestry
- Lithuanian 2% Slovak 1% Italian 1%
- Foreign-born
- 0% · Canada
- Languages at home
- 97% English-only · Spanish 1%
Political lean MEDSL · Okmulgee
- 2024 margin
- Solid R (+42.7) · D 27.7% · R 70.4% · Other 1.9%
- 2008→2024 swing
- -25.7pp toward R · 2008: -17.0pp · 2024: -42.7pp
- All cycles
- 2024: R+42.7 2020: R+37.1 2016: R+32.7 2012: R+17.5 2008: R+17.0
Not yet ingested
- Civics
- —
Market trends
- HPI YoY
- ▲ 52.61%
- Current HPI
- 277.6291
- Rent YoY
- —
- Metro
- —
- State GDP YoY
- ▲ 1.55%
- F500 in state
- 6
Industry mix (Fortune 500 HQ in OK)
| Industry | F500 HQs | Revenue |
|---|---|---|
| Energy | 3 | $48B |
|
||
Price history
+150.0% since first listed4 events — show timeline
- 2026-06-15 Listed $75,000 MLSOK
- 2007-03-21 Sold (Public Records) $60,000 Public Records
- 2003-10-30 Sold (Public Records) $42,000 Public Records
- 1997-05-12 Sold (Public Records) $30,000 Public Records
Property tax history
-3.3%/yrLatest (2025): $342 · +11.8% YoY. Source: county tax records.
Cash-flow waterfall
monthlySold comps — $/sqft
last 12 mo · ≤1 miLoading sold comps…