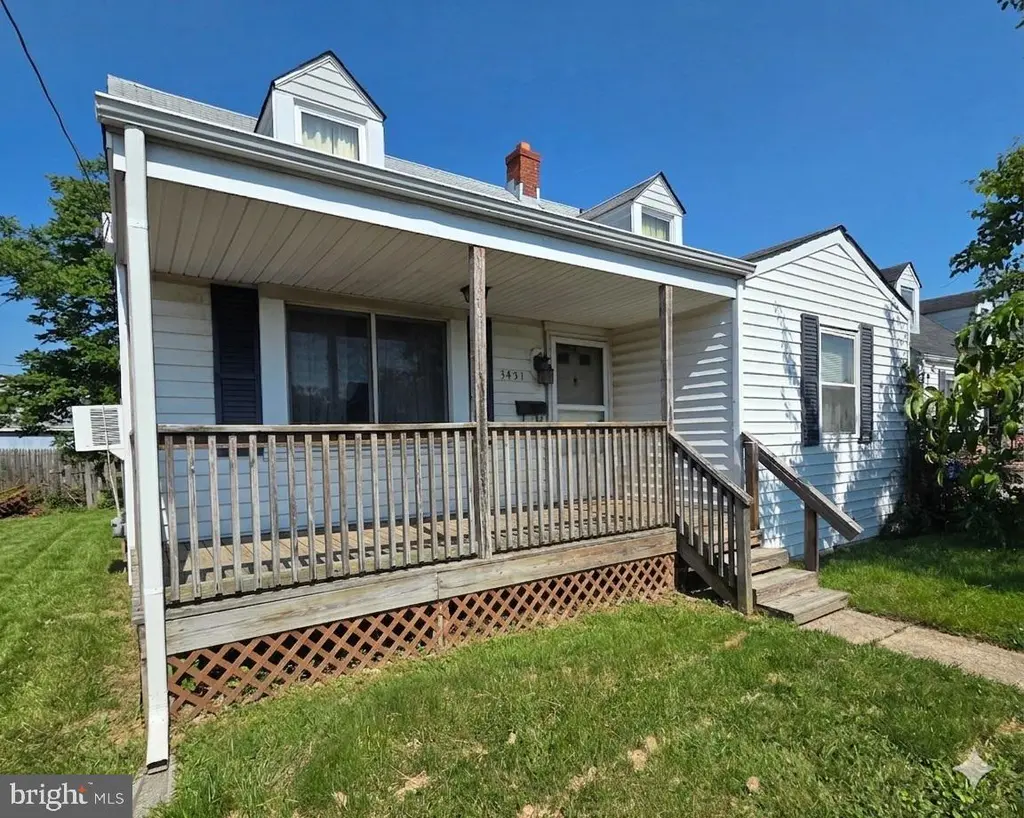
3451 Yardley Dr · Dundalk, MD
Flood risk 5/10 · Moderate
- FEMA flood zone
- X (unshaded)
- Chance of flooding over 30 yrs
- 0.52%
- Est. flood insurance / yr
- $473 – $860
Fire risk 1/10 · Minimal
- Est. fire insurance / yr
- $755 – $1,403
Heat risk 8/10 · Major
- Hot days now (above 103°F)
- 7 days/yr
- Hot days in 30 yrs
- 15 days/yr
Wind risk 6/10 · Moderate
- Chance of severe wind over 30 yrs
- 57.0%
Air-quality risk 5/10 · Moderate
- Unhealthy air days now
- 6 days/yr
- Unhealthy air days in 30 yrs
- 8 days/yr
Risk factors via First Street. Map © Google.
Why this score? — see what drove the B- grade
The composite is a weighted blend of 9 inputs, each scored 0–100. Each bar is that input's sub-score; the figure is the points it added to the 100-point composite (weight × sub-score).
- Cash flow +25.0/30.0
- ARV discount +15.0/15.0
- DSCR +8.2/10.0
- 1% rule +6.5/10.0
- Livability +4.2/5.0
- Rent growth +2.5/5.0
- Condition / age +2.5/5.0
- Schools +2.3/10.0
- Appreciation +0.0/10.0
$169,900
🖨 Deal sheet (PDF) 📄 Offer letter ✓ Due diligence
Listing remarks
Fantastic opportunity to own a single-family home at an apartment price with plenty of potential for both homeowners and investors alike. The first floor features a living room with tons of natural light, a spacious bedroom, a full bath, and an updated kitchen with a stainless steel refrigerator, a gas stove, updated cabinetry, and an eat-in kitchenette area. A second room currently serves as a walk-through to the backyard and works well as a home office, guest room, or potential second bedroom. The home also features wood paneling throughout and possibly original hardwood floors beneath portions of the flooring. Upstairs offers an additional living area with two potential bedrooms, a windo
Key facts
- 6,325 sq ft lot
- 2 parking spots
- Built 1950
Property features AI
Exterior
- Parking: Asphalt driveway with 2 driveway spaces (total 2 garage/parking spaces)
- Utilities: Public water; Public sewer; Natural gas hot water; Electric heating and cooling
- Home design: Detached home; Main entrance faces west
- Construction: Combination construction materials; Block foundation; Shingle roof; Built according to assessor records
- Exterior features: Picket fencing; Shed
Interior
- Kitchen: Built-in microwave; Dishwasher; Gas range/oven; Refrigerator
- Bedrooms: One bedroom on the main level; Two bedrooms on the upper level
- Flooring: Carpet; Vinyl; Hardwood
- Bathrooms: One full bathroom (main level)
- Heating & cooling: Forced air heating (electric); Central air conditioning; Ceiling fan(s); Window unit(s)
- Interior features: Drywall, plaster and paneled walls; Living room, kitchen and den; Full, unfinished basement with interior access, rear entrance, workshop area and sump pump; Basement suitable for finished rooms
- Laundry & utility: Washer; Electric dryer; Basement laundry
Neighborhood map
What this means for you Summary
Snapshot
- This is a 3-bed/1.0-bath single-family listed at $170k.
Deal economics
- At list price, monthly cash flow is $371 ($4k/yr) — positive.
- The deal already cash-flows at list — no discount required.
- Meets the 1% rule at list price ($2k rent vs $170k).
- Cap rate 8.9% vs local median 6.2% in Dundalk — top-decile yield for the area; either an underpriced asset or a hidden risk that comps aren't pricing in. Stress-test before assuming the spread holds.
Location & tenants
- Location reads 85/100 on livability (#16 in MD, #510 nationally) — a professional / high-income tenant draw. Strengths: amenities A+, commute A+, housing A+; Watch: crime F.
- Baltimore County Public Schools (suburban): math 15% / reading 34% proficiency, ranked #11 of 24 in MD (top 46%) — low school quality limits family demand, transient renter base, plan for 1-2y turnover.
- Market conditions: Rents soft (-0.1%/yr); 236 active listings in the ZIP; 30 comparable units currently listed for rent nearby; rentals at typical pace (median 17d on market — plan ~3-4 weeks tenant-placement turnaround); 40% of comp listings sitting > 30 days — soft ceiling on asking rent; 1,511 units permitted in Baltimore County in 2024 (643 in 5+ unit buildings).
- This rent runs 37% of the median local income ($64k/yr) — at the standard rent-burdened threshold; future hikes will face affordability resistance.
Forward outlook
- Local home prices are declining (-3.0%/yr); year-one equity from $1k of loan paydown is wiped out by about $5k of value loss. Plan a longer hold.
- Baltimore County population projected at +12% by 2050 — modest demand growth; plan on rents tracking national, not racing it.
Negotiation context
- Only 7 days on market — expect competitive offers; lowballing is unlikely to land.
Risks & watch-outs
- Watch-outs: built in 1950 — expect roof / HVAC / electrical / plumbing capex.
- Climate carrying-cost: moderate flood risk; major wind risk, 57% chance of damaging wind over 30y; extreme-heat days projected 7→15/yr by 2055 (HVAC capex compounding) — expect insurance premiums to compound above CPI over the hold.
Questions for the listing agent
- Built in 1950 — when were the roof, HVAC, electrical panel, plumbing, and water heater last replaced?
- Is there a deadline driving the sale (1031 exchange, divorce, estate, relocation)? That informs how much negotiation room exists.
- Schools are A-rated — typically a magnet for longer-tenancy family renters. What's the average tenant stay here, and is there a school-zone premium baked into asking?
- Crime grade is F in this area — have there been break-ins, vandalism, or insurance claims at this property in the last 3 years? What carrier currently insures it and at what premium?
- What's the average days-on-market for RENTAL listings here right now (not sales)? A rising rental-DOM trend means longer vacancies and softer asking-rent achievability than the comps imply.
- What's the recent tenant-quality profile in this submarket — average credit score on applications, eviction rate, late-payment / NSF rate, and stable-employment percentage? A property-management company in the area should have these aggregated.
- How much new for-sale + rental construction is in the pipeline within 1–3 miles? Heavy new supply typically softens prices + rents 12–24 months out; constrained supply supports both.
Investment metrics
- 1% rule
- 1.15% ✓
- Cap rate
- 8.91%
- Cash-on-cash
- 9.36%
- DSCR
- 1.42
- GRM
- 7.2
CMA / ARV
- ARV (on-the-fly)
- $298,890
- Comps found
- 12
Show comp detail 12 sales within ~0.75 mi
| Address | Dist | Beds/Ba | Sqft | Sold | Price | $/sf | Match |
|---|---|---|---|---|---|---|---|
| 3413 Louth Rd | 0.30mi | 3/1.5 | 1,170 (-4%) | 1mo | $320,000 | $274 | 77 |
| 3526 Loganview Dr | 0.09mi | 3/2.0 | 1,125 (-7%) | 9mo | $295,000 | $262 | 72 |
| 3456 Loganview Dr | 0.20mi | 3/1.0 | 1,125 (-7%) | 11mo | $250,500 | $223 | 69 |
| 8209 Longpoint Rd | 0.59mi | 3/1.0 | 1,197 (-2%) | 2mo | $290,000 | $242 | 68 |
| 3408 Louth Rd | 0.29mi | 4/2.0 (+1) | 1,232 (+1%) | 9mo | $255,000 | $207 | 68 |
| 8108 Dundalk Ave | 0.40mi | 3/1.0 | 1,313 (+8%) | 2mo | $220,000 | $168 | 66 |
| 3406 Louth Rd | 0.30mi | 4/1.0 (+1) | 1,150 (-5%) | 9mo | $289,000 | $251 | 65 |
| 7400 Belclare Rd | 0.38mi | 4/2.0 (+1) | 1,280 (+5%) | 1mo | $315,000 | $246 | 64 |
| 3004 Dunmurry Rd | 0.65mi | 3/1.5 | 1,144 (-6%) | 6mo | $290,000 | $253 | 53 |
| 419 New Pittsburg Ave | 0.60mi | 4/2.0 (+1) | 1,275 (+5%) | 5mo | $188,100 | $148 | 50 |
| 6806 Dunhill Rd | 0.62mi | 3/2.0 | 1,144 (-6%) | 10mo | $286,000 | $250 | 49 |
| 3142 Yorkway | 0.41mi | 4/1.5 (+1) | 1,088 (-10%) | 11mo | $255,000 | $234 | 48 |
Match score weights: distance 35% · size 25% · config 20% · recency 20%. Top-matched comps best support the ARV.
Projected returns pro-forma
-3.0% appreciation · 0.0% rent growth · sell at horizon
- IRR
- -5.6%
- Equity multiple
- 0.80×
- Total profit
- $-9,609
- Equity at exit
- $25,333
- IRR
- 0.0%
- Equity multiple
- 1.00×
- Total profit
- $4
- Equity at exit
- $14,690
Cash invested: $47,572 (down + closing). Projections, not guarantees.
Landlord ↔ Tenant lean methodology
- Overall (STATE)
- 27 Tenant-Leaning
- State Maryland
- 27 Tenant-Leaning · D+14
- County
- — inherits STATE
- City
- — inherits STATE
ZIP-level market 21222
- Rents YoY
- -0.1%
- Active inventory
- 236
- Price-to-rent
- 7.2×
Monthly cashflow live
- Estimated rent
- $1,959 high interval (Pro) →
- Mortgage (P&I)
- −$891
- Tax from tax record
- −$215 /mo · $2,574/yr
- Insurance
- −$71
- HOA
- −$0
- Vacancy / Maint / Mgmt
- −$411
- Net cashflow
- $371
Break-even live
Sensitivity live
| Price | -10% $467 | -5% $419 | +0% $371 | +5% $323 | +10% $275 |
|---|---|---|---|---|---|
| Rent | -10% $216 | -5% $294 | +0% $371 | +5% $448 | +10% $526 |
| Rate | -1.0pp $457 | -0.5pp $414 | base $371 | +0.5pp $327 | +1.0pp $282 |
UW: 25.0% down · 7.5% · 30yr · 1.5% tax · 5.0% vac · 8.0% maint · 8.0% mgmt
Financing live
Cash to close
- Down payment
- $42,475
- Closing costs
- $5,097
- Reserves months
- —
- Total cash needed
- —
Loan-product check · same deal, 3 products live
Conventional
25% down · 7.5% · 30yr
- Down + closing
- —
- Monthly P&I
- —
- Monthly cashflow
- —
- DSCR
- —
- Eligible?
- —
Personal DTI + credit; lowest rate.
DSCR
20% down · 8.5% · 30yr
- Down + closing
- —
- Monthly P&I
- —
- Monthly cashflow
- —
- DSCR
- —
- Eligible?
- —
No personal income docs; deal must DSCR.
Hard money
10% down · 12.0% · 12mo
- Down + closing
- —
- Monthly P&I
- —
- Monthly cashflow
- —
- DSCR
- —
- Eligible?
- —
Short-term bridge; refi at stabilization.
Rent comps 30 comps
| Address | Beds | Baths | Sqft | Rent | $/sqft | DOM | Units | Dist |
|---|---|---|---|---|---|---|---|---|
| 3503 Sollers Point Rd Dundalk, MD | 3.0 | 1.0 | 776 | $1,850 | $2.38 | 13d | 1 | 0.16mi |
| 3413 Yardley Dr Dundalk, MD | 4.0 | 2.0 | 1185 | $2,400 | $2.03 | 44d | 1 | 0.19mi |
| 108 Chestnut St Dundalk, MD | 2.0 | 1.0 | 812 | $1,300 | $1.60 | 16d | 1 | 0.21mi |
| 3481 McShane Way Dundalk, MD | 2.0 | 1.5 | 896 | $2,150 | $2.40 | 44d | 1 | 0.26mi |
| 7718 Meath Rd Dundalk, MD | 3.0 | 2.0 | 864 | $2,200 | $2.55 | 44d | 1 | 0.27mi |
| 3443 Dunhaven Rd Dundalk, MD | 2.0 | 2.0 | 1016 | $1,900 | $1.87 | 5d | 1 | 0.34mi |
| 217 Center St Dundalk, MD | 3.0 | 1.5 | 1280 | $1,575 | $1.23 | 5d | 1 | 0.43mi |
| 214 Center St Dundalk, MD | 3.0 | 1.5 | 992 | $1,795 | $1.81 | 11d | 1 | 0.45mi |
| 511 Avondale Rd Dundalk, MD | 2.0–4.0 | 1.0–2.0 | 1146 | $1,735 | $1.51 | 2d | 69 | 0.55mi |
| 8220 Cornwall Rd Dundalk, MD | 3.0 | 2.0 | 1125 | $1,775 | $1.58 | 44d | 1 | 0.65mi |
| 2976 Cornwall Rd Unit 1 Dundalk, MD | 2.0 | 1.0 | 900 | $1,590 | $1.77 | 15d | 1 | 0.65mi |
| 2959 Liberty Pkwy Dundalk, MD | 3.0 | 2.0 | 1479 | $2,150 | $1.45 | 44d | 1 | 0.68mi |
| 8252 Longpoint Rd Dundalk, MD | 4.0 | 2.0 | 1216 | $1,950 | $1.60 | 4d | 1 | 0.78mi |
| 8252 Longpoint Rd Dundalk, MD | 4.0 | 2.0 | 1216 | $2,050 | $1.69 | 16d | 1 | 0.78mi |
| 7003 Dunmanway Dundalk, MD | 1.0–2.0 | 1.0 | 772 | $1,345 | $1.74 | 2d | 13 | 0.82mi |
| 2624 Liberty Pkwy Dundalk, MD | 3.0 | 1.5 | 1110 | $1,856 | $1.67 | 44d | 1 | 1.07mi |
| 12 Leeway Dundalk, MD | 3.0 | 1.0 | 1358 | $1,750 | $1.29 | 44d | 1 | 1.11mi |
| 1915 Merritt Blvd Dundalk, MD | 3.0 | 2.0 | 1208 | $2,500 | $2.07 | 44d | 1 | 1.13mi |
| 6545 Baltimore Ave Dundalk, MD | 2.0 | 1.0 | 852 | $1,500 | $1.76 | 44d | 1 | 1.27mi |
| 6537 Baltimore Ave Baltimore, MD | 3.0 | 1.0 | 1272 | $1,700 | $1.34 | 2d | 1 | 1.29mi |
| 7901 Stratman Rd Dundalk, MD | 3.0 | 1.0 | 890 | $1,647 | $1.85 | 2d | 1 | 1.29mi |
| 266 Saint Helena Ave Dundalk, MD | 3.0 | 1.0 | 1305 | $1,900 | $1.46 | 13d | 1 | 1.33mi |
| 6552 Parnell Ave Dundalk, MD | 2.0 | 1.5 | 885 | $1,500 | $1.69 | 18d | 1 | 1.33mi |
| 2020 Dineen Dr Dundalk, MD | 3.0 | 1.5 | 1258 | $1,850 | $1.47 | 5d | 1 | 1.36mi |
| 2032 Kelmore Rd Dundalk, MD | 3.0 | 1.0 | 1024 | $1,700 | $1.66 | 44d | 1 | 1.39mi |
| 2025 Kelmore Rd Unit 1 Dundalk, MD | 3.0 | 1.0 | 1024 | $2,000 | $1.95 | 44d | 1 | 1.42mi |
| 8499 Lynch Rd Dundalk, MD | 1.0–3.0 | 1.0–2.0 | 950 | $2,202 | $2.32 | 2d | 32 | 1.43mi |
| 2004 Larkhall Rd Dundalk, MD | 3.0 | 1.0 | 1024 | $1,500 | $1.46 | 44d | 1 | 1.45mi |
| 1930 Frames Rd Dundalk, MD | 3.0 | 2.0 | 1152 | $2,099 | $1.82 | 5d | 1 | 1.49mi |
| 1925 Jasmine Rd Dundalk, MD | 3.0 | 1.5 | 1024 | $1,825 | $1.78 | 11d | 1 | 1.49mi |
Listing history 2 events
-
2026-05-20$169,900 Active
-
2026-05-20historical $169,900
ⓘ Source: listings_history table (triggers on properties + properties_extension) + one-shot
backfill from property_details.listing_events for pre-trigger history.
Tax reassessment forecast MD · Partial reset (capped growth)
- Current annual tax
- $2,574 · $215/mo
- Projected year-2 tax
- $2,574 · $215/mo
- Expected delta
- $0/yr ($0/mo · 0.0%)
ⓘ Screening estimate from a state-policy table — verify with the county assessor before closing.
Climate risk First Street
- Flood 5/10 Major FEMA zone X (unshaded) · 52% chance over 30 yrs
- Wildfire 1/10 Low
- Heat 8/10 Severe 7 d/yr ≥103°F today · 15 d/yr by 30 yrs out
- Wind 6/10 Major 57% chance of damaging wind over 30 yrs
- Air quality 5/10 Major 6 unhealthy d/yr today · 8 by 30 yrs out
Nearby sold comps map
Loading sold comps map…
Walkable amenities ~0.75 mi
Loading nearby amenities…
Taxation est. · year 1
- Rental income
- $23,503
- − Mortgage interest
- −$9,517
- − Property taxes
- −$2,574
- − Insurance
- −$850
- − Repairs & maintenance
- −$1,880
- − Management
- −$1,880
- − Depreciation
- −$4,943
- Taxable income
- $1,860
- Est. tax owed @ 24.0%
- −$446
- After-tax cash flow
- $4,006/yr
For passive investors: Depreciation is non-cash, so a rental often shows a tax loss while cash-flowing — sheltering income. Rental losses are passive: they offset passive income freely, and up to $25,000/yr can offset ordinary (W-2) income if you actively participate and your MAGI is under $100k (phasing out to $0 by $150k); unused losses carry forward. On sale, claimed depreciation is recaptured at up to 25%, and gains may owe capital-gains tax (a 1031 exchange can defer both). Figures are a year-1 estimate at your 24.0% rate — not tax advice; consult a CPA.
Schools (NCES district)
- District
- Baltimore County Public Schools
- NCES district ID
- 2400120
- Math proficiency
- 15% ▼ -16.00%
- Reading proficiency
- 34% ▼ -5.00%
- Median HH income
- $66,746
- Composite
- 23.17/100
- National rank
- #7948
- State rank
- #11 of 24 in MD
Livability — Dundalk
- Score
- 85/100
- State rank
- #16
- US rank
- #510
Category grades
Schools grade is shown separately in the Schools card above.
Census & demographics
- Census place
- Dundalk, MD
- County
- Baltimore County · 769,527 people
- City population
- 59,407
- Metro
- Baltimore-Columbia-Towson, MD
- Population (ZIP)
- 59,407
- Household income
- $64,141
- Rent vs Own
- Severe rent burden
- 2566.0
Population outlook (Baltimore County) Hauer SSP2
- Today (2025)
- 885,518 people
- By 2030
- 909,272 · +2.7%
- By 2040
- 951,547 · +7.5%
- By 2050
- 990,955 · +11.9%
- By 2075
- 1,086,411 · +22.7%
- By 2100
- 1,135,078 · +28.2%
Race, ethnicity, and origin ACS 2023
- Neighborhood character
- Diverse neighborhood (Simpson 0.60)
- Race & ethnicity
- White 59% Black 18% Hispanic / Latino 15% Two or more races 7% Asian 2% Native American 1%
- Hispanic origin (detail)
- Mexican 3% Puerto Rican 2%
- Common ancestry
- Romanian 7% Lithuanian 1% Italian 1%
- Foreign-born
- 9% · Canada
- Languages at home
- 85% English-only · Spanish 11% Other Indo-European 2% Arabic 1%
Political lean MEDSL · Baltimore
- 2024 margin
- Strong D (+24.5) · D 61.0% · R 36.5% · Other 2.5%
- 2008→2024 swing
- +9.9pp toward D · 2008: 14.6pp · 2024: 24.5pp
- All cycles
- 2024: D+24.5 2020: D+27.0 2016: D+17.4 2012: D+16.4 2008: D+14.6
Not yet ingested
- Civics
- —
Market trends
- HPI YoY
- ▼ -251.44%
- Current HPI
- 228.4218
- Rent YoY
- ▼ -0.09%
- Metro
- Baltimore-Columbia-Towson, MD
- State GDP YoY
- ▲ 2.97%
- F500 in state
- 12
Industry mix (Fortune 500 HQ in MD)
| Industry | F500 HQs | Revenue |
|---|---|---|
| Aerospace / Defense | 1 | $71B |
|
||
| Utilities | 1 | $25B |
|
||
| Hotels | 1 | $24B |
|
||
| Consumer Goods | 1 | $7B |
|
||
| Real Estate | 1 | $6B |
|
||
| Chemicals | 1 | $2B |
|
||
Price history
+0.0% since first listed2 events — show timeline
- 2026-05-20 Listed $169,900 BRIGHT MLS
- 2026-05-20 Coming Soon $169,900 BRIGHT MLS
Property tax history
+2.4%/yrLatest (2025): $2,574 · +4.1% YoY. Source: county tax records.
Cash-flow waterfall
monthlySold comps — $/sqft
last 12 mo · ≤1 miLoading sold comps…