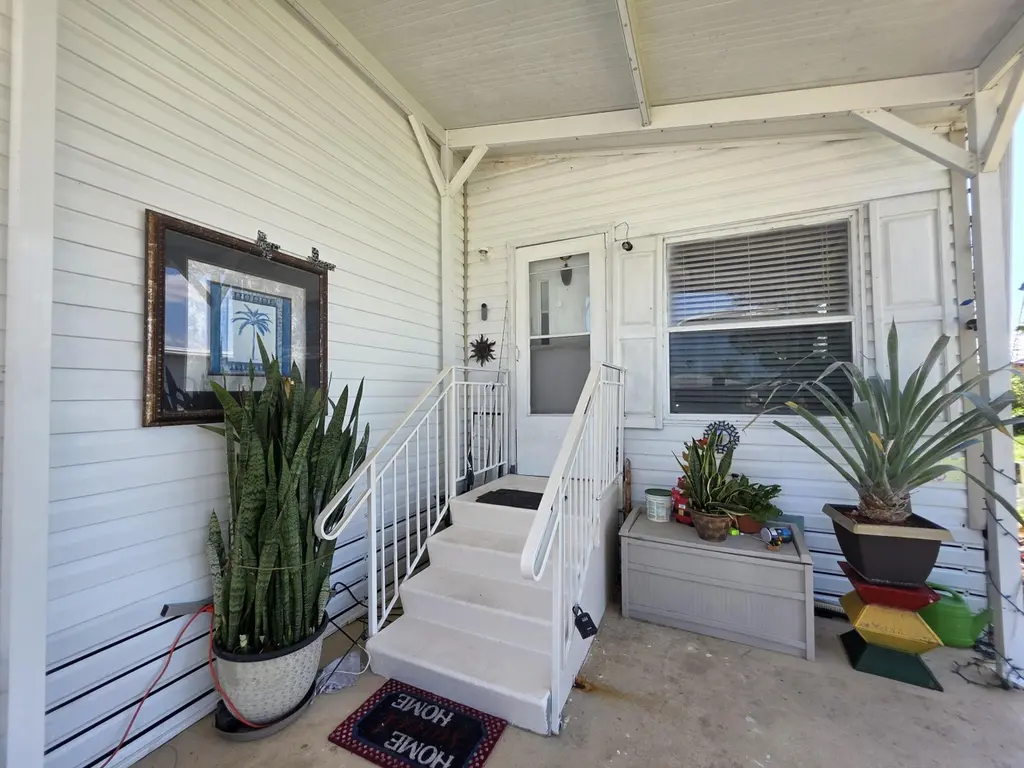
3 SE Kassaba Ln · Port St. Lucie, FL
Flood risk 1/10 · Minimal
- FEMA flood zone
- X (unshaded)
- Chance of flooding over 30 yrs
- 0.0%
- Est. flood insurance / yr
- $507 – $1,088
Fire risk 3/10 · Minor
- Est. fire insurance / yr
- $947 – $1,759
Heat risk 10/10 · Severe
- Hot days now (above 106°F)
- 7 days/yr
- Hot days in 30 yrs
- 22 days/yr
Wind risk 10/10 · Severe
- Chance of severe wind over 30 yrs
- 99.0%
Air-quality risk 2/10 · Minimal
- Unhealthy air days now
- 1 days/yr
- Unhealthy air days in 30 yrs
- 1 days/yr
Risk factors via First Street. Map © Google.
Why this score? — see what drove the B+ grade
The composite is a weighted blend of 9 inputs, each scored 0–100. Each bar is that input's sub-score; the figure is the points it added to the 100-point composite (weight × sub-score).
- Cash flow +30.0/30.0
- ARV discount +15.0/15.0
- 1% rule +10.0/10.0
- DSCR +10.0/10.0
- Schools +3.7/10.0
- Rent growth +3.0/5.0
- Livability +2.5/5.0
- Condition / age +2.2/5.0
- Appreciation +0.0/10.0
$90,000
🖨 Deal sheet 📄 Offer letter ✓ Due diligence
Key facts
- Move-in ready
- Fitness center
- Clubhouse
Tags
Property features AI
Finance
- Other: Lot includes fruit trees; Not waterfront
- Financial info: Land lease: Yes
- HOA & community: Senior community; Monthly land lease of $898 (land lease until 2099-05-31)
Exterior
- Parking: Attached carport; Carport with 2 covered spaces (2 carport spaces, 2 total parking)
- Security: Security patrol; Pets allowed (pet restrictions possible)
- Utilities: Public water; Public sewer; Three-phase electric; Sewer and water available
- Home design: Manufactured home; Single-story; Faces east; Resale condition
- Construction: Vinyl siding; Composition shingle roof; Aluminum skirt; Built area approximately 1,144 (owner reported)
- Exterior features: Open patio; Patio
Interior
- Kitchen: Electric range; Refrigerator; Electric water heater
- Bedrooms: 2 bedrooms on the main level
- Flooring: Carpet; Linoleum
- Bathrooms: 2 full bathrooms on the main level
- Heating & cooling: Heat pump heating; Central air conditioning
- Interior features: Cathedral ceilings; Vaulted ceilings; Split bedroom layout; Unfurnished
- Laundry & utility: Laundry closet; Laundry inside; Laundry outside
Neighborhood map
What this means for you Summary
Snapshot
- This is a 2-bed/2.0-bath manufactured listed at $90k. Condition is rated fair.
Deal economics
- At list price, monthly cash flow is $916 ($11k/yr) — positive.
- The deal already cash-flows at list — no discount required.
- Meets the 1% rule at list price ($2k rent vs $90k).
- Recommended offer: $87k (3.0% below list) — sets the bar for market timing.
- Cap rate 18.5% vs local median 3.9% in Port St. Lucie — top-decile yield for the area; either an underpriced asset or a hidden risk that comps aren't pricing in. Stress-test before assuming the spread holds.
Location & tenants
- Location reads: area grade B — affects rentability + tenant quality, not the cash-flow math above.
- St. Lucie (urban): math 40% / reading 48% proficiency, ranked #51 of 73 in FL (top 70%) — families likely to look elsewhere, expect single-tenant / working-renter base with shorter leases.
- Market conditions: Rents rising (+1.9%/yr); 639 active listings in the ZIP; 31 comparable units currently listed for rent nearby; rentals at typical pace (median 14d on market — plan ~3-4 weeks tenant-placement turnaround); 4,868 units permitted in St. Lucie County in 2024 (268 in 5+ unit buildings).
- This rent runs 38% of the median local income ($62k/yr) — at the standard rent-burdened threshold; future hikes will face affordability resistance.
Forward outlook
- Local home prices are declining (-3.0%/yr); year-one equity from $622 of loan paydown is wiped out by about $3k of value loss. Plan a longer hold.
- St. Lucie County population projected at +20% by 2050 — long-run rental-demand tailwind backs the buy-and-hold thesis.
- At projected returns (-3.0% appreciation + 1.9% rent growth), your $25k cash investment doubles in ~3 years — after that, you're playing with house money.
Negotiation context
- It's been on market 44 days — a 3% lower offer ($87k) is reasonable based on typical stale-listing flexibility.
- 5 sale attempts since 6y ago with the ask held roughly flat each time — persistent listings suggest the price (not the market) is what's stuck; bring a comps-based counter.
- Current owner paid $64k; 42% above their basis — modest negotiation headroom, anchor on the comps not their cost.
Risks & watch-outs
- Climate carrying-cost: severe wind risk, 99% chance of damaging wind over 30y; extreme-heat days projected 7→22/yr by 2055 (HVAC capex compounding) — expect insurance premiums to compound above CPI over the hold.
Questions for the listing agent
- It's been on market 44 days. Have you received any prior offers? Is the seller open to a 3% concession, seller financing, or rate buy-down credit?
- Have any recent inspections been done? Can we get a copy of the seller's disclosures and any deferred-maintenance estimates?
- Is there a deadline driving the sale (1031 exchange, divorce, estate, relocation)? That informs how much negotiation room exists.
- What's the average days-on-market for RENTAL listings here right now (not sales)? A rising rental-DOM trend means longer vacancies and softer asking-rent achievability than the comps imply.
- What's the recent tenant-quality profile in this submarket — average credit score on applications, eviction rate, late-payment / NSF rate, and stable-employment percentage? A property-management company in the area should have these aggregated.
- How much new for-sale + rental construction is in the pipeline within 1–3 miles? Heavy new supply typically softens prices + rents 12–24 months out; constrained supply supports both.
Investment metrics
- 1% rule
- 2.16% ✓
- Cap rate
- 18.50%
- Cash-on-cash
- 43.61%
- DSCR
- 2.94
- GRM
- 3.9
CMA / ARV
- ARV (on-the-fly)
- $161,304
- Comps found
- 7
Show comp detail 7 sales within ~0.75 mi
| Address | Dist | Beds/Ba | Sqft | Sold | Price | $/sf | Match |
|---|---|---|---|---|---|---|---|
| 7 Giralda | 0.33mi | 2/2.0 | 1,200 (+5%) | 4mo | $21,000 | $18 | 73 |
| 3316 Ironwood Ave | 0.74mi | 2/2.0 | 1,134 (-1%) | 10mo | $208,500 | $184 | 56 |
| 8506 Redbay Ct | 0.58mi | 2/2.0 | 1,036 (-9%) | 6mo | $193,000 | $186 | 52 |
| 10 Padre | 0.57mi | 2/2.0 | 1,280 (+12%) | 4mo | $38,000 | $30 | 51 |
| 8504 Gallberry Cir | 0.72mi | 2/2.0 | 1,264 (+10%) | 4mo | $178,000 | $141 | 46 |
| 8513 Redbay Ct | 0.56mi | 2/2.0 | 1,040 (-9%) | 21mo | $138,000 | $133 | 41 |
| 2960 Fiddlewood Cir | 0.69mi | 2/2.0 | 1,246 (+9%) | 22mo | $225,000 | $181 | 34 |
Match score weights: distance 35% · size 25% · config 20% · recency 20%. Top-matched comps best support the ARV.
Projected returns pro-forma
-3.0% appreciation · 1.92% rent growth · sell at horizon
- IRR
- 39.3%
- Equity multiple
- 2.65×
- Total profit
- $41,687
- Equity at exit
- $13,419
- IRR
- 45.2%
- Equity multiple
- 5.09×
- Total profit
- $103,130
- Equity at exit
- $7,782
Cash invested: $25,200 (down + closing). Projections, not guarantees.
Landlord ↔ Tenant lean methodology
- Overall (STATE)
- 87 Strongly Landlord-Friendly
- State Florida
- 87 Strongly Landlord-Friendly · R+3
- County
- — inherits STATE
- City
- — inherits STATE
ZIP-level market 34952
- Home prices YoY
- -29.6%
- Rents YoY
- 1.9%
- Active inventory
- 639
- Price-to-rent
- 3.9×
Monthly cashflow live
- Estimated rent
- $1,947 high interval (Pro) →
- Mortgage (P&I)
- −$472
- Tax est. 1.5%
- −$112 /mo · $1,350/yr
- Insurance
- −$38
- HOA
- −$0
- Vacancy / Maint / Mgmt
- −$409
- Net cashflow
- $916
Break-even live
UW: 25.0% down · 7.5% · 30yr · 1.5% tax · 5.0% vac · 8.0% maint · 8.0% mgmt
Financing live
Cash to close
- Down payment
- $22,500
- Closing costs
- $2,700
- Reserves months
- —
- Total cash needed
- —
Loan-product check · same deal, 3 products live
Conventional
25% down · 7.5% · 30yr
- Down + closing
- —
- Monthly P&I
- —
- Monthly cashflow
- —
- DSCR
- —
- Eligible?
- —
Personal DTI + credit; lowest rate.
DSCR
20% down · 8.5% · 30yr
- Down + closing
- —
- Monthly P&I
- —
- Monthly cashflow
- —
- DSCR
- —
- Eligible?
- —
No personal income docs; deal must DSCR.
Hard money
10% down · 12.0% · 12mo
- Down + closing
- —
- Monthly P&I
- —
- Monthly cashflow
- —
- DSCR
- —
- Eligible?
- —
Short-term bridge; refi at stabilization.
Rent comps 31 comps
| Address | Beds | Baths | Sqft | Rent | $/sqft | DOM | Units | Dist |
|---|---|---|---|---|---|---|---|---|
| 71 W Caribbean Port St. Lucie, FL | 2.0 | 2.0 | 1417 | $1,700 | $1.20 | 23d | 1 | 0.11mi |
| 1811 SE Walton Lakes Dr Port Saint Lucie, FL | 2.0 | 1.0–2.0 | 1117 | $1,926 | $1.72 | 14d | 6 | 0.16mi |
| 1810 SE Pinewood Trl Port Saint Lucie, FL | 1.0–2.0 | 1.0–2.0 | 1013 | $2,055 | $2.03 | 14d | 7 | 0.36mi |
| 2058 SE Wild Meadow Cir #101 Port St Lucie, FL | 2.0 | 2.5 | 1425 | $2,200 | $1.54 | 14d | 1 | 0.46mi |
| 2130 SE Wild Meadow Cir Port Saint Lucie, FL | 2.0 | 2.0 | 1440 | $1,695 | $1.18 | 14d | 1 | 0.55mi |
| 1131 SE Parrish Ct Port Saint Lucie, FL | 2.0 | 1.0 | 902 | $2,000 | $2.22 | 23d | 1 | 0.57mi |
| 1503 SE Royal Green Cir Unit V104 Port St. Lucie, FL | 2.0 | 2.0 | 865 | $1,750 | $2.02 | 23d | 1 | 0.68mi |
| 1565 SE Royal Green Cir #108 Port St Lucie, FL | 1.0 | 1.0 | 705 | $1,595 | $2.26 | 14d | 1 | 0.72mi |
| 1516 SE Royal Green Cir #202 Port St Lucie, FL | 3.0 | 2.0 | 921 | $2,100 | $2.28 | 23d | 1 | 0.73mi |
| 1520 SE Royal Green Cir Unit K-203 Port St. Lucie, FL | 2.0 | 2.0 | 886 | $1,800 | $2.03 | 23d | 1 | 0.74mi |
| 1455 SE Colchester Cir Port Saint Lucie, FL | 2.0 | 2.0 | 921 | $1,795 | $1.95 | 14d | 1 | 0.74mi |
| 1550 SE Royal Green Cir Port St. Lucie, FL | 2.0 | 2.0 | 782 | $1,850 | $2.37 | 14d | 1 | 0.75mi |
| 1524 SE Royal Green Cir Unit Q102 Port St. Lucie, FL | 2.0 | 2.0 | 865 | $1,800 | $2.08 | 14d | 1 | 0.75mi |
| 1562 SE Royal Green Cir Unit T-204 Port St. Lucie, FL | 2.0 | 2.0 | 782 | $1,900 | $2.43 | 23d | 1 | 0.76mi |
| 1566 SE Royal Green Cir #203 Port St Lucie, FL | 2.0 | 2.0 | 782 | $2,000 | $2.56 | 14d | 1 | 0.78mi |
| 2209 SE East Dunbrooke Cir Port Saint Lucie, FL | 3.0 | 2.0 | 1212 | $2,950 | $2.43 | 14d | 1 | 0.79mi |
| 1500 SE Tiffany Club Pl Port Saint Lucie, FL | 1.0–3.0 | 1.0–2.0 | 895 | $1,922 | $2.15 | 14d | 7 | 0.80mi |
| 3784 Sapodilla Ct Port Saint Lucie, FL | 2.0 | 2.0 | 1121 | $2,300 | $2.05 | 23d | 1 | 0.81mi |
| 1537 SE Royal Green Cir Unit E204 Port St. Lucie, FL | 2.0 | 2.0 | 886 | $1,750 | $1.98 | 14d | 1 | 0.84mi |
| 1900 Bella Vista Way Port Saint Lucie, FL | 1.0–2.0 | 1.0–2.0 | 995 | $1,764 | $1.77 | 14d | 15 | 0.87mi |
| 1550 SE Royal Green Cir Unit P-203 Port St. Lucie, FL | 2.0 | 2.0 | 782 | $1,750 | $2.24 | 23d | 1 | 0.87mi |
| 1536 SE Royal Green Cir #101 Port St Lucie, FL | 2.0 | 2.0 | 782 | $1,750 | $2.24 | 23d | 1 | 0.89mi |
| 1548 SE Royal Green Cir Unit M-103 Port St. Lucie, FL | 2.0 | 2.0 | 886 | $1,800 | $2.03 | 23d | 1 | 0.90mi |
| 1548 SE Royal Green Cir #108 Port St Lucie, FL | 1.0 | 1.0 | 705 | $1,650 | $2.34 | 14d | 1 | 0.90mi |
| 1618 SE Elkhart Ter Port Saint Lucie, FL | 3.0 | 2.0 | 1176 | $2,200 | $1.87 | 23d | 1 | 0.99mi |
| 2051 SE Hillmoor Dr Port Saint Lucie, FL | 1.0–2.0 | 1.0–2.0 | 1014 | $2,539 | $2.50 | 23d | 15 | 1.29mi |
| 1350 SE La Haven Ct Port Saint Lucie, FL | 2.0 | 2.0 | 1041 | $2,100 | $2.02 | 23d | 1 | 1.29mi |
| 1456 SE Rivergreen Cir Port Saint Lucie, FL | 2.0 | 2.0 | 921 | $1,825 | $1.98 | 14d | 1 | 1.29mi |
| 9905 S US Highway 1 Port Saint Lucie, FL | 1.0–2.0 | 1.0–2.0 | 966 | $2,239 | $2.32 | 14d | 15 | 1.29mi |
| 1900 SE Hillmoor Dr Port Saint Lucie, FL | 2.0–3.0 | 2.0–2.5 | 1182 | $1,799 | $1.52 | 14d | 14 | 1.30mi |
| 2061 SE Glen Ridge Dr Port Saint Lucie, FL | 2.0 | 2.5 | 1350 | $1,925 | $1.43 | 23d | 1 | 1.37mi |
Listing history 29 events
-
2026-06-18days on market $90,000 Active 44 DOM
-
2026-06-17days on market $90,000 Active 43 DOM
-
2026-06-16days on market $90,000 Active 42 DOM
-
2026-06-15days on market $90,000 Active 41 DOM
-
2026-06-14days on market $90,000 Active 39 DOM
-
2026-06-13days on market $90,000 Active 38 DOM
-
2026-06-10days on market $90,000 Active 36 DOM
-
2026-06-09days on market $90,000 Active 35 DOM
-
2026-06-08days on market $90,000 Active 34 DOM
-
2026-06-07days on market $90,000 Active 33 DOM
-
2026-06-05days on market $90,000 Active 30 DOM
-
2026-06-03days on market $90,000 Active 29 DOM
-
2026-06-02days on market $90,000 Active 28 DOM
-
2026-06-01days on market $90,000 Active 27 DOM
-
2026-05-31days on market $90,000 Active 26 DOM
-
2026-05-30days on market $90,000 Active 25 DOM
-
2026-05-04$90,000 Active
-
2024-05-01historical
-
2024-04-13price $65,000
-
2024-03-16historical
-
2024-01-29price $75,000
-
2023-12-14$84,000 Active
-
2023-11-21$82,000 Active
-
2022-04-05soldstatus $63,500 Closed
-
2022-03-12status Pending
-
2022-02-04$64,000 Active
-
2020-10-01soldstatus $20,000 Closed
-
2020-09-24status Pending
-
2020-09-23$20,000 Active
ⓘ Source: listings_history table (triggers on properties + properties_extension) + one-shot
backfill from property_details.listing_events for pre-trigger history.
Climate risk First Street
- Flood 1/10 Low FEMA zone X (unshaded) · 0% chance over 30 yrs
- Wildfire 3/10 Moderate
- Heat 10/10 Extreme 7 d/yr ≥106°F today · 22 d/yr by 30 yrs out
- Wind 10/10 Extreme 99% chance of damaging wind over 30 yrs
- Air quality 2/10 Low 1 unhealthy d/yr today · 1 by 30 yrs out
Nearby sold comps map
Loading sold comps map…
Walkable amenities ~0.75 mi
Loading nearby amenities…
Taxation est. · year 1
- Rental income
- $23,360
- − Mortgage interest
- −$5,041
- − Property taxes
- −$1,350
- − Insurance
- −$450
- − Repairs & maintenance
- −$1,869
- − Management
- −$1,869
- − Depreciation
- −$2,618
- Taxable income
- $10,163
- Est. tax owed @ 24.0%
- −$2,439
- After-tax cash flow
- $8,552/yr
For passive investors: Depreciation is non-cash, so a rental often shows a tax loss while cash-flowing — sheltering income. Rental losses are passive: they offset passive income freely, and up to $25,000/yr can offset ordinary (W-2) income if you actively participate and your MAGI is under $100k (phasing out to $0 by $150k); unused losses carry forward. On sale, claimed depreciation is recaptured at up to 25%, and gains may owe capital-gains tax (a 1031 exchange can defer both). Figures are a year-1 estimate at your 24.0% rate — not tax advice; consult a CPA.
Condition & rehab AI · 12 photos
The home requires moderate renovations, focusing on exterior siding, interior walls, and flooring. Paint and replace appliances to enhance curb appeal and interior aesthetics.
Repairs flagged
- Major exterior siding — Significant wear and tear
- Minor interior walls — Some paint chipping
- Major flooring — Visible wear and tear
- Minor kitchen appliances — Standard appliances, some clutter
Value-add opportunities
- Both Paint interior walls — Enhances curb appeal and interior aesthetics
- Both Replace flooring — Improves comfort and value
- Both Replace kitchen appliances — Modernizes the space and increases value
Renovation cost estimate screening
| Repair item | Severity | Est. cost |
|---|---|---|
| exterior siding · Significant wear and tear | Major | $15,000–50,000 |
| interior walls · Some paint chipping | Minor | $500–3,000 |
| flooring · Visible wear and tear | Major | $15,000–50,000 |
| kitchen appliances · Standard appliances, some clutter | Minor | $500–3,000 |
| Total estimated repair cost · 4 items | $31,000–106,000 |
Value-add ROI direction
- Both Paint interior walls — Enhances curb appeal and interior aesthetics ↑
- Both Replace flooring — Improves comfort and value ↑
- Both Replace kitchen appliances — Modernizes the space and increases value ↑
ⓘ Cost ranges are severity-bucket heuristics (US national rule-of-thumb). Get contractor quotes + a written scope before underwriting a rehab budget.
Schools (NCES district)
- District
- St. Lucie
- NCES district ID
- 1201770
- Math proficiency
- 40% ▼ -11.00%
- Reading proficiency
- 48% ▼ -4.00%
- Median HH income
- $44,737
- Composite
- 37.28/100
- National rank
- #4449
- State rank
- #51 of 73 in FL
Livability — Port St. Lucie
No livability data for this city. (Only ~50 U.S. cities are tracked.)
Census & demographics
- Census place
- Port St. Lucie, FL
- County
- Saint Lucie County · 337,150 people
- City population
- 221,051
- Metro
- Port St. Lucie, FL
- Population (ZIP)
- 42,655
- Household income
- $61,628
- Rent vs Own
- Severe rent burden
- 1759.0
Population outlook (St. Lucie County) Hauer SSP2
- Today (2025)
- 338,016 people
- By 2030
- 355,687 · +5.2%
- By 2040
- 385,521 · +14.1%
- By 2050
- 406,106 · +20.1%
- By 2075
- 441,054 · +30.5%
- By 2100
- 436,885 · +29.2%
Race, ethnicity, and origin ACS 2023
- Neighborhood character
- Diverse neighborhood (Simpson 0.57)
- Race & ethnicity
- White 62% Hispanic / Latino 19% Two or more races 14% Black 10% Asian 3%
- Hispanic origin (detail)
- Mexican 4% Puerto Rican 4% Cuban 2% Dominican 2%
- Common ancestry
- Romanian 3% Lithuanian 2% Hispanic 1%
- Foreign-born
- 18% · Canada, Jamaica, China
- Languages at home
- 76% English-only · Spanish 16% French/Haitian/Cajun 3% Tagalog/Filipino 2%
Political lean MEDSL · St. Lucie
- 2024 margin
- Lean R (+9.1) · D 45.1% · R 54.2%
- 2008→2024 swing
- -21.2pp toward R · 2008: 12.1pp · 2024: -9.1pp
- All cycles
- 2024: R+9.1 2020: R+1.6 2016: R+2.5 2012: D+7.9 2008: D+12.1
Not yet ingested
- Civics
- —
Market trends
- HPI YoY
- ▼ -155.80%
- Current HPI
- 371.0573
- Rent YoY
- ▲ 1.92%
- Metro
- Port St. Lucie, FL
- State GDP YoY
- ▲ 3.28%
- F500 in state
- 36
Industry mix (Fortune 500 HQ in FL)
| Industry | F500 HQs | Revenue |
|---|---|---|
| Industrial Technology | 2 | $29B |
|
||
| Insurance | 2 | $17B |
|
||
| Retail | 1 | $60B |
|
||
| Technology Distribution | 1 | $58B |
|
||
| Homebuilding | 1 | $35B |
|
||
| Technology Manufacturing | 1 | $35B |
|
||
Price history
+350.0% since first listed13 events — show timeline
- 2026-05-04 Listed $90,000 Beaches MLS
- 2024-05-01 Listing Removed — Beaches MLS
- 2024-04-13 Price Changed $65,000 Beaches MLS
- 2024-03-16 Listing Removed — Beaches MLS
- 2024-01-29 Price Changed $75,000 Beaches MLS
- 2023-12-14 Listed $84,000 Beaches MLS
- 2023-11-21 Listed $82,000 Beaches MLS
- 2022-04-05 Sold (MLS) $63,500 Beaches MLS
- 2022-03-12 Pending — Beaches MLS
- 2022-02-04 Listed $64,000 Beaches MLS
- 2020-10-01 Sold (MLS) $20,000 MCRTC
- 2020-09-24 Pending — MCRTC
- 2020-09-23 Listed $20,000 MCRTC
Cash-flow waterfall
monthlySold comps — $/sqft
last 12 mo · ≤1 miLoading sold comps…