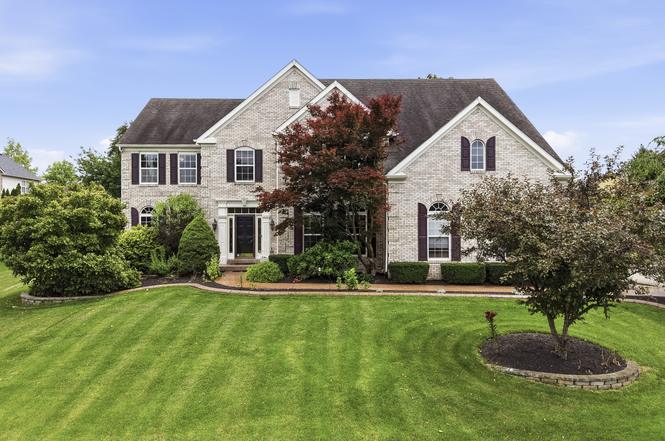
13967 Hawkstone Dr · Fishers, IN
Flood risk 1/10 · Minimal
- FEMA flood zone
- X (unshaded)
- Chance of flooding over 30 yrs
- 0.0%
- Est. flood insurance / yr
- $473 – $860
Fire risk 1/10 · Minimal
- Est. fire insurance / yr
- $717 – $1,331
Heat risk 3/10 · Minor
- Hot days now (above 100°F)
- 7 days/yr
- Hot days in 30 yrs
- 18 days/yr
Wind risk 2/10 · Minimal
- Chance of severe wind over 30 yrs
- 1.0%
Air-quality risk 2/10 · Minimal
- Unhealthy air days now
- 1 days/yr
- Unhealthy air days in 30 yrs
- 2 days/yr
Risk factors via First Street. Map © Google.
Why this score? — see what drove the B- grade
The composite is a weighted blend of 9 inputs, each scored 0–100. Each bar is that input's sub-score; the figure is the points it added to the 100-point composite (weight × sub-score).
- Cash flow +23.8/30.0
- ARV discount +15.0/15.0
- DSCR +7.7/10.0
- 1% rule +5.6/10.0
- Schools +5.3/10.0
- Livability +4.2/5.0
- Rent growth +2.5/5.0
- Condition / age +2.5/5.0
- Appreciation +0.0/10.0
$850,000
🖨 Deal sheet 📄 Offer letter ✓ Due diligence
Listing remarks
You won't believe how much this home offers for the price! FULL brick, 6 beds, 6.5 baths, 6000+ square feet, 2 kitchens, indoor swim spa! 3/4" solid exotic hardwoods grace almost the entire main level. 2-story entry, 2 separate stairs to the upper level w/ wrought iron spindles. Huge family rm w/ 12' tray ceiling is wide open to the kitchen w/ 42" cabinets, tile backsplash, center isle, newer stainless appliances w/ built-in oven/micro. The living rm opens to the formal dining rm w/ tray ceiling for plenty of entertaining room. Main level office w/ built-ins & crown. Swim year round in the 24x24 heated/cooled sun rm w/ cathedral ceiling, sunken swim spa & dedicated fu
Key facts
- Full brick
- Indoor swim spa
- 2 kitchens
Tags
Property features AI
Finance
- HOA & community: Homeowners association with semi-annual fee ($225); Association includes entrance common maintenance and snow removal
Exterior
- Parking: Attached three-car garage with finished space and garage door opener; garage faces side; Concrete driveway
- Security: Security system with closed-circuit cameras and smoke detectors
- Utilities: Public water; Municipal sewer connected; No solid waste service indicated
- Home design: Single-family residence; Two levels; Mandatory fee ownership
- Construction: Brick construction; Concrete perimeter foundation and crawl space; Finished basement with 9+ foot ceilings and egress windows
- Exterior features: Covered patio; Patio area; Fire pit; Sprinkler system; Corner lot with curbs, sidewalks and mature trees
Interior
- Kitchen: Electric cooktop and gas cooktop; Oven, microwave and range hood; Dishwasher, disposal and refrigerator
- Bedrooms: Five bedrooms on the upper level; One bedroom in the finished basement; Primary bedroom with walk-in closet
- Flooring: Hardwood floors
- Bathrooms: Six full bathrooms and one half bathroom total; Primary bath includes double sinks, whirlpool tub, separate shower, tub with separate shower and shower stall
- Heating & cooling: Forced air heating (natural gas); Central air conditioning
- Interior features: Cathedral ceilings, tray ceilings and high ceilings; Kitchen island and eat-in kitchen; Walk-in closets and pantry; Central vacuum; Hardwood floors; Jack-and-Jill bath and formal living room
- Laundry & utility: Main-level laundry with utility sink; Gas water heater and tankless water heater; Humidifier and exhaust fan
Neighborhood map
What this means for you Summary
Snapshot
- This is a 6-bed/4.5-bath single-family listed at $850k.
Deal economics
- At list price, monthly cash flow is $2k ($20k/yr) — positive.
- The deal already cash-flows at list — no discount required.
- Meets the 1% rule at list price ($9k rent vs $850k).
- Cap rate 8.6% vs local median 3.6% in Fishers — top-decile yield for the area; either an underpriced asset or a hidden risk that comps aren't pricing in. Stress-test before assuming the spread holds.
Location & tenants
- Location reads 83/100 on livability (#11 in IN, #898 nationally) — a professional / high-income tenant draw. Strengths: schools A+, crime A+, amenities A+; Watch: commute F.
- Hamilton Southeastern Schools (suburban): math 57% / reading 59% proficiency, ranked #14 of 301 in IN (top 5%) — acceptable for families but not a draw, mixed tenant base, ~2y average lease; only 10% free/reduced lunch — higher-income household profile.
- Market conditions: 303 active listings in the ZIP; 3 comparable units currently listed for rent nearby; rentals leasing fast (median 8d on market — plan ~1-2 weeks tenant-placement turnaround); 4,661 units permitted in Hamilton County in 2024 (1,528 in 5+ unit buildings).
Forward outlook
- Local home prices are declining (-3.0%/yr); year-one equity from $6k of loan paydown is wiped out by about $26k of value loss. Plan a longer hold.
- Hamilton County population projected at +44% by 2050 — long-run rental-demand tailwind backs the buy-and-hold thesis.
Negotiation context
- Only 1 days on market — expect competitive offers; lowballing is unlikely to land.
Questions for the listing agent
- What does the HOA fee cover, when was the last increase, and are there any pending special assessments or reserve-fund shortfalls?
- Is there a deadline driving the sale (1031 exchange, divorce, estate, relocation)? That informs how much negotiation room exists.
- Schools are A-rated — typically a magnet for longer-tenancy family renters. What's the average tenant stay here, and is there a school-zone premium baked into asking?
- What's the average days-on-market for RENTAL listings here right now (not sales)? A rising rental-DOM trend means longer vacancies and softer asking-rent achievability than the comps imply.
- What's the recent tenant-quality profile in this submarket — average credit score on applications, eviction rate, late-payment / NSF rate, and stable-employment percentage? A property-management company in the area should have these aggregated.
- How much new for-sale + rental construction is in the pipeline within 1–3 miles? Heavy new supply typically softens prices + rents 12–24 months out; constrained supply supports both.
Investment metrics
- 1% rule
- 1.06% ✓
- Cap rate
- 8.61%
- Cash-on-cash
- 8.26%
- DSCR
- 1.37
- GRM
- 7.9
CMA / ARV
- ARV (on-the-fly)
- $1,065,388
- Comps found
- 12
Show comp detail 12 sales within ~0.75 mi
| Address | Dist | Beds/Ba | Sqft | Sold | Price | $/sf | Match |
|---|---|---|---|---|---|---|---|
| 10555 Serra Vista Pt | 0.21mi | 5/4.5 (-1) | 6,253 (-3%) | 5mo | $721,000 | $115 | 77 |
| 13909 Waterway Blvd | 0.09mi | 6/4.5 | 7,082 (+10%) | 7mo | $1,200,000 | $169 | 73 |
| 10526 Proposal Pointe Way | 0.18mi | 5/5.0 (-1) | 6,834 (+6%) | 2mo | $720,000 | $105 | 72 |
| 13682 Kingston Dr | 0.46mi | 5/4.5 (-1) | 6,610 (+3%) | 1mo | $2,299,000 | $348 | 68 |
| 10138 Backstretch Row | 0.65mi | 5/4.5 (-1) | 6,504 (+1%) | 5mo | $810,000 | $125 | 58 |
| 10759 Giselle Way | 0.42mi | 5/4.5 (-1) | 5,755 (-10%) | 1mo | $920,000 | $160 | 57 |
| 14395 Brooks Edge Ln | 0.66mi | 5/4.5 (-1) | 6,483 (+1%) | 6mo | $1,040,000 | $160 | 57 |
| 10297 Timberland Dr | 0.55mi | 5/4.5 (-1) | 5,967 (-7%) | 6mo | $990,000 | $166 | 52 |
| 14239 Kingdom Ct | 0.40mi | 5/4.5 (-1) | 5,644 (-12%) | 5mo | $989,000 | $175 | 52 |
| 10219 Springstone Rd | 0.66mi | 5/4.5 (-1) | 5,896 (-8%) | 1mo | $1,750,000 | $297 | 50 |
| 13617 Creekridge Ln | 0.59mi | 6/4.5 | 5,673 (-12%) | 4mo | $995,000 | $175 | 50 |
| 10544 Tavarez Ct | 0.73mi | 5/4.5 (-1) | 5,865 (-9%) | 7mo | $810,000 | $138 | 41 |
Match score weights: distance 35% · size 25% · config 20% · recency 20%. Top-matched comps best support the ARV.
Projected returns pro-forma
-3.0% appreciation · 3.0% rent growth · sell at horizon
- IRR
- -3.8%
- Equity multiple
- 0.86×
- Total profit
- $-33,537
- Equity at exit
- $126,738
- IRR
- 5.9%
- Equity multiple
- 1.44×
- Total profit
- $104,666
- Equity at exit
- $73,492
Cash invested: $238,000 (down + closing). Projections, not guarantees.
Landlord ↔ Tenant lean methodology
- Overall (STATE)
- 90 Strongly Landlord-Friendly
- State Indiana
- 90 Strongly Landlord-Friendly · R+11
- County
- — inherits STATE
- City
- — inherits STATE
ZIP-level market 46040
- Home prices YoY
- -24.4%
- Active inventory
- 303
- Price-to-rent
- 7.9×
Monthly cashflow live
- Estimated rent
- $9,004 medium interval (Pro) →
- Mortgage (P&I)
- −$4,457
- Tax from tax record
- −$626 /mo · $7,507/yr
- Insurance
- −$354
- HOA
- −$38
- Vacancy / Maint / Mgmt
- −$1,891
- Net cashflow
- $1,638
Break-even live
UW: 25.0% down · 7.5% · 30yr · 1.5% tax · 5.0% vac · 8.0% maint · 8.0% mgmt
Financing live
Cash to close
- Down payment
- $212,500
- Closing costs
- $25,500
- Reserves months
- —
- Total cash needed
- —
Loan-product check · same deal, 3 products live
Conventional
25% down · 7.5% · 30yr
- Down + closing
- —
- Monthly P&I
- —
- Monthly cashflow
- —
- DSCR
- —
- Eligible?
- —
Personal DTI + credit; lowest rate.
DSCR
20% down · 8.5% · 30yr
- Down + closing
- —
- Monthly P&I
- —
- Monthly cashflow
- —
- DSCR
- —
- Eligible?
- —
No personal income docs; deal must DSCR.
Hard money
10% down · 12.0% · 12mo
- Down + closing
- —
- Monthly P&I
- —
- Monthly cashflow
- —
- DSCR
- —
- Eligible?
- —
Short-term bridge; refi at stabilization.
Rent comps 3 comps
| Address | Beds | Baths | Sqft | Rent | $/sqft | DOM | Units | Dist |
|---|---|---|---|---|---|---|---|---|
| 10599 Geist View Dr Fishers, IN | 5.0 | 4.5 | 5119 | $11,900 | $2.32 | 43d | 1 | 0.21mi |
| 10599 Geist View Dr Fishers, IN | 5.0 | 4.5 | 5119 | $7,500 | $1.47 | 7d | 1 | 0.21mi |
| 10057 Backstretch Row Unit NA Fortville, IN | 5.0 | 5.0 | 5541 | $4,499 | $0.81 | 1d | 1 | 0.75mi |
HOA detail
- Monthly dues
- $38 · $456/yr
Listing history 2 events
-
2026-06-19remarks 681-char remark
-
2026-06-19$850,000 Active 1 DOM
ⓘ Source: listings_history table (triggers on properties + properties_extension) + one-shot
backfill from property_details.listing_events for pre-trigger history.
Tax reassessment forecast IN · Partial reset (capped growth)
- Current annual tax
- $7,507 · $626/mo
- Projected year-2 tax
- $7,507 · $626/mo
- Expected delta
- $0/yr ($0/mo · 0.0%)
ⓘ Screening estimate from a state-policy table — verify with the county assessor before closing.
Climate risk First Street
- Flood 1/10 Low FEMA zone X (unshaded) · 0% chance over 30 yrs
- Wildfire 1/10 Low
- Heat 3/10 Moderate 7 d/yr ≥100°F today · 18 d/yr by 30 yrs out
- Wind 2/10 Low 100% chance of damaging wind over 30 yrs
- Air quality 2/10 Low 1 unhealthy d/yr today · 2 by 30 yrs out
Nearby sold comps map
Loading sold comps map…
Walkable amenities ~0.75 mi
Loading nearby amenities…
Taxation est. · year 1
- Rental income
- $108,045
- − Mortgage interest
- −$47,613
- − Property taxes
- −$7,507
- − Insurance
- −$4,250
- − Repairs & maintenance
- −$8,644
- − Management
- −$8,644
- − HOA
- −$456
- − Depreciation
- −$24,727
- Taxable income
- $6,205
- Est. tax owed @ 24.0%
- −$1,489
- After-tax cash flow
- $18,164/yr
For passive investors: Depreciation is non-cash, so a rental often shows a tax loss while cash-flowing — sheltering income. Rental losses are passive: they offset passive income freely, and up to $25,000/yr can offset ordinary (W-2) income if you actively participate and your MAGI is under $100k (phasing out to $0 by $150k); unused losses carry forward. On sale, claimed depreciation is recaptured at up to 25%, and gains may owe capital-gains tax (a 1031 exchange can defer both). Figures are a year-1 estimate at your 24.0% rate — not tax advice; consult a CPA.
Schools (NCES district)
- District
- Hamilton Southeastern Schools
- NCES district ID
- 1810650
- Math proficiency
- 57% ▼ -11.00%
- Reading proficiency
- 59% ▼ -7.00%
- Median HH income
- $87,726
- Composite
- 53.02/100
- National rank
- #1520
- State rank
- #14 of 301 in IN
Livability — Fishers
- Score
- 83/100
- State rank
- #11
- US rank
- #898
Category grades
Schools grade is shown separately in the Schools card above.
Census & demographics
- Census place
- Fishers, IN
- City population
- 92,467
- Population (ZIP)
- 17,891
Population outlook (Hamilton County) Hauer SSP2
- Today (2025)
- 381,938 people
- By 2030
- 417,496 · +9.3%
- By 2040
- 486,684 · +27.4%
- By 2050
- 549,805 · +44.0%
- By 2075
- 687,078 · +79.9%
- By 2100
- 754,495 · +97.5%
Race, ethnicity, and origin ACS 2023
- Neighborhood character
- Predominantly White (83%)
- Race & ethnicity
- White 83% Black 6% Two or more races 4% Asian 4% Hispanic / Latino 2%
- Common ancestry
- Lithuanian 5% Romanian 2% Portuguese 2%
- Foreign-born
- 5% · Canada
- Languages at home
- 94% English-only · Other Indo-European 3% Arabic 1% Spanish 1%
Political lean MEDSL · Hamilton
- 2024 margin
- Lean R (+6.1) · D 46.0% · R 52.1% · Other 1.9%
- 2008→2024 swing
- +16.2pp toward D · 2008: -22.2pp · 2024: -6.1pp
- All cycles
- 2024: R+6.1 2020: R+6.8 2016: R+19.6 2012: R+34.3 2008: R+22.2
Not yet ingested
- Civics
- —
Market trends
- HPI YoY
- ▼ -71.54%
- Current HPI
- 221.8703
- Rent YoY
- —
- Metro
- —
- State GDP YoY
- ▲ 2.90%
- F500 in state
- 18
Industry mix (Fortune 500 HQ in IN)
| Industry | F500 HQs | Revenue |
|---|---|---|
| Industrial Machinery | 2 | $37B |
|
||
| Healthcare | 1 | $177B |
|
||
| Pharmaceuticals | 1 | $45B |
|
||
| Metals / Steel | 1 | $18B |
|
||
| Agriculture | 1 | $17B |
|
||
| Packaging | 1 | $12B |
|
||
Price history
1 event — show timeline
- 2026-06-18 Listed $850,000 MIBOR as Distributed by MLS Grid
Property tax history
+5.2%/yrLatest (2025): $7,507 · +0.3% YoY. Source: county tax records.
Cash-flow waterfall
monthlySold comps — $/sqft
last 12 mo · ≤1 miLoading sold comps…