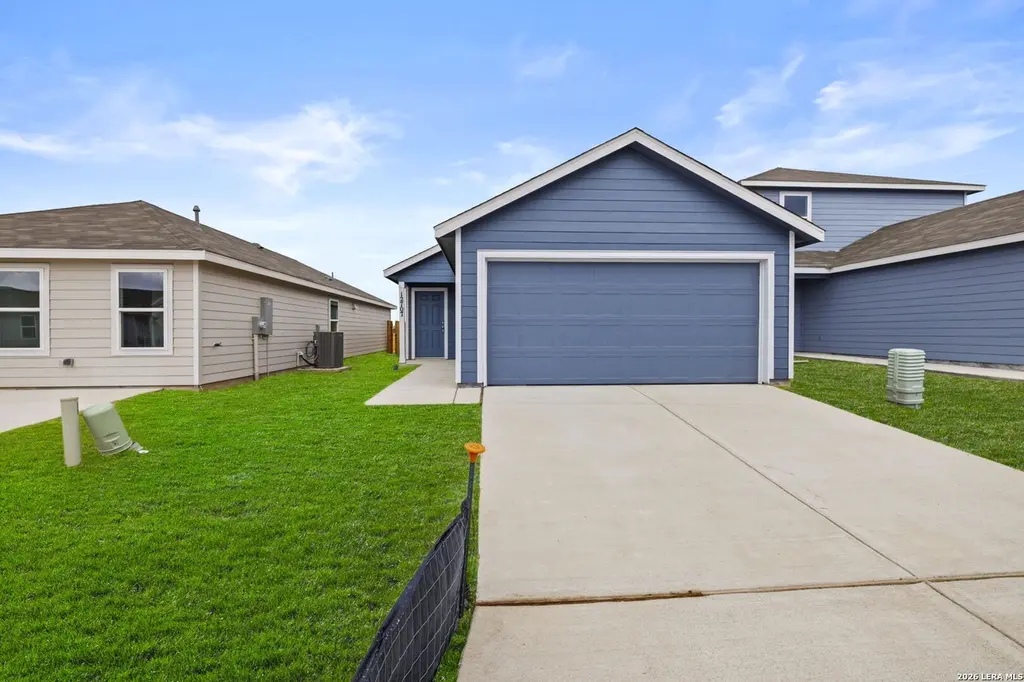
12707 Kathleen St · St. Hedwig, TX
Flood risk No data
- FEMA flood zone
- —
- Chance of flooding over 30 yrs
- —
- Est. flood insurance / yr
- —
Fire risk No data
- Est. fire insurance / yr
- —
Heat risk No data
- Hot days now (above threshold)
- —
- Hot days in 30 yrs
- —
Wind risk No data
- Chance of severe wind over 30 yrs
- —
Air-quality risk No data
- Unhealthy air days now
- —
- Unhealthy air days in 30 yrs
- —
Risk factors via First Street. Map © Google.
Why this score? — see what drove the D grade
The composite is a weighted blend of 9 inputs, each scored 0–100. Each bar is that input's sub-score; the figure is the points it added to the 100-point composite (weight × sub-score).
- Cash flow +15.4/30.0
- Appreciation +5.6/10.0
- DSCR +4.7/10.0
- Condition / age +4.0/5.0
- 1% rule +3.0/10.0
- Livability +2.5/5.0
- Rent growth +2.3/5.0
- Schools +1.9/10.0
- ARV discount +0.9/15.0
$219,500
🖨 Deal sheet 📄 Offer letter ✓ Due diligence
Listing remarks MLS
*Seller is willing to assist with closing costs or a rate buy-down through preferred lender with an acceptable offer. The Hoffman- This single-level home showcases a spacious open floorplan shared between the kitchen, dining area and family room for easy entertaining. An owner's suite enjoys a private location at the front of the home, complemented by an en-suite bathroom and walk-in closet. There are three secondary bedrooms just off the main living areas, which are comfortable spaces for household members and overnight guests.
Key facts
- 4,791 sq ft lot
- 2 garage spots
- Built 2025
Neighborhood map
What this means for you Summary
Snapshot
- This is a 4-bed/2.0-bath single-family listed at $220k. Condition is rated good.
Deal economics
- At list price, monthly cash flow is $84 ($1k/yr) — positive.
- The deal already cash-flows at list — no discount required.
- To meet the 1% rule (rent ≥ 1% of price), the offer needs to be $176k (19.8% below list).
- Recommended offer: $176k (19.8% below list) — sets the bar for 1% rule.
- Cap rate 6.8% vs local median 4.0% in St. Hedwig — top-decile yield for the area; either an underpriced asset or a hidden risk that comps aren't pricing in. Stress-test before assuming the spread holds.
Location & tenants
- Location reads: area grade D — affects rentability + tenant quality, not the cash-flow math above.
- East Central ISD (rural): math 16% / reading 25% proficiency, ranked #758 of 826 in TX (top 92%) — low school quality limits family demand, transient renter base, plan for 1-2y turnover; 61% free/reduced lunch — lower-income household profile, screen leases tightly.
- Market conditions: Rents soft (-0.9%/yr); 155 active listings in the ZIP; 40 comparable units currently listed for rent nearby; rentals at typical pace (median 18d on market — plan ~3-4 weeks tenant-placement turnaround); high-income renter base; 8,308 units permitted in Bexar County in 2024 (2,506 in 5+ unit buildings).
- This rent is only 17% of the median local income ($124k/yr) — well below the 30% rent-burden line; pricing power to push rent on renewal without tenant pushback.
Forward outlook
- In year one you build about $4k of equity ($2k loan paydown + $3k appreciation (1.2% local appreciation)).
- Bexar County population projected at +50% by 2050 — long-run rental-demand tailwind backs the buy-and-hold thesis.
- By year 8, paydown + projected appreciation supports a ~$33k cash-out refi (75% LTV) — recoverable capital for the next deal without selling this one.
Negotiation context
- It's been on market 66 days — a 6% lower offer ($206k) is reasonable based on typical stale-listing flexibility.
- 2 sale attempts with the ask held roughly flat each time — persistent listings suggest the price (not the market) is what's stuck; bring a comps-based counter.
Questions for the listing agent
- It's been on market 66 days. Have you received any prior offers? Is the seller open to a 20% concession, seller financing, or rate buy-down credit?
- What does the HOA fee cover, when was the last increase, and are there any pending special assessments or reserve-fund shortfalls?
- Why hasn't it sold? Are there any deal-killer items the seller is aware of (foundation, flood, title, zoning, code violations)?
- Is there a deadline driving the sale (1031 exchange, divorce, estate, relocation)? That informs how much negotiation room exists.
- The area grade is low — what's the realistic commute time and amenity access for the typical tenant pool here? Any planned neighborhood developments (good or bad) we should know about?
- What's the average days-on-market for RENTAL listings here right now (not sales)? A rising rental-DOM trend means longer vacancies and softer asking-rent achievability than the comps imply.
- What's the recent tenant-quality profile in this submarket — average credit score on applications, eviction rate, late-payment / NSF rate, and stable-employment percentage? A property-management company in the area should have these aggregated.
- How much new for-sale + rental construction is in the pipeline within 1–3 miles? Heavy new supply typically softens prices + rents 12–24 months out; constrained supply supports both.
Investment metrics
- 1% rule
- 0.80% ✗
- Cap rate
- 6.75%
- Cash-on-cash
- 1.64%
- DSCR
- 1.07
- GRM
- 10.4
CMA / ARV
- ARV (median comp)
- $191,577
- List price
- $219,500
- Delta
- 14.58%
- Verdict
- OVERPRICED
- Comps
- 20 within 1.0 mi
Show comp detail 12 sales within ~0.75 mi
| Address | Dist | Beds/Ba | Sqft | Sold | Price | $/sf | Match |
|---|---|---|---|---|---|---|---|
| 12823 Kathleen St | 0.15mi | 4/2.0 | 1,500 (+1%) | 3mo | $176,499 | $118 | 89 |
| 13011 Chinali Spgs | 0.20mi | 4/2.0 | 1,500 (+1%) | 3mo | $184,950 | $123 | 86 |
| 3606 Jacobs Wl | 0.11mi | 4/2.0 | 1,483 (0%) | 12mo | $218,459 | $147 | 85 |
| 3530 Jacobs Wl | 0.10mi | 4/2.0 | 1,500 (+1%) | 11mo | $179,899 | $120 | 84 |
| 3921 Asher Aly | 0.38mi | 4/2.0 | 1,459 (-2%) | 4mo | $199,900 | $137 | 77 |
| 3857 Ivy Path | 0.28mi | 3/2.0 (-1) | 1,446 (-2%) | 6mo | $182,400 | $126 | 73 |
| 12930 Deep Eddy | 0.23mi | 3/2.0 (-1) | 1,300 (-12%) | 8mo | $227,800 | $175 | 58 |
| 12915 Cicely Ct | 0.46mi | 3/2.0 (-1) | 1,339 (-10%) | 1mo | $209,900 | $157 | 56 |
| 3925 Asher Aly | 0.38mi | 3/3.5 (-1) | 1,681 (+13%) | 2mo | $214,900 | $128 | 47 |
| 3916 Asher Aly | 0.41mi | 3/2.5 (-1) | 1,681 (+13%) | 6mo | $224,900 | $134 | 47 |
| 13012 Lineberry Ln | 0.43mi | 3/2.5 (-1) | 1,681 (+13%) | 7mo | $224,900 | $134 | 45 |
| 13027 Dolomar Pkwy | 0.60mi | 3/2.5 (-1) | 1,700 (+15%) | 3mo | $224,347 | $132 | 38 |
Match score weights: distance 35% · size 25% · config 20% · recency 20%. Top-matched comps best support the ARV.
Projected returns pro-forma
1.24% appreciation · 0.0% rent growth · sell at horizon
- IRR
- 2.2%
- Equity multiple
- 1.11×
- Total profit
- $6,838
- Equity at exit
- $77,733
- IRR
- 5.1%
- Equity multiple
- 1.60×
- Total profit
- $36,996
- Equity at exit
- $105,500
Cash invested: $61,460 (down + closing). Projections, not guarantees.
Landlord ↔ Tenant lean methodology
- Overall (STATE)
- 87 Strongly Landlord-Friendly
- State Texas
- 87 Strongly Landlord-Friendly · R+5
- County
- — inherits STATE
- City
- — inherits STATE
ZIP-level market 78152
- Home prices YoY
- 0.4%
- Rents YoY
- -0.9%
- Active inventory
- 155
- Price-to-rent
- 10.4×
Monthly cashflow live
- Estimated rent
- $1,761 high interval (Pro) →
- Mortgage (P&I)
- −$1,151
- Tax from tax record
- −$47 /mo · $566/yr
- Insurance
- −$91
- HOA
- −$17
- Vacancy / Maint / Mgmt
- −$370
- Net cashflow
- $84
Break-even live
UW: 25.0% down · 7.5% · 30yr · 1.5% tax · 5.0% vac · 8.0% maint · 8.0% mgmt
Financing live
Cash to close
- Down payment
- $54,875
- Closing costs
- $6,585
- Reserves months
- —
- Total cash needed
- —
Loan-product check · same deal, 3 products live
Conventional
25% down · 7.5% · 30yr
- Down + closing
- —
- Monthly P&I
- —
- Monthly cashflow
- —
- DSCR
- —
- Eligible?
- —
Personal DTI + credit; lowest rate.
DSCR
20% down · 8.5% · 30yr
- Down + closing
- —
- Monthly P&I
- —
- Monthly cashflow
- —
- DSCR
- —
- Eligible?
- —
No personal income docs; deal must DSCR.
Hard money
10% down · 12.0% · 12mo
- Down + closing
- —
- Monthly P&I
- —
- Monthly cashflow
- —
- DSCR
- —
- Eligible?
- —
Short-term bridge; refi at stabilization.
Rent comps 40 comps
| Address | Beds | Baths | Sqft | Rent | $/sqft | DOM | Units | Dist |
|---|---|---|---|---|---|---|---|---|
| 12932 Lake Fryer Converse, TX | 3.0 | 2.0 | 1230 | $1,200 | $0.98 | 3d | 1 | 0.11mi |
| 3414 Jacobs Wls Saint Hedwig, TX | 3.0 | 2.0 | 1450 | $1,325 | $0.91 | 4d | 1 | 0.17mi |
| 3923 Ivy Path Saint Hedwig, TX | 3.0 | 2.0 | 1445 | $1,600 | $1.11 | 24d | 1 | 0.25mi |
| 12942 Deep Eddy Saint Hedwig, TX | 3.0 | 2.0 | 1129 | $1,495 | $1.32 | 43d | 1 | 0.28mi |
| 13015 Kathleen St Saint Hedwig, TX | 3.0 | 2.0 | 1235 | $1,540 | $1.25 | 24d | 1 | 0.30mi |
| 13015 Kathleen St Saint Hedwig, TX | 3.0 | 2.0 | 1235 | $1,540 | $1.25 | 21d | 1 | 0.30mi |
| 13015 Red Elks Lks Saint Hedwig, TX | 3.0 | 2.0 | 1445 | $1,650 | $1.14 | 2d | 1 | 0.30mi |
| 3921 Abbott Pass Unit 101 St Hedwig, TX | 3.0 | 2.5 | 1345 | $1,595 | $1.19 | 11d | 1 | 0.34mi |
| 3925 Abbott Pass Unit 101 St Hedwig, TX | 3.0 | 2.5 | 1345 | $1,450 | $1.08 | 43d | 1 | 0.35mi |
| 3933 Abbott Pass Unit 101 St Hedwig, TX | 3.0 | 2.5 | 1345 | $1,450 | $1.08 | 24d | 1 | 0.35mi |
| 3937 Abbott Pass Unit 102 St Hedwig, TX | 3.0 | 2.5 | 1345 | $1,495 | $1.11 | 43d | 1 | 0.35mi |
| 3815 Abbott Pass Unit 102 St Hedwig, TX | 3.0 | 2.5 | 1345 | $1,450 | $1.08 | 43d | 1 | 0.36mi |
| 3909 Asher Aly Saint Hedwig, TX | 3.0–4.0 | 2.0–2.5 | 1575 | $1,670 | $1.06 | 1d | 1 | 0.37mi |
| 3932 Abbott Pass Unit 102 St Hedwig, TX | 3.0 | 2.5 | 1345 | $1,495 | $1.11 | 24d | 1 | 0.38mi |
| 3936 Abbott Pass Unit 101 St Hedwig, TX | 3.0 | 2.5 | 1345 | $1,450 | $1.08 | 21d | 1 | 0.38mi |
| 4211 Asher Aly Saint Hedwig, TX | 3.0 | 2.0 | 1248 | $1,438 | $1.15 | 3d | 1 | 0.42mi |
| 13019 Lineberry Ln Saint Hedwig, TX | 3.0 | 2.0 | 1689 | $1,638 | $0.97 | 14d | 1 | 0.44mi |
| 4241 Fort Palmer Blvd Saint Hedwig, TX | 3.0 | 2.5 | 1858 | $1,880 | $1.01 | 2d | 1 | 0.49mi |
| 13014 Candace Way Converse, TX | 3.0 | 2.5 | 1553 | $1,675 | $1.08 | 4d | 1 | 0.51mi |
| 13038 Candace Way Converse, TX | 3.0 | 2.5 | 1689 | $1,675 | $0.99 | 4d | 1 | 0.51mi |
| 13023 Heathers Elm Saint Hedwig, TX | 3.0 | 2.0 | 1234 | $1,500 | $1.22 | 1d | 1 | 0.69mi |
| 4522 Heathers Cross Saint Hedwig, TX | 3.0 | 2.0 | 1652 | $1,900 | $1.15 | 16d | 1 | 0.82mi |
| 4614 Heathers Cross Saint Hedwig, TX | 3.0 | 2.0 | 1770 | $1,850 | $1.05 | 24d | 1 | 0.83mi |
| 4522 Meerkat Converse, TX | 3.0 | 2.0 | 1489 | $1,750 | $1.18 | 11d | 1 | 0.85mi |
| 4918 Valenzuela Converse, TX | 3.0–4.0 | 2.0–2.5 | 1719 | $2,144 | $1.25 | 1d | 82 | 0.87mi |
| 13111 Bay Point Way Saint Hedwig, TX | 3.0 | 2.0 | 1642 | $1,595 | $0.97 | 24d | 1 | 1.07mi |
| 13302 Savory Pl Converse, TX | 3.0 | 2.0 | 1217 | $1,499 | $1.23 | 12d | 1 | 1.11mi |
| 5424 Thyme Cor Saint Hedwig, TX | 4.0 | 2.0 | 1667 | $1,450 | $0.87 | 20d | 1 | 1.12mi |
| 13014 Rosemary Cv Saint Hedwig, TX | 3.0 | 2.0 | 1479 | $1,800 | $1.22 | 24d | 1 | 1.15mi |
| 5333 Basil Chase Converse, TX | 3.0 | 2.0 | 1474 | $1,680 | $1.14 | 14d | 1 | 1.18mi |
| 12922 Sage Turn Saint Hedwig, TX | 4.0 | 2.0 | 1667 | $1,597 | $0.96 | 24d | 1 | 1.18mi |
| 5510 Basil Chase St Hedwig, TX | 3.0 | 2.0 | 1217 | $1,625 | $1.34 | 17d | 1 | 1.21mi |
| 13505 Sunrise Mdw Saint Hedwig, TX | 3.0 | 2.0 | 1111 | $1,671 | $1.50 | 4d | 1 | 1.24mi |
| 5135 Morning Graze Saint Hedwig, TX | 3.0 | 2.0 | 1211 | $1,575 | $1.30 | 21d | 1 | 1.25mi |
| 13551 Lunar Lgt Saint Hedwig, TX | 3.0 | 2.0 | 1211 | $1,550 | $1.28 | 24d | 1 | 1.27mi |
| 5330 Lisa Pt Converse, TX | 3.0 | 2.5 | 1250 | $1,450 | $1.16 | 1d | 1 | 1.30mi |
| 5546 Basil Chase Converse, TX | 3.0 | 2.0 | 1217 | $1,829 | $1.50 | 3d | 1 | 1.30mi |
| 13603 Lunar Lgt Saint Hedwig, TX | 3.0 | 2.0 | 1200 | $1,500 | $1.25 | 24d | 1 | 1.31mi |
| 13603 Lunar Lgt Saint Hedwig, TX | 3.0 | 2.0 | 1209 | $1,475 | $1.22 | 16d | 1 | 1.31mi |
| 5214 Winding Strm Saint Hedwig, TX | 3.0 | 2.0 | 1398 | $1,500 | $1.07 | 17d | 1 | 1.33mi |
HOA detail
- Monthly dues
- $17 · $204/yr
Listing history 18 events
-
2026-06-18days on market $219,500 Active 66 DOM
-
2026-06-17days on market $219,500 Active 65 DOM
-
2026-06-16days on market $219,500 Active 64 DOM
-
2026-06-15days on market $219,500 Active 63 DOM
-
2026-06-13days on market $219,500 Active 61 DOM
-
2026-06-09days on market $219,500 Active 57 DOM
-
2026-06-08days on market $219,500 Active 56 DOM
-
2026-06-07days on market $219,500 Active 55 DOM
-
2026-06-04days on market $219,500 Active 52 DOM
-
2026-06-03days on market $219,500 Active 51 DOM
-
2026-06-02statusdays on market $219,500 Active 50 DOM
-
2026-06-01days on market $219,500 Price Change 49 DOM
-
2026-05-31days on market $219,500 Price Change 48 DOM
-
2026-04-13$220,000 New 534-char remark
Show marketing remark (534 chars)
*Seller is willing to assist with closing costs or a rate buy-down through preferred lender with an acceptable offer. The Hoffman- This single-level home showcases a spacious open floorplan shared between the kitchen, dining area and family room for easy entertaining. An owner's suite enjoys a private location at the front of the home, complemented by an en-suite bathroom and walk-in closet. There are three secondary bedrooms just off the main living areas, which are comfortable spaces for household members and overnight guests.
-
2026-03-27soldstatus Sold 605-char remark
Show marketing remark (605 chars)
The Hoffman- This single-level home showcases a spacious open floorplan shared between the kitchen, dining area and family room for easy entertaining. An owner's suite enjoys a private location at the front of the home, complemented by an en-suite bathroom and walk-in closet. There are three secondary bedrooms just off the main living areas, which are comfortable spaces for household members and overnight guests. Estimated Completion April 2026. The completion date, prices and features may vary and are subject to change. Please verify with Lennar directly. Photos are for illustrative purposes only.
-
2026-03-04status Pending 605-char remark
Show marketing remark (605 chars)
The Hoffman- This single-level home showcases a spacious open floorplan shared between the kitchen, dining area and family room for easy entertaining. An owner's suite enjoys a private location at the front of the home, complemented by an en-suite bathroom and walk-in closet. There are three secondary bedrooms just off the main living areas, which are comfortable spaces for household members and overnight guests. Estimated Completion April 2026. The completion date, prices and features may vary and are subject to change. Please verify with Lennar directly. Photos are for illustrative purposes only.
-
2026-02-24price $234,999 605-char remark
Show marketing remark (605 chars)
The Hoffman- This single-level home showcases a spacious open floorplan shared between the kitchen, dining area and family room for easy entertaining. An owner's suite enjoys a private location at the front of the home, complemented by an en-suite bathroom and walk-in closet. There are three secondary bedrooms just off the main living areas, which are comfortable spaces for household members and overnight guests. Estimated Completion April 2026. The completion date, prices and features may vary and are subject to change. Please verify with Lennar directly. Photos are for illustrative purposes only.
-
2026-01-19$239,999 New 605-char remark
Show marketing remark (605 chars)
The Hoffman- This single-level home showcases a spacious open floorplan shared between the kitchen, dining area and family room for easy entertaining. An owner's suite enjoys a private location at the front of the home, complemented by an en-suite bathroom and walk-in closet. There are three secondary bedrooms just off the main living areas, which are comfortable spaces for household members and overnight guests. Estimated Completion April 2026. The completion date, prices and features may vary and are subject to change. Please verify with Lennar directly. Photos are for illustrative purposes only.
ⓘ Source: listings_history table (triggers on properties + properties_extension) + one-shot
backfill from property_details.listing_events for pre-trigger history.
Tax reassessment forecast TX · Resets to sale price
- Current annual tax
- $566 · $47/mo
- Projected year-2 tax
- $4,017 · $335/mo
- Expected delta
- +$3,451/yr (+$288/mo · 609.8%)
ⓘ Screening estimate from a state-policy table — verify with the county assessor before closing.
Nearby sold comps map
Loading sold comps map…
Walkable amenities ~0.75 mi
Loading nearby amenities…
Taxation est. · year 1
- Rental income
- $21,128
- − Mortgage interest
- −$12,295
- − Property taxes
- −$566
- − Insurance
- −$1,098
- − Repairs & maintenance
- −$1,690
- − Management
- −$1,690
- − HOA
- −$204
- − Depreciation
- −$6,385
- Taxable loss
- −$2,801
- Est. tax savings @ 24.0%
- +$672
- After-tax cash flow
- $1,683/yr
For passive investors: Depreciation is non-cash, so a rental often shows a tax loss while cash-flowing — sheltering income. Rental losses are passive: they offset passive income freely, and up to $25,000/yr can offset ordinary (W-2) income if you actively participate and your MAGI is under $100k (phasing out to $0 by $150k); unused losses carry forward. On sale, claimed depreciation is recaptured at up to 25%, and gains may owe capital-gains tax (a 1031 exchange can defer both). Figures are a year-1 estimate at your 24.0% rate — not tax advice; consult a CPA.
Condition & rehab AI · 12 photos
This single-level home is in good condition with a spacious open floorplan and modern finishes. It is ready for a fresh coat of paint and new carpet to enhance its curb appeal and resale value.
Value-add opportunities
- Resale Paint the exterior siding — Fresh paint can enhance the curb appeal and make the home look more inviting.
- Resale Replace the carpet in the bedrooms — New carpet can improve the look and feel of the bedrooms.
- Rental Clean the air filters — Clean air filters can improve air quality and reduce energy costs, making the home more attractive to renters.
Renovation cost estimate screening
Value-add ROI direction
- Resale Paint the exterior siding — Fresh paint can enhance the curb appeal and make the home look more inviting. ↑
- Resale Replace the carpet in the bedrooms — New carpet can improve the look and feel of the bedrooms. ↑
- Rental Clean the air filters — Clean air filters can improve air quality and reduce energy costs, making the home more attractive to renters. ↑
ⓘ Cost ranges are severity-bucket heuristics (US national rule-of-thumb). Get contractor quotes + a written scope before underwriting a rehab budget.
Schools (NCES district)
- District
- East Central ISD
- NCES district ID
- 4817850
- Math proficiency
- 16% ▼ -12.00%
- Reading proficiency
- 25% ▼ -6.00%
- Median HH income
- $53,941
- Composite
- 18.67/100
- National rank
- #8887
- State rank
- #758 of 826 in TX
Livability — St. Hedwig
No livability data for this city. (Only ~50 U.S. cities are tracked.)
Census & demographics
- County
- Bexar County · 1,990,555 people
- City population
- 3,958
- Metro
- San Antonio-New Braunfels, TX
- Population (ZIP)
- 4,521
- Household income
- $123,981
- Rent vs Own
- Severe rent burden
- 27.0
Population outlook (Bexar County) Hauer SSP2
- Today (2025)
- 2,336,851 people
- By 2030
- 2,560,728 · +9.6%
- By 2040
- 3,020,569 · +29.3%
- By 2050
- 3,493,522 · +49.5%
- By 2075
- 4,668,459 · +99.8%
- By 2100
- 5,533,242 · +136.8%
Race, ethnicity, and origin ACS 2023
- Neighborhood character
- Diverse neighborhood (Simpson 0.58)
- Race & ethnicity
- White 56% Hispanic / Latino 31% Two or more races 21% Black 4%
- Hispanic origin (detail)
- Mexican 23% Puerto Rican 1%
- Common ancestry
- Romanian 17% Lithuanian 2% Slovak 2%
- Foreign-born
- 8% · Canada
- Languages at home
- 89% English-only · Spanish 10% Tagalog/Filipino 1%
Political lean MEDSL · Bexar
- 2024 margin
- Lean D (+9.8) · D 54.3% · R 44.6% · Other 1.1%
- 2008→2024 swing
- +4.2pp toward D · 2008: 5.6pp · 2024: 9.8pp
- All cycles
- 2024: D+9.8 2020: D+18.2 2016: D+13.5 2012: D+4.6 2008: D+5.6
Not yet ingested
- Civics
- —
Market trends
- HPI YoY
- ▲ 1.24%
- Current HPI
- 328.7859
- Rent YoY
- ▼ -0.90%
- Metro
- San Antonio-New Braunfels, TX
- State GDP YoY
- ▲ 3.95%
- F500 in state
- 110
Industry mix (Fortune 500 HQ in TX)
| Industry | F500 HQs | Revenue |
|---|---|---|
| Energy | 16 | $1,198B |
|
||
| Technology | 5 | $198B |
|
||
| Engineering / Construction | 4 | $72B |
|
||
| Energy Services | 3 | $60B |
|
||
| Utilities | 3 | $41B |
|
||
| Healthcare | 2 | $330B |
|
||
Price history
-8.3% since first listed5 events — show timeline
- 2026-04-13 Listed $220,000 LERA
- 2026-03-27 Sold (MLS) — LERA
- 2026-03-04 Pending — LERA
- 2026-02-24 Price Changed $234,999 LERA
- 2026-01-19 Listed $239,999 LERA
Property tax history
+17.1%/yrLatest (2025): $566 · +17.1% YoY. Source: county tax records.
Cash-flow waterfall
monthlySold comps — $/sqft
last 12 mo · ≤1 miLoading sold comps…