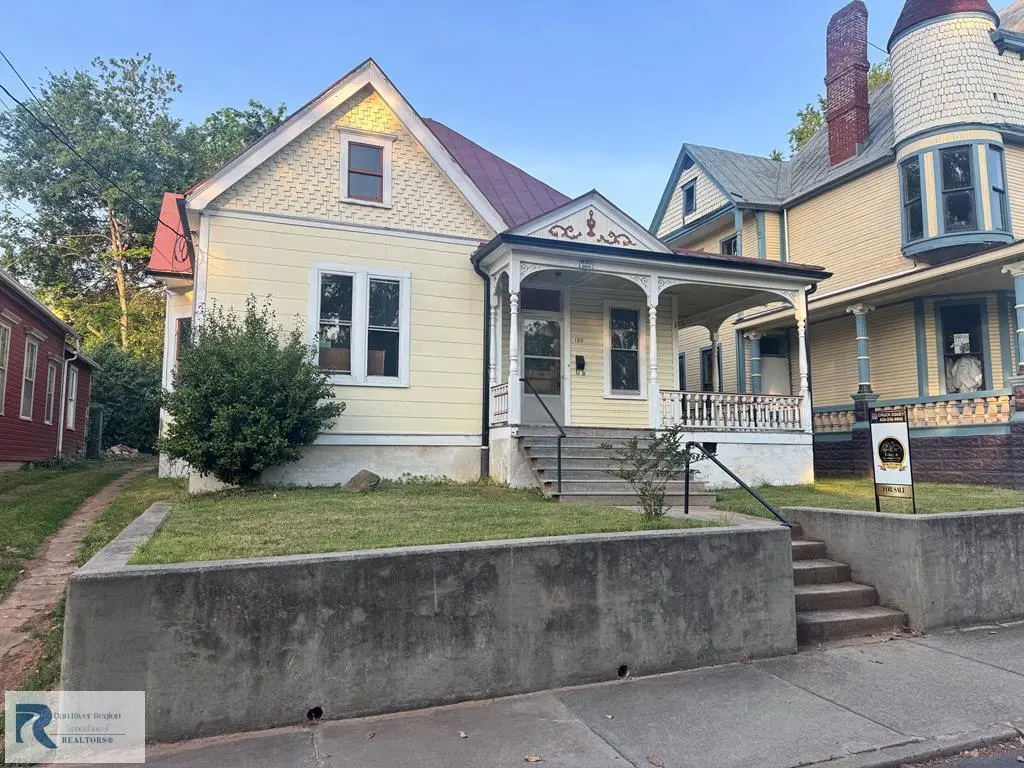
130 Chestnut St · Danville, VA
Flood risk 1/10 · Minimal
- FEMA flood zone
- X (unshaded)
- Chance of flooding over 30 yrs
- 0.0%
- Est. flood insurance / yr
- $507 – $1,088
Fire risk 1/10 · Minimal
- Est. fire insurance / yr
- $666 – $1,236
Heat risk 6/10 · Moderate
- Hot days now (above 104°F)
- 7 days/yr
- Hot days in 30 yrs
- 19 days/yr
Wind risk 4/10 · Minor
- Chance of severe wind over 30 yrs
- 8.0%
Air-quality risk 2/10 · Minimal
- Unhealthy air days now
- 0 days/yr
- Unhealthy air days in 30 yrs
- 1 days/yr
Risk factors via First Street. Map © Google.
Why this score? — see what drove the C- grade
The composite is a weighted blend of 9 inputs, each scored 0–100. Each bar is that input's sub-score; the figure is the points it added to the 100-point composite (weight × sub-score).
- Cash flow +20.8/30.0
- ARV discount +7.5/15.0
- DSCR +6.6/10.0
- 1% rule +5.5/10.0
- Livability +3.9/5.0
- Schools +3.0/10.0
- Rent growth +2.5/5.0
- Condition / age +2.5/5.0
- Appreciation +0.0/10.0
$120,000
🖨 Deal sheet (PDF) 📄 Offer letter ✓ Due diligence
Listing remarks
A work in progress. This property is being historically renovated from the ground up. Extremely detailed renovation but has quite a bit more to be done. Owner is updating as its on the market and price will increase as new projects are completed. Roof has had Graco Coating applied. Must sign a release to enter property.
Key facts
- Detailed renovation
- 3,485 sq ft lot
- Built 1904
Tags
Property features AI
Finance
- Other: Zoning: OTR
Exterior
- Parking: No garage
- Utilities: Public water; Public sewer
- Home design: Residential property; Located in Historical District
- Construction: Wood siding; Metal roof; Crawl space foundation; Built area above grade: 1,405
- Exterior features: Porch
Interior
- Bedrooms: 2 main level bedrooms
- Flooring: Wood floors
- Bathrooms: 1 full bathroom (main level)
- Heating & cooling: Natural gas heating; Electric heating
- Interior features: Entrance foyer; Two fireplaces
Neighborhood map
What this means for you Summary
Snapshot
- This is a 2-bed/1.0-bath single-family listed at $120k.
Deal economics
- At list price, monthly cash flow is $164 ($2k/yr) — positive.
- The deal already cash-flows at list — no discount required.
- Meets the 1% rule at list price ($1k rent vs $120k).
- Recommended offer: $116k (3.0% below list) — sets the bar for market timing.
- Cap rate 7.9% vs local median 5.2% in Danville — top-decile yield for the area; either an underpriced asset or a hidden risk that comps aren't pricing in. Stress-test before assuming the spread holds.
Location & tenants
- Location reads 77/100 on livability (#91 in VA, #2,952 nationally) — a middle-class / working-renter tenant base. Strengths: cost of living A+, housing A+, health & safety A+; Watch: amenities D+, crime D-, commute F.
- Danville City Public School District (town): math 30% / reading 44% proficiency, ranked #128 of 131 in VA (top 98%) — families likely to look elsewhere, expect single-tenant / working-renter base with shorter leases; 71% free/reduced lunch — lower-income household profile, screen leases tightly.
- Zoned schools: Forest Hills Elementary (math 47% / reading 62%, grade C, #650 of 1,108 statewide, top 62%, 209 students, 99% FRL); O. Trent Bonner Middle (math 33% / reading 53%, grade D-, #288 of 342 statewide, top 85%, 678 students, 91% FRL); George Washington High (math 44% / reading 54%, grade D, #300 of 319 statewide, top 94%, 1,309 students, 88% FRL) — zoned schools average 92% FRL vs 71% district-wide (21 pts higher); higher-poverty schools than district average — tighter screening recommended.
- Market conditions: 249 active listings in the ZIP; 15 comparable units currently listed for rent nearby; rentals lingering (median 46d on market — plan ~5-8 weeks vacancy on turnover, expect pricing pressure); 80% of comp listings sitting > 30 days — soft ceiling on asking rent; 54 units permitted in Danville city in 2024 (40 in 5+ unit buildings).
Forward outlook
- Local home prices are declining (-3.0%/yr); year-one equity from $830 of loan paydown is wiped out by about $4k of value loss. Plan a longer hold.
- Danville County population projected to shrink 7% by 2050 — rents likely to lag national; underwrite the cash flow, not the appreciation.
Negotiation context
- It's been on market 48 days — a 3% lower offer ($116k) is reasonable based on typical stale-listing flexibility.
- Current owner paid $20k; list at $120k implies a 500% gain — meaningful room to come down on a strong offer.
Risks & watch-outs
- Watch-outs: built in 1904 — expect roof / HVAC / electrical / plumbing capex.
- Climate carrying-cost: extreme-heat days projected 7→19/yr by 2055 (HVAC capex compounding) — expect insurance premiums to compound above CPI over the hold.
Questions for the listing agent
- It's been on market 48 days. Have you received any prior offers? Is the seller open to a 3% concession, seller financing, or rate buy-down credit?
- Built in 1904 — when were the roof, HVAC, electrical panel, plumbing, and water heater last replaced?
- Is there a deadline driving the sale (1031 exchange, divorce, estate, relocation)? That informs how much negotiation room exists.
- Schools are B-rated — typically a magnet for longer-tenancy family renters. What's the average tenant stay here, and is there a school-zone premium baked into asking?
- Crime grade is D in this area — have there been break-ins, vandalism, or insurance claims at this property in the last 3 years? What carrier currently insures it and at what premium?
- What's the average days-on-market for RENTAL listings here right now (not sales)? A rising rental-DOM trend means longer vacancies and softer asking-rent achievability than the comps imply.
- What's the recent tenant-quality profile in this submarket — average credit score on applications, eviction rate, late-payment / NSF rate, and stable-employment percentage? A property-management company in the area should have these aggregated.
- How much new for-sale + rental construction is in the pipeline within 1–3 miles? Heavy new supply typically softens prices + rents 12–24 months out; constrained supply supports both.
Investment metrics
- 1% rule
- 1.05% ✓
- Cap rate
- 7.93%
- Cash-on-cash
- 5.84%
- DSCR
- 1.26
- GRM
- 8.0
CMA / ARV
- ARV (median comp)
- $58,506
- List price
- $120,000
- Delta
- 105.11%
- Verdict
- OVERPRICED
- Comps
- 20 within 1.0 mi
Show comp detail 12 sales within ~0.75 mi
| Address | Dist | Beds/Ba | Sqft | Sold | Price | $/sf | Match |
|---|---|---|---|---|---|---|---|
| 724 Temple Ave | 0.34mi | 2/1.5 | 1,337 (-5%) | 5mo | $65,000 | $49 | 70 |
| 1206 Forest St | 0.48mi | 3/1.0 (+1) | 1,398 (-0%) | 6mo | $55,000 | $39 | 66 |
| 120 Clarendon Cir | 0.62mi | 3/1.0 (+1) | 1,419 (+1%) | 1mo | $123,600 | $87 | 64 |
| 1006 Paxton St | 0.26mi | 3/2.0 (+1) | 1,364 (-3%) | 15mo | $127,000 | $93 | 62 |
| 214 Broad St | 0.34mi | 3/2.5 (+1) | 1,430 (+2%) | 13mo | $210,000 | $147 | 59 |
| 827 Stokes St | 0.37mi | 3/1.0 (+1) | 1,286 (-8%) | 7mo | $27,000 | $21 | 58 |
| 134 Spruce St | 0.49mi | 3/1.5 (+1) | 1,525 (+8%) | 4mo | $198,000 | $130 | 52 |
| 816 Rison St | 0.41mi | 3/1.5 (+1) | 1,535 (+9%) | 9mo | $104,000 | $68 | 51 |
| 140 Mabin St | 0.69mi | 3/2.0 (+1) | 1,320 (-6%) | 13mo | $240,000 | $182 | 38 |
| 212 Montague St | 0.66mi | 3/1.0 (+1) | 1,548 (+10%) | 12mo | $149,000 | $96 | 37 |
| 635 Upper St | 0.57mi | 3/2.0 (+1) | 1,255 (-11%) | 16mo | $60,500 | $48 | 33 |
| 250 Manor Pl | 0.68mi | 3/1.5 (+1) | 1,590 (+13%) | 10mo | $120,000 | $75 | 31 |
Match score weights: distance 35% · size 25% · config 20% · recency 20%. Top-matched comps best support the ARV.
Projected returns pro-forma
-3.0% appreciation · 3.0% rent growth · sell at horizon
- IRR
- -7.3%
- Equity multiple
- 0.73×
- Total profit
- $-9,004
- Equity at exit
- $17,892
- IRR
- 2.4%
- Equity multiple
- 1.17×
- Total profit
- $5,657
- Equity at exit
- $10,375
Cash invested: $33,600 (down + closing). Projections, not guarantees.
Landlord ↔ Tenant lean methodology
- Overall (STATE)
- 55 Moderately Landlord-Leaning
- State Virginia
- 55 Moderately Landlord-Leaning · D+2
- County
- — inherits STATE
- City
- — inherits STATE
ZIP-level market 24541
- Home prices YoY
- -17.1%
- Active inventory
- 249
- Price-to-rent
- 8.0×
Monthly cashflow live
- Estimated rent
- $1,257 high interval (Pro) →
- Mortgage (P&I)
- −$629
- Tax est. 1.5%
- −$150 /mo · $1,800/yr
- Insurance
- −$50
- HOA
- −$0
- Vacancy / Maint / Mgmt
- −$264
- Net cashflow
- $164
Break-even live
Sensitivity live
| Price | -10% $247 | -5% $205 | +0% $164 | +5% $122 | +10% $81 |
|---|---|---|---|---|---|
| Rent | -10% $64 | -5% $114 | +0% $164 | +5% $213 | +10% $263 |
| Rate | -1.0pp $224 | -0.5pp $194 | base $164 | +0.5pp $133 | +1.0pp $101 |
UW: 25.0% down · 7.5% · 30yr · 1.5% tax · 5.0% vac · 8.0% maint · 8.0% mgmt
Financing live
Cash to close
- Down payment
- $30,000
- Closing costs
- $3,600
- Reserves months
- —
- Total cash needed
- —
Loan-product check · same deal, 3 products live
Conventional
25% down · 7.5% · 30yr
- Down + closing
- —
- Monthly P&I
- —
- Monthly cashflow
- —
- DSCR
- —
- Eligible?
- —
Personal DTI + credit; lowest rate.
DSCR
20% down · 8.5% · 30yr
- Down + closing
- —
- Monthly P&I
- —
- Monthly cashflow
- —
- DSCR
- —
- Eligible?
- —
No personal income docs; deal must DSCR.
Hard money
10% down · 12.0% · 12mo
- Down + closing
- —
- Monthly P&I
- —
- Monthly cashflow
- —
- DSCR
- —
- Eligible?
- —
Short-term bridge; refi at stabilization.
Rent comps 15 comps
| Address | Beds | Baths | Sqft | Rent | $/sqft | DOM | Units | Dist |
|---|---|---|---|---|---|---|---|---|
| 423 Chestnut St Unit 1 Danville, VA | 2.0 | 1.0 | 1200 | $1,400 | $1.17 | 45d | 1 | 0.02mi |
| 717 Temple Ave Danville, VA | 3.0 | 1.5 | 1327 | $1,179 | $0.89 | 45d | 1 | 0.35mi |
| 712 Edwin Ct Danville, VA | 2.0 | 1.0 | 969 | $700 | $0.72 | 45d | 1 | 0.38mi |
| 240 Lady Astor Pl Unit 241-10 Danville, VA | 2.0 | 1.5 | 1246 | $1,100 | $0.88 | 45d | 1 | 0.55mi |
| 240 Lady Astor Pl Unit 241-3 Danville, VA | 2.0 | 2.0 | 1246 | $1,130 | $0.91 | 45d | 1 | 0.55mi |
| 315 Lynn St Apt 404 Danville, VA | 2.0 | 2.0 | 1046 | $1,500 | $1.43 | 45d | 1 | 0.58mi |
| 614 Lynn St Apt 312 Danville, VA | 2.0 | 1.5 | 1200 | $929 | $0.77 | 45d | 1 | 0.64mi |
| 614 Lynn St Apt 303 Danville, VA | 2.0 | 2.0 | 1200 | $929 | $0.77 | 45d | 1 | 0.64mi |
| 345 Flint St Danville, VA | 2.0 | 1.0 | 888 | $1,200 | $1.35 | 45d | 1 | 0.66mi |
| 601 Bridge St Unit 117 Danville, VA | 2.0 | 2.0 | 1294 | $1,650 | $1.28 | 23d | 1 | 0.82mi |
| 601 Bridge St Unit 116 Danville, VA | 2.0 | 1.0 | 1294 | $1,575 | $1.22 | 45d | 1 | 0.82mi |
| 601 Bridge St Unit 15 Danville, VA | 2.0 | 1.0 | 1294 | $1,400 | $1.08 | 45d | 1 | 0.82mi |
| 601 Bridge St Unit 212 Danville, VA | 1.0 | 1.0 | 1046 | $1,300 | $1.24 | 23d | 1 | 0.82mi |
| 732 Hughes St Danville, VA | 2.0 | 1.0 | 900 | $1,800 | $2.00 | 45d | 1 | 1.40mi |
| 721 Chatham Ave Unit A Danville, VA | 3.0 | 1.0 | 950 | $1,350 | $1.42 | 15d | 1 | 1.49mi |
Listing history 21 events
-
2026-06-22days on market $120,000 Active 48 DOM
-
2026-06-21days on market $120,000 Active 47 DOM
-
2026-06-19days on market $120,000 Active 45 DOM
-
2026-06-18days on market $120,000 Active 44 DOM
-
2026-06-17days on market $120,000 Active 43 DOM
-
2026-06-16days on market $120,000 Active 42 DOM
-
2026-06-15days on market $120,000 Active 41 DOM
-
2026-06-14days on market $120,000 Active 39 DOM
-
2026-06-13days on market $120,000 Active 38 DOM
-
2026-06-10days on market $120,000 Active 36 DOM
-
2026-06-09days on market $120,000 Active 35 DOM
-
2026-06-08days on market $120,000 Active 34 DOM
-
2026-06-07days on market $120,000 Active 33 DOM
-
2026-06-05days on market $120,000 Active 30 DOM
-
2026-06-02days on market $120,000 Active 28 DOM
-
2026-06-01days on market $120,000 Active 27 DOM
-
2026-05-31days on market $120,000 Active 26 DOM
-
2026-05-30days on market $120,000 Active 25 DOM
-
2026-05-05$120,000 Active 321-char remark
-
2021-02-26soldstatus $20,000
-
2006-09-20soldstatus $24,500
ⓘ Source: listings_history table (triggers on properties + properties_extension) + one-shot
backfill from property_details.listing_events for pre-trigger history.
Climate risk First Street
- Flood 1/10 Low FEMA zone X (unshaded) · 0% chance over 30 yrs
- Wildfire 1/10 Low
- Heat 6/10 Major 7 d/yr ≥104°F today · 19 d/yr by 30 yrs out
- Wind 4/10 Moderate 8% chance of damaging wind over 30 yrs
- Air quality 2/10 Low 0 unhealthy d/yr today · 1 by 30 yrs out
Nearby sold comps map
Loading sold comps map…
Walkable amenities ~0.75 mi
Loading nearby amenities…
Taxation est. · year 1
- Rental income
- $15,083
- − Mortgage interest
- −$6,722
- − Property taxes
- −$1,800
- − Insurance
- −$600
- − Repairs & maintenance
- −$1,207
- − Management
- −$1,207
- − Depreciation
- −$3,491
- Taxable income
- $57
- Est. tax owed @ 24.0%
- −$14
- After-tax cash flow
- $1,950/yr
For passive investors: Depreciation is non-cash, so a rental often shows a tax loss while cash-flowing — sheltering income. Rental losses are passive: they offset passive income freely, and up to $25,000/yr can offset ordinary (W-2) income if you actively participate and your MAGI is under $100k (phasing out to $0 by $150k); unused losses carry forward. On sale, claimed depreciation is recaptured at up to 25%, and gains may owe capital-gains tax (a 1031 exchange can defer both). Figures are a year-1 estimate at your 24.0% rate — not tax advice; consult a CPA.
Schools (NCES district)
- District
- Danville City Public School District
- NCES district ID
- 5101110
- Math proficiency
- 30% ▼ -22.00%
- Reading proficiency
- 44% ▼ -8.00%
- Median HH income
- $31,952
- Composite
- 30.23/100
- National rank
- #6298
- State rank
- #128 of 131 in VA
Livability — Danville
- Score
- 77/100
- State rank
- #91
- US rank
- #2952
Category grades
Schools grade is shown separately in the Schools card above.
Census & demographics
- Census place
- Danville, VA
- County
- Danville City · 59,055 people
- City population
- 59,055
- Metro
- Danville, VA
- Population (ZIP)
- 28,042
- Household income
- $51,427
- Rent vs Own
- Severe rent burden
- 1399.0
Population outlook (Danville County) Hauer SSP2
- Today (2025)
- 40,989 people
- By 2030
- 40,432 · -1.4%
- By 2040
- 39,255 · -4.2%
- By 2050
- 38,035 · -7.2%
- By 2075
- 35,612 · -13.1%
- By 2100
- 30,365 · -25.9%
Race, ethnicity, and origin ACS 2023
- Neighborhood character
- Diverse neighborhood (Simpson 0.59)
- Race & ethnicity
- White 50% Black 39% Two or more races 7% Hispanic / Latino 5% Asian 2%
- Common ancestry
- Slovak 2% Serbian 2% Lithuanian 1%
- Foreign-born
- 4% · Canada, Dominican Republic
- Languages at home
- 95% English-only · Spanish 4% Other Indo-European 1%
Political lean MEDSL · Danville
- 2024 margin
- Strong D (+21.1) · D 60.1% · R 39.0%
- 2008→2024 swing
- +1.9pp toward D · 2008: 19.1pp · 2024: 21.1pp
- All cycles
- 2024: D+21.1 2020: D+22.1 2016: D+19.9 2012: D+22.1 2008: D+19.1
Not yet ingested
- Civics
- —
Market trends
- HPI YoY
- ▼ -49.28%
- Current HPI
- 238.5992
- Rent YoY
- —
- Metro
- Danville, VA
- State GDP YoY
- ▲ 2.40%
- F500 in state
- 50
Industry mix (Fortune 500 HQ in VA)
| Industry | F500 HQs | Revenue |
|---|---|---|
| Aerospace / Defense | 4 | $236B |
|
||
| Technology / Defense | 3 | $32B |
|
||
| Financial Services | 2 | $176B |
|
||
| Utilities | 2 | $27B |
|
||
| Insurance | 2 | $25B |
|
||
| Technology | 2 | $15B |
|
||
Price history
+389.8% since first listed3 events — show timeline
- 2026-05-05 Listed $120,000 DRRAR
- 2021-02-26 Sold (Public Records) $20,000 Public Records
- 2006-09-20 Sold (Public Records) $24,500 Public Records
Property tax history
-2.4%/yrLatest (2025): $185 · +0.0% YoY. Source: county tax records.
Cash-flow waterfall
monthlySold comps — $/sqft
last 12 mo · ≤1 miLoading sold comps…