 🏗️ New Construction
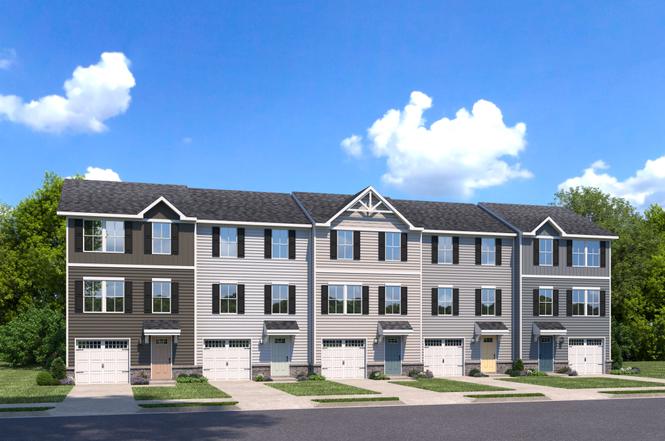
Juniper End Unit Plan · Garner, NC
Flood risk No data
- FEMA flood zone
- —
- Chance of flooding over 30 yrs
- —
- Est. flood insurance / yr
- —
Fire risk No data
- Est. fire insurance / yr
- —
Heat risk No data
- Hot days now (above threshold)
- —
- Hot days in 30 yrs
- —
Wind risk No data
- Chance of severe wind over 30 yrs
- —
Air-quality risk No data
- Unhealthy air days now
- —
- Unhealthy air days in 30 yrs
- —
Risk factors via First Street. Map © Google.
Why this score? — see what drove the D- grade
The composite is a weighted blend of 9 inputs, each scored 0–100. Each bar is that input's sub-score; the figure is the points it added to the 100-point composite (weight × sub-score).
- Cash flow +9.5/30.0
- ARV discount +7.5/15.0
- Schools +4.9/10.0
- Livability +3.8/5.0
- 1% rule +2.9/10.0
- Rent growth +2.9/5.0
- DSCR +2.7/10.0
- Condition / age +2.5/5.0
- Appreciation +0.0/10.0
$285,985
🖨 Deal sheet (PDF) 📄 Offer letter ✓ Due diligence
Listing remarks
The Juniper townhome combines all the amenities of single-family living with total convenience. The main level is highlighted by a gourmet kitchen that's open to the living area so you'll never miss a moment. Choose the optional island for more workspace. A dining area provides room for entertaining or cozy evenings at home. Upstairs, three large bedrooms offer plenty of closet space and a generous hall bath. The luxury owner's suite is a quiet retreat with its own full bath and huge walk-in closet. The lower level provides plenty of storage space. Discover all The Juniper has to offer.
Key facts
- Large bedrooms
- Gourmet kitchen
- Dining area
Tags
Property features AI
Finance
- Other: Address marketed as Juniper End Unit Plan, Raleigh, NC 27603; Status: Active
- Financial info: Listed as a new construction plan
- HOA & community:
Exterior
- Parking: 1 parking space
- Security:
- Utilities: Central air (listed under cooling)
- Home design: End unit plan (Juniper End Unit)
- Construction:
- Exterior features: Living area approximately 1564
Interior
- Kitchen:
- Bedrooms: 3 bedrooms
- Flooring:
- Bathrooms: 2 full bathrooms and 1 half bathroom (2.5 total)
- Heating & cooling: Central air conditioning
- Interior features: Open living area
- Laundry & utility:
Neighborhood map
What this means for you Summary
Snapshot
- This is a 3-bed/2.5-bath townhouse listed at $286k.
Deal economics
- At list price, monthly cash flow is $-210 ($-3k/yr) — negative.
- To cash-flow at today's rent, offer at most $275k (4.0% below list).
- To meet the 1% rule (rent ≥ 1% of price), the offer needs to be $240k (16.0% below list).
- Recommended offer: $240k (16.0% below list) — sets the bar for 1% rule.
- Cap rate 5.5% vs local median 3.3% in Garner — top-decile yield for the area; either an underpriced asset or a hidden risk that comps aren't pricing in. Stress-test before assuming the spread holds.
Location & tenants
- Location reads 76/100 on livability (#35 in NC, #3,421 nationally) — a middle-class / working-renter tenant base. Strengths: housing A+, commute A-, cost of living A-; Watch: amenities D, crime F.
- Wake County Schools (suburban): math 52% / reading 60% proficiency, ranked #35 of 178 in NC (top 20%) — acceptable for families but not a draw, mixed tenant base, ~2y average lease.
- Zoned schools: Vandora Springs Elementary (math 27% / reading 38%, grade F, #897 of 1,410 statewide, top 64%, 548 students, 72% FRL); North Garner Middle (math 29% / reading 38%, grade F, #299 of 475 statewide, top 64%, 975 students, 57% FRL); Garner High (math 32% / reading 56%, grade F, #367 of 535 statewide, top 69%, 1,683 students, 50% FRL) — zoned schools average 60% FRL vs 30% district-wide (29 pts higher); higher-poverty schools than district average — tighter screening recommended.
- Zoned-school proficiency averages 37% at this address vs 56% district-wide (-19 pts) — the specific schools serving this property underperform the Wake County Schools average; the district grade overstates school quality for this exact location.
- Market conditions: Rents rising (+1.6%/yr); 493 active listings in the ZIP; 3 comparable units currently listed for rent nearby; rentals at typical pace (median 26d on market — plan ~3-4 weeks tenant-placement turnaround); solid renter incomes; 15,249 units permitted in Wake County in 2024 (5,568 in 5+ unit buildings).
- This rent runs 32% of the median local income ($90k/yr) — at the standard rent-burdened threshold; future hikes will face affordability resistance.
Forward outlook
- Local home prices are declining (-3.0%/yr); year-one equity from $2k of loan paydown is wiped out by about $9k of value loss. Plan a longer hold.
- Wake County population projected at +51% by 2050 — long-run rental-demand tailwind backs the buy-and-hold thesis.
Negotiation context
- It's been on market 444 days — a 12% lower offer ($252k) is reasonable based on typical stale-listing flexibility.
Questions for the listing agent
- What do current leases actually rent for vs. the listed asking? Can we see a recent rent roll and the last 12 months of T-12 income?
- It's been on market 444 days. Have you received any prior offers? Is the seller open to a 16% concession, seller financing, or rate buy-down credit?
- Why hasn't it sold? Are there any deal-killer items the seller is aware of (foundation, flood, title, zoning, code violations)?
- Is there a deadline driving the sale (1031 exchange, divorce, estate, relocation)? That informs how much negotiation room exists.
- Schools are D-rated, which usually means shorter tenancies and higher turnover. Who's the typical renter profile here, and what's been the actual vacancy rate?
- Crime grade is F in this area — have there been break-ins, vandalism, or insurance claims at this property in the last 3 years? What carrier currently insures it and at what premium?
- The area grade is low — what's the realistic commute time and amenity access for the typical tenant pool here? Any planned neighborhood developments (good or bad) we should know about?
- What's the average days-on-market for RENTAL listings here right now (not sales)? A rising rental-DOM trend means longer vacancies and softer asking-rent achievability than the comps imply.
- What's the recent tenant-quality profile in this submarket — average credit score on applications, eviction rate, late-payment / NSF rate, and stable-employment percentage? A property-management company in the area should have these aggregated.
- How much new for-sale + rental construction is in the pipeline within 1–3 miles? Heavy new supply typically softens prices + rents 12–24 months out; constrained supply supports both.
Investment metrics
- 1% rule
- 0.79% ✗
- Cap rate
- 5.47%
- Cash-on-cash
- -2.95%
- DSCR
- 0.87
- GRM
- 10.6
CMA / ARV
- ARV (on-the-fly)
- $304,980
- Comps found
- 10
Show comp detail 10 sales within ~0.75 mi
| Address | Dist | Beds/Ba | Sqft | Sold | Price | $/sf | Match |
|---|---|---|---|---|---|---|---|
| 328 Grand Silo Rd | 0.09mi | 3/2.5 | 1,564 (0%) | 3mo | $271,390 | $174 | 93 |
| 137 Sunny Acres Rd | 0.03mi | 3/2.5 | 1,564 (0%) | 12mo | $298,915 | $191 | 89 |
| 290 Grand Silo Rd | 0.09mi | 3/2.5 | 1,564 (0%) | 9mo | $284,990 | $182 | 88 |
| 648 Pasture Ridge Rd | 0.11mi | 3/2.5 | 1,628 (+4%) | 0mo | $317,255 | $195 | 88 |
| 252 Grand Silo Rd | 0.10mi | 3/2.5 | 1,564 (0%) | 11mo | $305,301 | $195 | 86 |
| 1309 Rollman Farm Rd | 0.15mi | 3/2.5 | 1,628 (+4%) | 2mo | $321,075 | $197 | 84 |
| 1333 Rollman Farm Rd | 0.16mi | 3/2.5 | 1,628 (+4%) | 4mo | $307,125 | $189 | 83 |
| 1328 Rollman Farm Rd | 0.15mi | 3/2.5 | 1,630 (+4%) | 5mo | $316,580 | $194 | 81 |
| 1408 Rollman Farm Rd | 0.20mi | 3/2.5 | 1,674 (+7%) | 16mo | $339,755 | $203 | 66 |
| 1400 Rollman Farm Rd | 0.19mi | 3/2.5 | 1,674 (+7%) | 17mo | $353,740 | $211 | 66 |
Match score weights: distance 35% · size 25% · config 20% · recency 20%. Top-matched comps best support the ARV.
Projected returns pro-forma
-3.0% appreciation · 1.59% rent growth · sell at horizon
- IRR
- -22.8%
- Equity multiple
- 0.23×
- Total profit
- $-66,118
- Equity at exit
- $45,474
- IRR
- -21.2%
- Equity multiple
- -0.03×
- Total profit
- $-88,052
- Equity at exit
- $26,369
Cash invested: $85,394 (down + closing). Projections, not guarantees.
Landlord ↔ Tenant lean methodology
- Overall (STATE)
- 85 Strongly Landlord-Friendly
- State North Carolina
- 85 Strongly Landlord-Friendly · R+3
- County
- — inherits STATE
- City
- — inherits STATE
ZIP-level market 27603
- Rents YoY
- 1.6%
- Active inventory
- 493
- Price-to-rent
- 9.9×
Monthly cashflow live
- Estimated rent
- $2,402 medium interval (Pro) →
- Mortgage (P&I)
- −$1,599
- Tax est. 1.5%
- −$381 /mo · $4,575/yr
- Insurance
- −$127
- HOA
- −$0
- Vacancy / Maint / Mgmt
- −$504
- Net cashflow
- $-210
Break-even live
Sensitivity live
| Price | -10% $1 | -5% $-105 | +0% $-210 | +5% $-315 | +10% $-421 |
|---|---|---|---|---|---|
| Rent | -10% $-400 | -5% $-305 | +0% $-210 | +5% $-115 | +10% $-20 |
| Rate | -1.0pp $-56 | -0.5pp $-132 | base $-210 | +0.5pp $-289 | +1.0pp $-369 |
UW: 25.0% down · 7.5% · 30yr · 1.5% tax · 5.0% vac · 8.0% maint · 8.0% mgmt
Financing live
Cash to close
- Down payment
- $76,245
- Closing costs
- $9,149
- Reserves months
- —
- Total cash needed
- —
Loan-product check · same deal, 3 products live
Conventional
25% down · 7.5% · 30yr
- Down + closing
- —
- Monthly P&I
- —
- Monthly cashflow
- —
- DSCR
- —
- Eligible?
- —
Personal DTI + credit; lowest rate.
DSCR
20% down · 8.5% · 30yr
- Down + closing
- —
- Monthly P&I
- —
- Monthly cashflow
- —
- DSCR
- —
- Eligible?
- —
No personal income docs; deal must DSCR.
Hard money
10% down · 12.0% · 12mo
- Down + closing
- —
- Monthly P&I
- —
- Monthly cashflow
- —
- DSCR
- —
- Eligible?
- —
Short-term bridge; refi at stabilization.
Rent comps 3 comps
| Address | Beds | Baths | Sqft | Rent | $/sqft | DOM | Units | Dist |
|---|---|---|---|---|---|---|---|---|
| 112 Central Townes Way Raleigh, NC | 3.0 | 3.0 | 1672 | $1,925 | $1.15 | 25d | 1 | 1.27mi |
| 101 Decatur Dr Raleigh, NC | 3.0 | 2.5–3.0 | 2012 | $2,605 | $1.29 | 3d | 17 | 1.29mi |
| 1517 Wiljohn Rd Garner, NC | 3.0 | 2.0 | 1688 | $3,000 | $1.78 | 25d | 1 | 1.32mi |
Listing history 15 events
-
2026-06-21days on market $285,985 Active 444 DOM
-
2026-06-18days on market $285,985 Active 441 DOM
-
2026-06-17days on market $285,985 Active 440 DOM
-
2026-06-16days on market $285,985 Active 439 DOM
-
2026-06-15days on market $285,985 Active 438 DOM
-
2026-06-13days on market $285,985 Active 436 DOM
-
2026-06-13days on market $285,985 Active 435 DOM
-
2026-06-09days on market $285,985 Active 432 DOM
-
2026-06-08days on market $285,985 Active 431 DOM
-
2026-06-07days on market $285,985 Active 430 DOM
-
2026-06-05days on market $285,985 Active 427 DOM
-
2026-06-03days on market $285,985 Active 426 DOM
-
2026-06-02days on market $285,985 Active 425 DOM
-
2026-06-01days on market $285,985 Active 424 DOM
-
2026-05-31days on market $285,985 Active 423 DOM
ⓘ Source: listings_history table (triggers on properties + properties_extension) + one-shot
backfill from property_details.listing_events for pre-trigger history.
Nearby sold comps map
Loading sold comps map…
Walkable amenities ~0.75 mi
Loading nearby amenities…
Taxation est. · year 1
- Rental income
- $28,825
- − Mortgage interest
- −$17,084
- − Property taxes
- −$4,575
- − Insurance
- −$1,525
- − Repairs & maintenance
- −$2,306
- − Management
- −$2,306
- − Depreciation
- −$8,872
- Taxable loss
- −$7,842
- Est. tax savings @ 24.0%
- +$1,882
- After-tax cash flow
- $-638/yr
For passive investors: Depreciation is non-cash, so a rental often shows a tax loss while cash-flowing — sheltering income. Rental losses are passive: they offset passive income freely, and up to $25,000/yr can offset ordinary (W-2) income if you actively participate and your MAGI is under $100k (phasing out to $0 by $150k); unused losses carry forward. On sale, claimed depreciation is recaptured at up to 25%, and gains may owe capital-gains tax (a 1031 exchange can defer both). Figures are a year-1 estimate at your 24.0% rate — not tax advice; consult a CPA.
Schools (NCES district)
- District
- Wake County Schools
- NCES district ID
- 3704720
- Math proficiency
- 52% ▲ 2.00%
- Reading proficiency
- 60% ▲ 4.00%
- Median HH income
- $67,509
- Composite
- 49.41/100
- National rank
- #2010
- State rank
- #35 of 178 in NC
Livability — Garner
- Score
- 76/100
- State rank
- #35
- US rank
- #3421
Category grades
Schools grade is shown separately in the Schools card above.
Census & demographics
- Census place
- Garner, NC
- County
- Wake County · 1,216,256 people
- City population
- 55,242
- Metro
- Raleigh-Cary, NC
- Population (ZIP)
- 53,972
- Household income
- $90,484
- Rent vs Own
- Severe rent burden
- 1914.0
Population outlook (Wake County) Hauer SSP2
- Today (2025)
- 1,293,152 people
- By 2030
- 1,428,223 · +10.4%
- By 2040
- 1,698,188 · +31.3%
- By 2050
- 1,955,807 · +51.2%
- By 2075
- 2,520,273 · +94.9%
- By 2100
- 2,893,335 · +123.7%
Race, ethnicity, and origin ACS 2023
- Neighborhood character
- Diverse neighborhood (Simpson 0.57)
- Race & ethnicity
- White 62% Black 17% Hispanic / Latino 14% Two or more races 10% Asian 2%
- Hispanic origin (detail)
- Mexican 9% Puerto Rican 1%
- Common ancestry
- Serbian 3% Slovak 2% Italian 2%
- Foreign-born
- 10% · Canada, China
- Languages at home
- 85% English-only · Spanish 10% Other Indo-European 1% Arabic 1%
Political lean MEDSL · Wake
- 2024 margin
- Strong D (+25.5) · D 61.9% · R 36.4% · Other 1.7%
- 2008→2024 swing
- +11.1pp toward D · 2008: 14.4pp · 2024: 25.5pp
- All cycles
- 2024: D+25.5 2020: D+26.4 2016: D+20.5 2012: D+10.2 2008: D+14.4
Not yet ingested
- Civics
- —
Market trends
- HPI YoY
- ▼ -132.00%
- Current HPI
- 243.2963
- Rent YoY
- ▲ 1.59%
- Metro
- Raleigh-Cary, NC
- State GDP YoY
- ▲ 3.28%
- F500 in state
- 26
Industry mix (Fortune 500 HQ in NC)
| Industry | F500 HQs | Revenue |
|---|---|---|
| Financial Services | 2 | $213B |
|
||
| Retail | 2 | $95B |
|
||
| Industrial Conglomerate | 1 | $38B |
|
||
| Metals / Steel | 1 | $35B |
|
||
| Utilities | 1 | $30B |
|
||
| Industrial Machinery | 1 | $19B |
|
||
Cash-flow waterfall
monthlySold comps — $/sqft
last 12 mo · ≤1 miLoading sold comps…