2105 Eastside Ct · Augusta-Richmond County consolidated government (balance), GA
Flood risk 1/10 · Minimal
- FEMA flood zone
- X (unshaded)
- Chance of flooding over 30 yrs
- 0.0%
- Est. flood insurance / yr
- $507 – $1,088
Fire risk 1/10 · Minimal
- Est. fire insurance / yr
- $963 – $1,789
Heat risk 8/10 · Major
- Hot days now (above 107°F)
- 7 days/yr
- Hot days in 30 yrs
- 18 days/yr
Wind risk 6/10 · Moderate
- Chance of severe wind over 30 yrs
- 65.0%
Air-quality risk 3/10 · Minor
- Unhealthy air days now
- 3 days/yr
- Unhealthy air days in 30 yrs
- 3 days/yr
Risk factors via First Street. Map © Google.
Why this score? — see what drove the C+ grade
The composite is a weighted blend of 9 inputs, each scored 0–100. Each bar is that input's sub-score; the figure is the points it added to the 100-point composite (weight × sub-score).
- Cash flow +25.4/30.0
- ARV discount +15.0/15.0
- DSCR +8.4/10.0
- 1% rule +6.7/10.0
- Livability +2.5/5.0
- Condition / age +2.5/5.0
- Rent growth +2.4/5.0
- Schools +1.3/10.0
- Appreciation +0.0/10.0
$120,000
🖨 Deal sheet 📄 Offer letter ✓ Due diligence
Listing remarks MLS
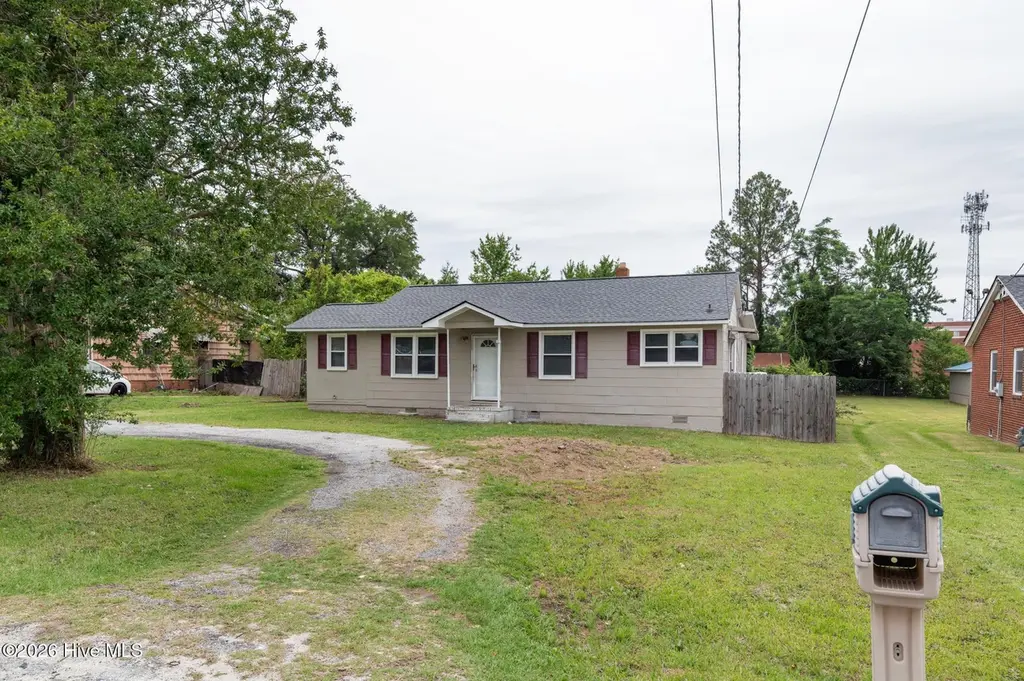
3 bedroom, 2 full bath, den and living room. Granite kitchen counters and huge workshop. Terrific investment home! Perfect for the investor that wants a quick rental. Awesome opportunity for a buyer that has renovation loan. Large home needs cosmetics and minor repairs. Newer roof and windows. Brand new HVAC system. Seller will consider including new stove and refrigerator with the right offer.
Key facts
- Real hardwood floors
- Newer master suite
- Huge family room
Tags
Property features AI
Finance
- HOA & community: Association amenities: other
Exterior
- Parking: 2 total parking spaces; 2-car attached garage; Circular driveway; Parking pad
- Utilities: Public water; Natural gas connected
- Home design: Single-family residence; One story; Entry level: 1; R1 zoning
- Construction: Construction details: see remarks
- Exterior features: Fenced yard; Patio/porch details: see remarks; Composition roof; Has a view; Paved road access
Interior
- Kitchen: Dishwasher; Electric range
- Flooring: Laminate; Tile; Vinyl; Hardwood
- Bathrooms: 2 full bathrooms
- Heating & cooling: Central air conditioning; Electric heating; Forced air; Natural gas heating
- Interior features: Eat-in kitchen; Crawl space basement
- Laundry & utility: Washer
Neighborhood map
What this means for you Summary
Snapshot
- This is a 3-bed/2.0-bath single-family listed at $120k.
Deal economics
- At list price, monthly cash flow is $276 ($3k/yr) — positive.
- The deal already cash-flows at list — no discount required.
- Meets the 1% rule at list price ($1k rent vs $120k).
- Recommended offer: $118k (1.5% below list) — sets the bar for market timing.
- Cap rate 9.0% vs local median 5.3% in Augusta-Richmond County consolidated government (balance) — top-decile yield for the area; either an underpriced asset or a hidden risk that comps aren't pricing in. Stress-test before assuming the spread holds.
Location & tenants
- Location reads: area grade C — affects rentability + tenant quality, not the cash-flow math above.
- Richmond County (urban): math 12% / reading 20% proficiency, ranked #154 of 174 in GA (top 88%) — low school quality limits family demand, transient renter base, plan for 1-2y turnover; 72% free/reduced lunch — lower-income household profile, screen leases tightly.
- Zoned schools: Richmond Hill K-8 (math 4% / reading 10%, grade F, #1,152 of 1,228 statewide, top 94%, 1,174 students, 98% FRL) — zoned schools average 98% FRL vs 72% district-wide (26 pts higher); higher-poverty schools than district average — tighter screening recommended.
- Market conditions: Rents soft (-0.2%/yr); 364 active listings in the ZIP; 11 comparable units currently listed for rent nearby; rentals lingering (median 44d on market — plan ~5-8 weeks vacancy on turnover, expect pricing pressure); 64% of comp listings sitting > 30 days — soft ceiling on asking rent; 561 units permitted in Richmond County in 2024 (0 in 5+ unit buildings).
- This rent runs 37% of the median local income ($46k/yr) — at the standard rent-burdened threshold; future hikes will face affordability resistance.
Forward outlook
- Local home prices are declining (-3.0%/yr); year-one equity from $830 of loan paydown is wiped out by about $4k of value loss. Plan a longer hold.
- Richmond County population projected to shrink 5% by 2050 — rents likely to lag national; underwrite the cash flow, not the appreciation.
Negotiation context
- It's been on market 29 days — a 2% lower offer ($118k) is reasonable based on typical stale-listing flexibility.
- 5 sale attempts since 21y ago; this cycle's ask has dropped $20k (14%) from the opening price — seller is motivated, your offer sets the floor, not the list.
- Current owner paid $50k; list at $120k implies a 140% gain — meaningful room to come down on a strong offer.
Risks & watch-outs
- Watch-outs: built in 1953 — expect roof / HVAC / electrical / plumbing capex.
- Climate carrying-cost: major wind risk, 65% chance of damaging wind over 30y; extreme-heat days projected 7→18/yr by 2055 (HVAC capex compounding) — expect insurance premiums to compound above CPI over the hold.
Questions for the listing agent
- Built in 1953 — when were the roof, HVAC, electrical panel, plumbing, and water heater last replaced?
- Is there a deadline driving the sale (1031 exchange, divorce, estate, relocation)? That informs how much negotiation room exists.
- What's the average days-on-market for RENTAL listings here right now (not sales)? A rising rental-DOM trend means longer vacancies and softer asking-rent achievability than the comps imply.
- What's the recent tenant-quality profile in this submarket — average credit score on applications, eviction rate, late-payment / NSF rate, and stable-employment percentage? A property-management company in the area should have these aggregated.
- How much new for-sale + rental construction is in the pipeline within 1–3 miles? Heavy new supply typically softens prices + rents 12–24 months out; constrained supply supports both.
Investment metrics
- 1% rule
- 1.17% ✓
- Cap rate
- 9.05%
- Cash-on-cash
- 9.84%
- DSCR
- 1.44
- GRM
- 7.1
CMA / ARV
- ARV (on-the-fly)
- $182,930
- Comps found
- 12
Show comp detail 12 sales within ~0.75 mi
| Address | Dist | Beds/Ba | Sqft | Sold | Price | $/sf | Match |
|---|---|---|---|---|---|---|---|
| 2148 Eastside Ct | 0.28mi | 3/1.5 | 1,594 (-4%) | 1mo | $149,000 | $93 | 77 |
| 2131 Eastside Ct | 0.17mi | 3/2.0 | 1,597 (-4%) | 13mo | $193,000 | $121 | 75 |
| 2625 Blueberry Dr | 0.45mi | 3/2.0 | 1,653 (-1%) | 10mo | $147,500 | $89 | 70 |
| 2817 Fleming Dr | 0.44mi | 3/2.0 | 1,722 (+4%) | 6mo | $175,000 | $102 | 69 |
| 2046 Fernwood Circle Cir | 0.42mi | 4/2.0 (+1) | 1,758 (+6%) | 4mo | $193,900 | $110 | 62 |
| 3203 E Gerald Dr | 0.63mi | 3/2.0 | 1,583 (-5%) | 3mo | $180,000 | $114 | 60 |
| 2304 Lebaum Ct | 0.61mi | 3/2.0 | 1,765 (+6%) | 4mo | $137,000 | $78 | 58 |
| 2128 Howard RD Rd | 0.61mi | 3/2.0 | 1,628 (-2%) | 13mo | $170,000 | $104 | 57 |
| 2330 Harding Rd. Rd | 0.43mi | 3/2.0 | 1,496 (-10%) | 8mo | $169,000 | $113 | 56 |
| 2144 Reedale Avenue Ave | 0.29mi | 4/2.0 (+1) | 1,450 (-13%) | 8mo | $155,000 | $107 | 54 |
| 3029 Lonsdale Dr | 0.37mi | 4/2.5 (+1) | 1,836 (+10%) | 11mo | $210,000 | $114 | 49 |
| 2004 Denmark Dr | 0.69mi | 3/1.0 | 1,529 (-8%) | 3mo | $168,000 | $110 | 48 |
Match score weights: distance 35% · size 25% · config 20% · recency 20%. Top-matched comps best support the ARV.
Projected returns pro-forma
-3.0% appreciation · 0.0% rent growth · sell at horizon
- IRR
- -4.9%
- Equity multiple
- 0.82×
- Total profit
- $-5,995
- Equity at exit
- $17,892
- IRR
- 0.8%
- Equity multiple
- 1.05×
- Total profit
- $1,532
- Equity at exit
- $10,375
Cash invested: $33,600 (down + closing). Projections, not guarantees.
Landlord ↔ Tenant lean methodology
- Overall (STATE)
- 90 Strongly Landlord-Friendly
- State Georgia
- 90 Strongly Landlord-Friendly · R+3
- County
- — inherits STATE
- City
- — inherits STATE
ZIP-level market 30906
- Home prices YoY
- -21.6%
- Rents YoY
- -0.2%
- Active inventory
- 364
- Price-to-rent
- 7.1×
Monthly cashflow live
- Estimated rent
- $1,409 high interval (Pro) →
- Mortgage (P&I)
- −$629
- Tax from tax record
- −$158 /mo · $1,898/yr
- Insurance
- −$50
- HOA
- −$0
- Vacancy / Maint / Mgmt
- −$296
- Net cashflow
- $276
Break-even live
UW: 25.0% down · 7.5% · 30yr · 1.5% tax · 5.0% vac · 8.0% maint · 8.0% mgmt
Financing live
Cash to close
- Down payment
- $30,000
- Closing costs
- $3,600
- Reserves months
- —
- Total cash needed
- —
Loan-product check · same deal, 3 products live
Conventional
25% down · 7.5% · 30yr
- Down + closing
- —
- Monthly P&I
- —
- Monthly cashflow
- —
- DSCR
- —
- Eligible?
- —
Personal DTI + credit; lowest rate.
DSCR
20% down · 8.5% · 30yr
- Down + closing
- —
- Monthly P&I
- —
- Monthly cashflow
- —
- DSCR
- —
- Eligible?
- —
No personal income docs; deal must DSCR.
Hard money
10% down · 12.0% · 12mo
- Down + closing
- —
- Monthly P&I
- —
- Monthly cashflow
- —
- DSCR
- —
- Eligible?
- —
Short-term bridge; refi at stabilization.
Rent comps 11 comps
| Address | Beds | Baths | Sqft | Rent | $/sqft | DOM | Units | Dist |
|---|---|---|---|---|---|---|---|---|
| 2119 Lumpkin Rd Augusta, GA | 2.0 | 1.0–1.5 | 974 | $912 | $0.94 | 21d | 6 | 0.45mi |
| 2021 Fernwood Cir Augusta, GA | 4.0 | 2.0 | 1593 | $1,525 | $0.96 | 43d | 1 | 0.55mi |
| 2111 Cadden Rd Augusta, GA | 3.0 | 1.0 | 1100 | $1,150 | $1.05 | 43d | 1 | 0.64mi |
| 2349 Henry Cir Augusta, GA | 3.0 | 2.0 | 1940 | $1,795 | $0.93 | 43d | 1 | 1.03mi |
| 2204 Sandra Ct Augusta, GA | 4.0 | 2.0 | 1325 | $1,585 | $1.20 | 23d | 1 | 1.06mi |
| 2605 Shalimar Dr Augusta, GA | 4.0 | 2.0 | 1444 | $1,500 | $1.04 | 21d | 1 | 1.14mi |
| 1915 Dianne Dr Augusta, GA | 3.0 | 1.0 | 1196 | $1,236 | $1.03 | 43d | 1 | 1.28mi |
| 2484 Coleman Ave Augusta, GA | 4.0 | 1.0 | 1662 | $1,000 | $0.60 | 43d | 1 | 1.34mi |
| 1916 Preston Dr Augusta, GA | 3.0 | 1.5 | 1134 | $1,055 | $0.93 | 43d | 1 | 1.35mi |
| 2105 Hobson Ct Augusta, GA | 3.0 | 2.0 | 1700 | $1,375 | $0.81 | 14d | 1 | 1.37mi |
| 3444 Murphy Ct Augusta, GA | 3.0 | 1.0 | 1332 | $1,349 | $1.01 | 43d | 1 | 1.47mi |
Listing history 26 events
-
2026-06-18status $120,000 Active 29 DOM
-
2026-06-18days on market $120,000 Active Under Contract 29 DOM
-
2026-06-17days on market $120,000 Active Under Contract 28 DOM
-
2026-06-16days on market $120,000 Active Under Contract 27 DOM
-
2026-06-15days on market $120,000 Active Under Contract 26 DOM
-
2026-06-14days on market $120,000 Active Under Contract 24 DOM
-
2026-06-10days on market $120,000 Active Under Contract 21 DOM
-
2026-06-09days on market $120,000 Active Under Contract 20 DOM
-
2026-06-08days on market $120,000 Active Under Contract 19 DOM
-
2026-06-07statusdays on market $120,000 Active Under Contract 18 DOM
-
2026-06-03days on market $120,000 Active 14 DOM
-
2026-06-02days on market $120,000 Active 13 DOM
-
2026-06-01days on market $120,000 Active 12 DOM
-
2026-05-31days on market $120,000 Active 11 DOM
-
2026-05-30pricedays on market $120,000 Active 10 DOM
-
2026-05-20$140,000 Active
-
2019-04-22soldstatus $50,000
-
2019-04-15soldstatus $50,000 397-char remark
Show marketing remark (397 chars)
3 bedroom, 2 full bath, den and living room. Granite kitchen counters and huge workshop. Terrific investment home! Perfect for the investor that wants a quick rental. Awesome opportunity for a buyer that has renovation loan. Large home needs cosmetics and minor repairs. Newer roof and windows. Brand new HVAC system. Seller will consider including new stove and refrigerator with the right offer.
-
2019-03-20$59,950 397-char remark
Show marketing remark (397 chars)
3 bedroom, 2 full bath, den and living room. Granite kitchen counters and huge workshop. Terrific investment home! Perfect for the investor that wants a quick rental. Awesome opportunity for a buyer that has renovation loan. Large home needs cosmetics and minor repairs. Newer roof and windows. Brand new HVAC system. Seller will consider including new stove and refrigerator with the right offer.
-
2005-03-29soldstatus $84,800
-
2005-03-25soldstatus $84,740
-
2005-03-25soldstatus $84,740
-
2005-01-05$83,900
-
2005-01-05$83,900
ⓘ Source: listings_history table (triggers on properties + properties_extension) + one-shot
backfill from property_details.listing_events for pre-trigger history.
Tax reassessment forecast GA · Resets to sale price
- Current annual tax
- $1,898 · $158/mo
- Projected year-2 tax
- $1,898 · $158/mo
- Expected delta
- $0/yr ($0/mo · 0.0%)
ⓘ Screening estimate from a state-policy table — verify with the county assessor before closing.
Climate risk First Street
- Flood 1/10 Low FEMA zone X (unshaded) · 0% chance over 30 yrs
- Wildfire 1/10 Low
- Heat 8/10 Severe 7 d/yr ≥107°F today · 18 d/yr by 30 yrs out
- Wind 6/10 Major 65% chance of damaging wind over 30 yrs
- Air quality 3/10 Moderate 3 unhealthy d/yr today · 3 by 30 yrs out
Nearby sold comps map
Loading sold comps map…
Walkable amenities ~0.75 mi
Loading nearby amenities…
Taxation est. · year 1
- Rental income
- $16,908
- − Mortgage interest
- −$6,722
- − Property taxes
- −$1,898
- − Insurance
- −$600
- − Repairs & maintenance
- −$1,353
- − Management
- −$1,353
- − Depreciation
- −$3,491
- Taxable income
- $1,491
- Est. tax owed @ 24.0%
- −$358
- After-tax cash flow
- $2,949/yr
For passive investors: Depreciation is non-cash, so a rental often shows a tax loss while cash-flowing — sheltering income. Rental losses are passive: they offset passive income freely, and up to $25,000/yr can offset ordinary (W-2) income if you actively participate and your MAGI is under $100k (phasing out to $0 by $150k); unused losses carry forward. On sale, claimed depreciation is recaptured at up to 25%, and gains may owe capital-gains tax (a 1031 exchange can defer both). Figures are a year-1 estimate at your 24.0% rate — not tax advice; consult a CPA.
Schools (NCES district)
- District
- Richmond County
- NCES district ID
- 1304380
- Math proficiency
- 12% ▼ -9.00%
- Reading proficiency
- 20% ▼ -6.00%
- Median HH income
- $38,069
- Composite
- 13.43/100
- National rank
- #9524
- State rank
- #154 of 174 in GA
Livability — Augusta-Richmond County consolidated government (balance)
No livability data for this city. (Only ~50 U.S. cities are tracked.)
Census & demographics
- Census place
- Augusta-Richmond County consolidated government (balance), GA
- County
- Richmond County · 190,917 people
- City population
- 154,035
- Metro
- Augusta-Richmond County, GA-SC
- Population (ZIP)
- 60,423
- Household income
- $45,999
- Rent vs Own
- Severe rent burden
- 3363.0
Population outlook (Richmond County) Hauer SSP2
- Today (2025)
- 200,753 people
- By 2030
- 200,232 · -0.3%
- By 2040
- 196,813 · -2.0%
- By 2050
- 190,347 · -5.2%
- By 2075
- 172,496 · -14.1%
- By 2100
- 146,284 · -27.1%
Race, ethnicity, and origin ACS 2023
- Neighborhood character
- Majority Black (64%)
- Race & ethnicity
- Black 64% White 27% Two or more races 5% Hispanic / Latino 5%
- Common ancestry
- Lithuanian 1%
- Foreign-born
- 2% · Canada
- Languages at home
- 95% English-only · Spanish 3% German/W. Germanic 1%
Political lean MEDSL · Richmond
- 2024 margin
- Solid D (+36.1) · D 67.8% · R 31.7%
- 2008→2024 swing
- +4.3pp toward D · 2008: 31.8pp · 2024: 36.1pp
- All cycles
- 2024: D+36.1 2020: D+37.2 2016: D+32.4 2012: D+33.8 2008: D+31.8
Not yet ingested
- Civics
- —
Market trends
- HPI YoY
- ▼ -58.99%
- Current HPI
- 213.5733
- Rent YoY
- ▼ -0.25%
- Metro
- Augusta-Richmond County, GA-SC
- State GDP YoY
- ▲ 2.66%
- F500 in state
- 28
Industry mix (Fortune 500 HQ in GA)
| Industry | F500 HQs | Revenue |
|---|---|---|
| Paper / Packaging | 2 | $29B |
|
||
| Retail | 1 | $160B |
|
||
| Transportation / Logistics | 1 | $91B |
|
||
| Airlines | 1 | $62B |
|
||
| Consumer Goods | 1 | $47B |
|
||
| Utilities | 1 | $25B |
|
||
Price history
+66.9% since first listed11 events — show timeline
- 2026-05-20 Listed $140,000 Hive MLS
- 2019-04-22 Sold (Public Records) $50,000 Public Records
- 2019-04-15 Sold (MLS) $50,000 Hive MLS
- 2019-04-15 Sold (MLS) $50,000 Hive MLS
- 2019-03-20 Listed $59,950 Hive MLS
- 2019-03-20 Listed $59,950 Hive MLS
- 2005-03-29 Sold (Public Records) $84,800 Public Records
- 2005-03-25 Sold (MLS) $84,740 Hive MLS
- 2005-03-25 Sold (MLS) $84,740 Hive MLS
- 2005-01-05 Listed $83,900 Hive MLS
- 2005-01-05 Listed $83,900 Hive MLS
Property tax history
+1.3%/yrLatest (2025): $1,898 · +2.5% YoY. Source: county tax records.
Cash-flow waterfall
monthlySold comps — $/sqft
last 12 mo · ≤1 miLoading sold comps…