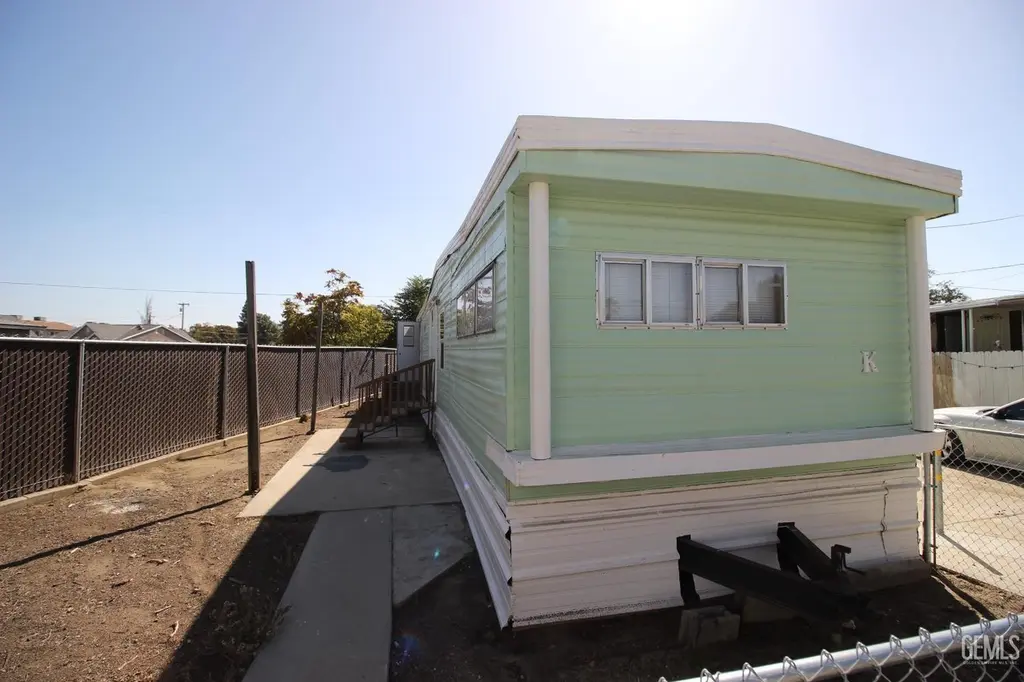
405 McCord Ave Unit K · Oildale, CA
Flood risk 1/10 · Minimal
- FEMA flood zone
- X (unshaded)
- Chance of flooding over 30 yrs
- 0.0%
- Est. flood insurance / yr
- $507 – $1,088
Fire risk 3/10 · Minor
- Est. fire insurance / yr
- $659 – $1,223
Heat risk 8/10 · Major
- Hot days now (above 105°F)
- 7 days/yr
- Hot days in 30 yrs
- 18 days/yr
Wind risk 1/10 · Minimal
- Chance of severe wind over 30 yrs
- —
Air-quality risk 10/10 · Severe
- Unhealthy air days now
- 39 days/yr
- Unhealthy air days in 30 yrs
- 45 days/yr
Risk factors via First Street. Map © Google.
Why this score? — see what drove the B+ grade
The composite is a weighted blend of 9 inputs, each scored 0–100. Each bar is that input's sub-score; the figure is the points it added to the 100-point composite (weight × sub-score).
- Cash flow +30.0/30.0
- ARV discount +15.0/15.0
- 1% rule +10.0/10.0
- DSCR +10.0/10.0
- Rent growth +3.1/5.0
- Livability +2.9/5.0
- Appreciation +2.7/10.0
- Condition / age +2.5/5.0
- Schools +1.0/10.0
$37,000
🖨 Deal sheet 📄 Offer letter ✓ Due diligence
Listing remarks MLS
McCord Mobile Village gated community split wing 2 bed 2 bath Mobile Home at an affordable price and a low $575.00 space rent. This Mobile Home features New carpet, fresh exterior paint, white stove and fridge in the kitchen area, ice cold central a/c system, fenced yards and much more.
Key facts
- Gated community
- White fridge
- New carpet
Tags
Property features AI
Finance
- Other: Located in the McCord Village park; Property area source: Assessor's data
- HOA & community: Sidewalks in the community; Land lease of $575 (land lease required)
Exterior
- Utilities: Public sewer; District/public water
- Home design: Single-story mobile home; Mobile dimensions approximately 12' x 60'; Mobile home remains on site
- Construction: Year built per assessor; Built on a foundation suitable for a mobile home
- Exterior features: No pool; Lot roughly 0–1 unit per acre; Located in a mobile home park (McCord Village)
Interior
- Bathrooms: 1 full bathroom; 1 three-quarter bathroom
- Heating & cooling: Central cooling
- Interior features: One-level home; Side entry
- Laundry & utility: No laundry on site
Neighborhood map
What this means for you Summary
Snapshot
- This is a 2-bed/2.0-bath manufactured listed at $37k.
Deal economics
- At list price, monthly cash flow is $594 ($7k/yr) — positive.
- The deal already cash-flows at list — no discount required.
- Meets the 1% rule at list price ($1k rent vs $37k).
- Recommended offer: $36k (3.0% below list) — sets the bar for market timing.
- Cap rate 25.6% vs local median 3.9% in Oildale — top-decile yield for the area; either an underpriced asset or a hidden risk that comps aren't pricing in. Stress-test before assuming the spread holds.
Location & tenants
- Location reads 58/100 on livability (#680 in CA) — a working-class tenant base; expect higher turnover. Strengths: housing A+, schools B+; Watch: crime F, amenities F, commute F.
- Beardsley Elementary (suburban): math 7% / reading 18% proficiency, ranked #501 of 517 in CA (top 97%) — low school quality limits family demand, transient renter base, plan for 1-2y turnover; 76% free/reduced lunch — lower-income household profile, screen leases tightly.
- Market conditions: Rents rising (+2.2%/yr); 307 active listings in the ZIP; 19 comparable units currently listed for rent nearby; rentals leasing fast (median 3d on market — plan ~1-2 weeks tenant-placement turnaround); 3,244 units permitted in Kern County in 2024 (73 in 5+ unit buildings).
Forward outlook
- Local home prices are declining (-3.0%/yr); year-one equity from $256 of loan paydown is wiped out by about $1k of value loss. Plan a longer hold.
- Kern County population projected at +17% by 2050 — long-run rental-demand tailwind backs the buy-and-hold thesis.
- At projected returns (-3.0% appreciation + 2.2% rent growth), your $10k cash investment doubles in ~2 years — after that, you're playing with house money.
Negotiation context
- It's been on market 31 days — a 3% lower offer ($36k) is reasonable based on typical stale-listing flexibility.
- 3 sale attempts; this cycle's ask has dropped $2k (5%) from the opening price — seller is motivated, your offer sets the floor, not the list.
Risks & watch-outs
- Climate carrying-cost: extreme-heat days projected 7→18/yr by 2055 (HVAC capex compounding) — expect insurance premiums to compound above CPI over the hold.
Questions for the listing agent
- It's been on market 31 days. Have you received any prior offers? Is the seller open to a 3% concession, seller financing, or rate buy-down credit?
- Is there a deadline driving the sale (1031 exchange, divorce, estate, relocation)? That informs how much negotiation room exists.
- Schools are B-rated — typically a magnet for longer-tenancy family renters. What's the average tenant stay here, and is there a school-zone premium baked into asking?
- Crime grade is F in this area — have there been break-ins, vandalism, or insurance claims at this property in the last 3 years? What carrier currently insures it and at what premium?
- What's the average days-on-market for RENTAL listings here right now (not sales)? A rising rental-DOM trend means longer vacancies and softer asking-rent achievability than the comps imply.
- What's the recent tenant-quality profile in this submarket — average credit score on applications, eviction rate, late-payment / NSF rate, and stable-employment percentage? A property-management company in the area should have these aggregated.
- How much new for-sale + rental construction is in the pipeline within 1–3 miles? Heavy new supply typically softens prices + rents 12–24 months out; constrained supply supports both.
Investment metrics
- 1% rule
- 2.91% ✓
- Cap rate
- 25.57%
- Cash-on-cash
- 68.85%
- DSCR
- 4.06
- GRM
- 2.9
CMA / ARV
- ARV (median comp)
- $54,773
- List price
- $37,000
- Delta
- -28.80%
- Verdict
- UNDERPRICED
- Comps
- 20 within 1.0 mi
Show comp detail 7 sales within ~0.75 mi
| Address | Dist | Beds/Ba | Sqft | Sold | Price | $/sf | Match |
|---|---|---|---|---|---|---|---|
| 324 Nita Ln | 0.34mi | 2/1.0 | 732 (+2%) | 5mo | $50,000 | $68 | 74 |
| 279 Teakwood Ln | 0.43mi | 2/1.5 | 720 (0%) | 16mo | $75,000 | $104 | 65 |
| 287 Florence Ln | 0.38mi | 2/2.0 | 790 (+10%) | 1mo | $17,500 | $22 | 65 |
| 281 Teakwood Ln | 0.41mi | 2/2.0 | 764 (+6%) | 9mo | $50,000 | $65 | 64 |
| 77 Cinnamon Ln | 0.44mi | 2/1.0 | 672 (-7%) | 2mo | $43,000 | $64 | 63 |
| 166 Hickorywood Ln | 0.29mi | 2/1.0 | 720 (0%) | 24mo | $62,000 | $86 | 62 |
| 188 Kings Ln | 0.48mi | 2/1.0 | 720 (0%) | 20mo | $61,000 | $85 | 57 |
Match score weights: distance 35% · size 25% · config 20% · recency 20%. Top-matched comps best support the ARV.
Projected returns pro-forma
-3.0% appreciation · 2.22% rent growth · sell at horizon
- IRR
- 67.4%
- Equity multiple
- 4.00×
- Total profit
- $31,040
- Equity at exit
- $5,517
- IRR
- 71.4%
- Equity multiple
- 7.99×
- Total profit
- $72,457
- Equity at exit
- $3,199
Cash invested: $10,360 (down + closing). Projections, not guarantees.
Landlord ↔ Tenant lean methodology
- Overall (STATE)
- 18 Strongly Tenant-Friendly
- State California
- 18 Strongly Tenant-Friendly · D+13
- County
- — inherits STATE
- City
- — inherits STATE
ZIP-level market 93308
- Home prices YoY
- -0.5%
- Rents YoY
- 2.2%
- Active inventory
- 307
- Price-to-rent
- 2.9×
Monthly cashflow live
- Estimated rent
- $1,076 high interval (Pro) →
- Mortgage (P&I)
- −$194
- Tax est. 1.5%
- −$46 /mo · $555/yr
- Insurance
- −$15
- HOA
- −$0
- Vacancy / Maint / Mgmt
- −$226
- Net cashflow
- $594
Break-even live
UW: 25.0% down · 7.5% · 30yr · 1.5% tax · 5.0% vac · 8.0% maint · 8.0% mgmt
Financing live
Cash to close
- Down payment
- $9,250
- Closing costs
- $1,110
- Reserves months
- —
- Total cash needed
- —
Loan-product check · same deal, 3 products live
Conventional
25% down · 7.5% · 30yr
- Down + closing
- —
- Monthly P&I
- —
- Monthly cashflow
- —
- DSCR
- —
- Eligible?
- —
Personal DTI + credit; lowest rate.
DSCR
20% down · 8.5% · 30yr
- Down + closing
- —
- Monthly P&I
- —
- Monthly cashflow
- —
- DSCR
- —
- Eligible?
- —
No personal income docs; deal must DSCR.
Hard money
10% down · 12.0% · 12mo
- Down + closing
- —
- Monthly P&I
- —
- Monthly cashflow
- —
- DSCR
- —
- Eligible?
- —
Short-term bridge; refi at stabilization.
Rent comps 19 comps
| Address | Beds | Baths | Sqft | Rent | $/sqft | DOM | Units | Dist |
|---|---|---|---|---|---|---|---|---|
| 502 Beardsley Ave Unit T Bakersfield, CA | 1.0 | 1.0 | 624 | $950 | $1.52 | 43d | 1 | 0.09mi |
| 313 Beardsley Ave Unit 315 B Bakersfield, CA | 1.0 | 1.0 | 550 | $850 | $1.55 | 2d | 1 | 0.16mi |
| 214 Beardsley Ave Bakersfield, CA | 1.0 | 1.0 | 450 | $850 | $1.89 | 2d | 1 | 0.25mi |
| 214 Beardsley Ave Unit 12 Bakersfield, CA | 2.0 | 2.0 | 655 | $1,095 | $1.67 | 2d | 1 | 0.25mi |
| 214 Beardsley Ave Unit 11 Bakersfield, CA | 1.0 | 1.0 | 650 | $950 | $1.46 | 2d | 1 | 0.25mi |
| 210 Beardsley Ave Unit 8 Bakersfield, CA | 1.0 | 1.0 | 650 | $895 | $1.38 | 2d | 1 | 0.27mi |
| 117 Harris Dr Bakersfield, CA | 2.0 | 1.0 | 560 | $1,300 | $2.32 | 18d | 1 | 0.41mi |
| 701 Lilac St Unit 1/2 Bakersfield, CA | 1.0 | 1.0 | 400 | $895 | $2.24 | 2d | 1 | 0.77mi |
| 611 Wilson Ave Unit B Bakersfield, CA | 2.0 | 1.0 | 750 | $1,195 | $1.59 | 43d | 1 | 0.80mi |
| 126 Wilson Ave Unit B Bakersfield, CA | 1.0 | 1.0 | 650 | $850 | $1.31 | 14d | 1 | 0.86mi |
| 1405 Yosemite Dr Unit 1405 Bakersfield, CA | 2.0 | 1.0 | 712 | $1,100 | $1.54 | 43d | 1 | 0.94mi |
| 611 Ann Arbor Dr Unit A Bakersfield, CA | 1.0 | 1.0 | 650 | $1,100 | $1.69 | 43d | 1 | 1.00mi |
| 901 W Columbus St Bakersfield, CA | 1.0–2.0 | 1.0 | 807 | $1,425 | $1.77 | 2d | 12 | 1.17mi |
| 1905 McCray St Bakersfield, CA | 2.0 | 1.0 | 736 | $1,450 | $1.97 | 2d | 1 | 1.22mi |
| 3850 Q St Bakersfield, CA | 1.0 | 1.0 | 531 | $1,100 | $2.07 | 2d | 1 | 1.29mi |
| 3800 Q St Bakersfield, CA | 1.0 | 1.0 | 495 | $1,075 | $2.17 | 2d | 4 | 1.32mi |
| 3701 Q St Bakersfield, CA | 2.0 | 1.0 | 615 | $1,200 | $1.95 | 2d | 5 | 1.36mi |
| 615 W China Grade Loop Bakersfield, CA | 1.0–2.0 | 1.0–2.0 | 875 | $1,850 | $2.11 | 2d | 6 | 1.44mi |
| 1319 Wilson Ave Apt E Bakersfield, CA | 1.0 | 1.0 | 600 | $850 | $1.42 | 2d | 1 | 1.47mi |
Listing history 17 events
-
2026-06-18days on market $37,000 Active 31 DOM
-
2026-06-17days on market $37,000 Active 30 DOM
-
2026-06-16days on market $37,000 Active 29 DOM
-
2026-06-15days on market $37,000 Active 28 DOM
-
2026-06-14days on market $37,000 Active 26 DOM
-
2026-06-10days on market $37,000 Active 23 DOM
-
2026-06-09days on market $37,000 Active 22 DOM
-
2026-06-08days on market $37,000 Active 21 DOM
-
2026-06-07days on market $37,000 Active 20 DOM
-
2026-06-05days on market $37,000 Active 17 DOM
-
2026-06-03days on market $37,000 Active 16 DOM
-
2026-06-03days on market $37,000 Active 15 DOM
-
2026-06-01days on market $37,000 Active 14 DOM
-
2026-05-31days on market $37,000 Active 13 DOM
-
2026-05-18$39,000 Active 301-char remark
-
2026-03-30$39,000 Active 288-char remark
Show marketing remark (288 chars)
McCord Mobile Village gated community split wing 2 bed 2 bath Mobile Home at an affordable price and a low $575.00 space rent. This Mobile Home features New carpet, fresh exterior paint, white stove and fridge in the kitchen area, ice cold central a/c system, fenced yards and much more.
-
2025-10-22$39,000 Active
ⓘ Source: listings_history table (triggers on properties + properties_extension) + one-shot
backfill from property_details.listing_events for pre-trigger history.
Climate risk First Street
- Flood 1/10 Low FEMA zone X (unshaded) · 0% chance over 30 yrs
- Wildfire 3/10 Moderate
- Heat 8/10 Severe 7 d/yr ≥105°F today · 18 d/yr by 30 yrs out
- Wind 1/10 Low
- Air quality 10/10 Extreme 39 unhealthy d/yr today · 45 by 30 yrs out
Nearby sold comps map
Loading sold comps map…
Walkable amenities ~0.75 mi
Loading nearby amenities…
Taxation est. · year 1
- Rental income
- $12,913
- − Mortgage interest
- −$2,073
- − Property taxes
- −$555
- − Insurance
- −$185
- − Repairs & maintenance
- −$1,033
- − Management
- −$1,033
- − Depreciation
- −$1,076
- Taxable income
- $6,958
- Est. tax owed @ 24.0%
- −$1,670
- After-tax cash flow
- $5,463/yr
For passive investors: Depreciation is non-cash, so a rental often shows a tax loss while cash-flowing — sheltering income. Rental losses are passive: they offset passive income freely, and up to $25,000/yr can offset ordinary (W-2) income if you actively participate and your MAGI is under $100k (phasing out to $0 by $150k); unused losses carry forward. On sale, claimed depreciation is recaptured at up to 25%, and gains may owe capital-gains tax (a 1031 exchange can defer both). Figures are a year-1 estimate at your 24.0% rate — not tax advice; consult a CPA.
Schools (NCES district)
- District
- Beardsley Elementary
- NCES district ID
- 0604260
- Math proficiency
- 7% ▼ -12.00%
- Reading proficiency
- 18% ▼ -16.00%
- Median HH income
- $28,808
- Composite
- 9.63/100
- National rank
- #9841
- State rank
- #501 of 517 in CA
Livability — Oildale
- Score
- 58/100
- State rank
- #680
- US rank
- #20848
Category grades
Schools grade is shown separately in the Schools card above.
Census & demographics
- Census place
- Oildale, CA
- County
- Kern County · 710,371 people
- Metro
- Bakersfield, CA
- Population (ZIP)
- 55,078
- Household income
- $62,445
- Rent vs Own
- Severe rent burden
- 2931.0
Population outlook (Kern County) Hauer SSP2
- Today (2025)
- 947,286 people
- By 2030
- 978,984 · +3.3%
- By 2040
- 1,045,018 · +10.3%
- By 2050
- 1,105,232 · +16.7%
- By 2075
- 1,229,538 · +29.8%
- By 2100
- 1,238,059 · +30.7%
Race, ethnicity, and origin ACS 2023
- Neighborhood character
- Diverse neighborhood (Simpson 0.57)
- Race & ethnicity
- White 57% Hispanic / Latino 32% Two or more races 15% Black 3% Asian 3% Native American 1%
- Hispanic origin (detail)
- Mexican 26%
- Common ancestry
- Slovak 3% Italian 1% Romanian 1%
- Foreign-born
- 8% · Canada, Vietnam
- Languages at home
- 80% English-only · Spanish 17%
Political lean MEDSL · Kern
- 2024 margin
- Strong R (+21.1) · D 38.2% · R 59.3% · Other 2.5%
- 2008→2024 swing
- -3.3pp toward R · 2008: -17.8pp · 2024: -21.1pp
- All cycles
- 2024: R+21.1 2020: R+10.2 2016: R+15.0 2012: R+20.9 2008: R+17.8
Not yet ingested
- Civics
- —
Market trends
- HPI YoY
- ▼ -4.52%
- Current HPI
- 825.65
- Rent YoY
- ▲ 2.22%
- Metro
- Bakersfield, CA
- State GDP YoY
- ▲ 3.21%
- F500 in state
- 116
Industry mix (Fortune 500 HQ in CA)
| Industry | F500 HQs | Revenue |
|---|---|---|
| Technology | 27 | $1,492B |
|
||
| Financial Services | 3 | $174B |
|
||
| Retail | 3 | $44B |
|
||
| Insurance | 3 | $26B |
|
||
| Media / Entertainment | 2 | $115B |
|
||
| Pharmaceuticals / Biotech | 2 | $62B |
|
||
Price history
-5.1% since first listed5 events — show timeline
- 2026-05-21 Price Changed $37,000 CRMLS
- 2026-05-21 Price Changed $37,000 GEMLS
- 2026-05-18 Listed $39,000 CRMLS
- 2026-03-30 Listed $39,000 GEMLS
- 2025-10-22 Listed $39,000 GEMLS
Cash-flow waterfall
monthlySold comps — $/sqft
last 12 mo · ≤1 miLoading sold comps…