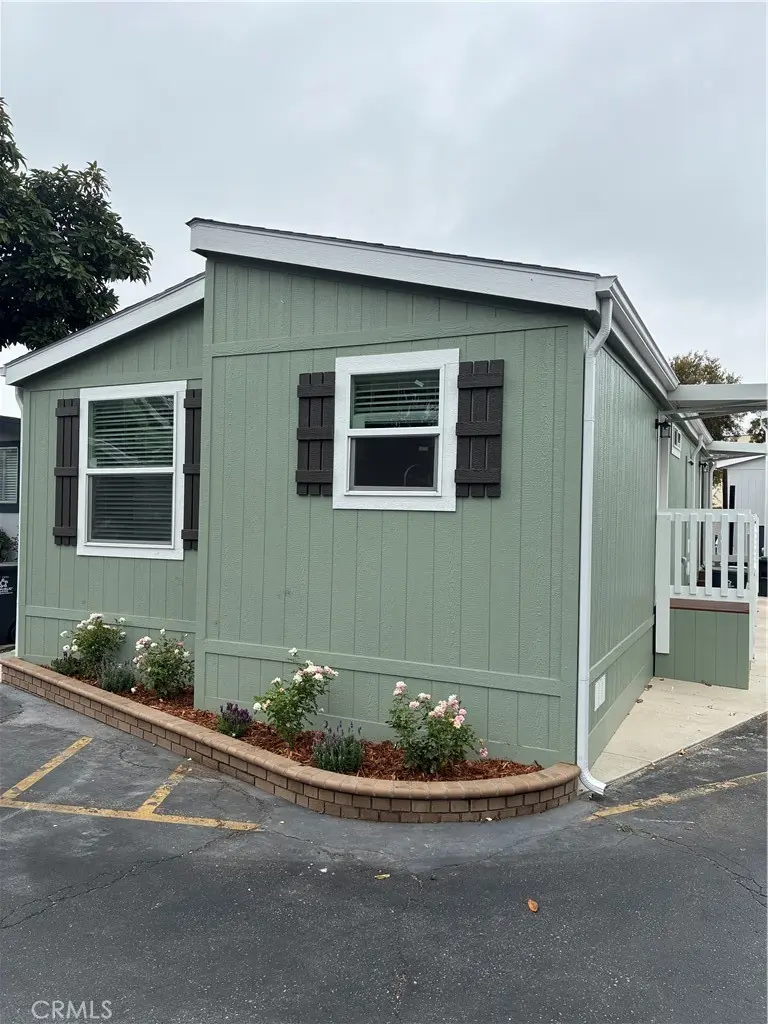
2767 W 1st St #28 · Santa Ana, CA
Flood risk 1/10 · Minimal
- FEMA flood zone
- X
- Chance of flooding over 30 yrs
- 0.0%
- Est. flood insurance / yr
- $507 – $1,088
Fire risk 1/10 · Minimal
- Est. fire insurance / yr
- $659 – $1,223
Heat risk 5/10 · Moderate
- Hot days now (above 89°F)
- 7 days/yr
- Hot days in 30 yrs
- 23 days/yr
Wind risk 1/10 · Minimal
- Chance of severe wind over 30 yrs
- —
Air-quality risk 4/10 · Minor
- Unhealthy air days now
- 5 days/yr
- Unhealthy air days in 30 yrs
- 5 days/yr
Risk factors via First Street. Map © Google.
Why this score? — see what drove the B- grade
The composite is a weighted blend of 9 inputs, each scored 0–100. Each bar is that input's sub-score; the figure is the points it added to the 100-point composite (weight × sub-score).
- Cash flow +29.1/30.0
- DSCR +10.0/10.0
- 1% rule +8.1/10.0
- ARV discount +7.5/15.0
- Livability +2.8/5.0
- Schools +2.7/10.0
- Rent growth +2.5/5.0
- Condition / age +2.5/5.0
- Appreciation +0.0/10.0
$199,900
🖨 Deal sheet 📄 Offer letter ✓ Due diligence
Listing remarks
This brand new 2026 manufactured home features 2 bedrooms and 1 3/4 baths. The kitchen features hardwood cabinetry and a 3-door pantry. The upgraded stainless steel appliance package includes: 21 CF Side-by-Side refrigerator with ice and water in the door, self-cleaning gas range, microwave over the range, dishwasher, and garbage disposal. Countertops have been upgrade to quartz with a 6" quartz backsplash, quartz behind the range, and square edging. The main bathroom features a walk-in shower; guest bathroom has tub/shower combo with glass enclosure. Main bedroom has walk-in closet, guest bath features mirrored closet doors. Both bathrooms have quartz countertops and undermount rectan
Key facts
- Tub/shower combo
- Quartz countertops
- 3-door pantry
Tags
Property features AI
Finance
- Other: Park name: Taggin Wagon Mobile Home Park
- Financial info: Rent includes: None
- HOA & community: Located in Taggin Wagon Mobile Home Park; Park requires manager approval; Pets allowed with size and number limits; breed restrictions may apply; Land lease of $1,950 monthly (park-provided)
Exterior
- Parking: Assigned uncovered parking; Street parking available; One uncovered parking space
- Security: Carbon monoxide detector(s); Smoke detector(s)
- Utilities: District/Public water; Public sewer; Natural gas connected; Electricity connected (standard); Sewer connected; Cable available; Telephone available in street; Water connected
- Home design: Single-story mobile home; Model: Canyon Lake; Turnkey condition; Mobile home remains on site; Mobile dimensions approximately 20' x 46'; Entry at level 1; Access via city streets
- Construction: Composition roof; Hardboard siding; Drywall interior walls; Cement board skirt; Pier jacks foundation; Built by builder (year built source: builder)
- Exterior features: Patio; Rain gutters; Community pool; No fencing; Corner lot; Paved road frontage; Street lighting in neighborhood
Interior
- Kitchen: Kitchen open to family room; Gas range; Self-cleaning oven; Microwave; Refrigerator; Garbage disposal; Ice maker; Water line to refrigerator; Self-closing cabinet doors and drawers; Quartz counters
- Bedrooms: All bedrooms located on the main level; Walk-in closet
- Flooring: Carpet; Laminate
- Bathrooms: One full bathroom; One three-quarter bathroom; Walk-in shower; Shower-in-tub; Exhaust fan(s); Quartz counters in bathroom(s)
- Heating & cooling: Forced air heating
- Interior features: Quartz counters throughout; Ceiling fan(s); Pantry; Recessed lighting; Open floor plan; Mirrored closet doors; Panel doors; Screens on windows; Carbon monoxide and smoke detectors; No interior steps / accessible with 2+ access exits; One-level living
- Laundry & utility: Community laundry available; Gas water heater
Neighborhood map
What this means for you Summary
Snapshot
- This is a 2-bed/2.0-bath manufactured listed at $200k.
Deal economics
- At list price, monthly cash flow is $693 ($8k/yr) — positive.
- The deal already cash-flows at list — no discount required.
- Meets the 1% rule at list price ($3k rent vs $200k).
- Recommended offer: $197k (1.5% below list) — sets the bar for market timing.
- Cap rate 10.5% vs local median 2.5% in Santa Ana — top-decile yield for the area; either an underpriced asset or a hidden risk that comps aren't pricing in. Stress-test before assuming the spread holds.
Location & tenants
- Location reads 55/100 on livability (#871 in CA) — a working-class tenant base; expect higher turnover. Strengths: employment A; Watch: schools D, crime D-, amenities F.
- Santa Ana Unified (urban): math 23% / reading 37% proficiency, ranked #329 of 517 in CA (top 64%) — families likely to look elsewhere, expect single-tenant / working-renter base with shorter leases; 83% free/reduced lunch — lower-income household profile, screen leases tightly.
- Market conditions: 59 active listings in the ZIP; 25 comparable units currently listed for rent nearby; rentals at typical pace (median 25d on market — plan ~3-4 weeks tenant-placement turnaround); solid renter incomes; 6,974 units permitted in Orange County in 2024 (3,839 in 5+ unit buildings).
- This rent runs 37% of the median local income ($84k/yr) — at the standard rent-burdened threshold; future hikes will face affordability resistance.
Forward outlook
- Local home prices are declining (-3.0%/yr); year-one equity from $1k of loan paydown is wiped out by about $6k of value loss. Plan a longer hold.
- Orange County population projected at +14% by 2050 — modest demand growth; plan on rents tracking national, not racing it.
- At projected returns (-3.0% appreciation + 3.0% rent growth), your $56k cash investment doubles in ~8 years — after that, you're playing with house money.
Negotiation context
- It's been on market 30 days — a 2% lower offer ($197k) is reasonable based on typical stale-listing flexibility.
Risks & watch-outs
- Climate carrying-cost: extreme-heat days projected 7→23/yr by 2055 (HVAC capex compounding) — expect insurance premiums to compound above CPI over the hold.
Questions for the listing agent
- Is there a deadline driving the sale (1031 exchange, divorce, estate, relocation)? That informs how much negotiation room exists.
- Schools are D-rated, which usually means shorter tenancies and higher turnover. Who's the typical renter profile here, and what's been the actual vacancy rate?
- Crime grade is D in this area — have there been break-ins, vandalism, or insurance claims at this property in the last 3 years? What carrier currently insures it and at what premium?
- What's the average days-on-market for RENTAL listings here right now (not sales)? A rising rental-DOM trend means longer vacancies and softer asking-rent achievability than the comps imply.
- What's the recent tenant-quality profile in this submarket — average credit score on applications, eviction rate, late-payment / NSF rate, and stable-employment percentage? A property-management company in the area should have these aggregated.
- How much new for-sale + rental construction is in the pipeline within 1–3 miles? Heavy new supply typically softens prices + rents 12–24 months out; constrained supply supports both.
Investment metrics
- 1% rule
- 1.31% ✓
- Cap rate
- 10.45%
- Cash-on-cash
- 14.86%
- DSCR
- 1.66
- GRM
- 6.3
CMA / ARV
- ARV (on-the-fly)
- $117,245
- Comps found
- 4
Show comp detail 4 sales within ~0.75 mi
| Address | Dist | Beds/Ba | Sqft | Sold | Price | $/sf | Match |
|---|---|---|---|---|---|---|---|
| 201 Capri #161 | 0.16mi | 3/1.0 (+1) | 860 (-4%) | 13mo | $80,000 | $93 | 66 |
| 2767 W 1st St #35 | 0.04mi | 2/1.0 | 786 (-12%) | 11mo | $65,000 | $83 | 64 |
| 306 Sullivan St. Spc #103 | 0.33mi | 2/2.0 | 800 (-11%) | 5mo | $152,000 | $190 | 63 |
| 201 Queen Ln #108 | 0.39mi | 3/2.0 (+1) | 800 (-11%) | 10mo | $105,000 | $131 | 51 |
Match score weights: distance 35% · size 25% · config 20% · recency 20%. Top-matched comps best support the ARV.
Projected returns pro-forma
-3.0% appreciation · 3.0% rent growth · sell at horizon
- IRR
- 5.4%
- Equity multiple
- 1.21×
- Total profit
- $11,795
- Equity at exit
- $29,806
- IRR
- 14.9%
- Equity multiple
- 2.20×
- Total profit
- $67,278
- Equity at exit
- $17,284
Cash invested: $55,972 (down + closing). Projections, not guarantees.
Landlord ↔ Tenant lean methodology
- Overall (STATE)
- 18 Strongly Tenant-Friendly
- State California
- 18 Strongly Tenant-Friendly · D+13
- County
- — inherits STATE
- City
- — inherits STATE
ZIP-level market 92703
- Active inventory
- 59
- Price-to-rent
- 6.3×
Monthly cashflow live
- Estimated rent
- $2,626 high interval (Pro) →
- Mortgage (P&I)
- −$1,048
- Tax est. 1.5%
- −$250 /mo · $2,998/yr
- Insurance
- −$83
- HOA
- −$0
- Vacancy / Maint / Mgmt
- −$551
- Net cashflow
- $693
Break-even live
UW: 25.0% down · 7.5% · 30yr · 1.5% tax · 5.0% vac · 8.0% maint · 8.0% mgmt
Financing live
Cash to close
- Down payment
- $49,975
- Closing costs
- $5,997
- Reserves months
- —
- Total cash needed
- —
Loan-product check · same deal, 3 products live
Conventional
25% down · 7.5% · 30yr
- Down + closing
- —
- Monthly P&I
- —
- Monthly cashflow
- —
- DSCR
- —
- Eligible?
- —
Personal DTI + credit; lowest rate.
DSCR
20% down · 8.5% · 30yr
- Down + closing
- —
- Monthly P&I
- —
- Monthly cashflow
- —
- DSCR
- —
- Eligible?
- —
No personal income docs; deal must DSCR.
Hard money
10% down · 12.0% · 12mo
- Down + closing
- —
- Monthly P&I
- —
- Monthly cashflow
- —
- DSCR
- —
- Eligible?
- —
Short-term bridge; refi at stabilization.
Rent comps 25 comps
| Address | Beds | Baths | Sqft | Rent | $/sqft | DOM | Units | Dist |
|---|---|---|---|---|---|---|---|---|
| 3200 W 5th St Santa Ana, CA | 1.0–2.0 | 1.0–2.0 | 769 | $2,795 | $3.63 | 2d | 9 | 0.31mi |
| 308 S Laurel St Unit C Santa Ana, CA | 2.0 | 1.0 | 950 | $2,650 | $2.79 | 44d | 1 | 0.51mi |
| 1905 W Myrtle St Unit 3 Santa Ana, CA | 2.0 | 1.0 | 750 | $2,350 | $3.13 | 44d | 1 | 0.73mi |
| 3900 W 5th St Santa Ana, CA | 1.0–2.0 | 1.0–2.0 | 780 | $2,175 | $2.79 | 13d | 1 | 0.87mi |
| 4109 W 5th St Unit C3 Santa Ana, CA | 2.0 | 2.0 | 921 | $2,900 | $3.15 | 44d | 1 | 1.00mi |
| 4109 W 5th St Unit C3 Santa Ana, CA | 2.0 | 2.0 | 921 | $2,500 | $2.71 | 22d | 1 | 1.00mi |
| 1610 N King St Santa Ana, CA | 1.0–2.0 | 1.0–2.0 | 808 | $2,400 | $2.97 | 44d | 1 | 1.04mi |
| 4201 W 5th St Santa Ana, CA | 2.0 | 1.0 | 921 | $2,800 | $3.04 | 7d | 1 | 1.05mi |
| 4200 W 1st St Santa Ana, CA | 1.0–2.0 | 1.0–2.0 | 714 | $2,997 | $4.19 | 2d | 4 | 1.07mi |
| 1806 N Fairview St Unit Q Santa Ana, CA | 1.0 | 1.0 | 693 | $2,526 | $3.65 | 24d | 1 | 1.07mi |
| 1314 N Harbor Blvd Santa Ana, CA | 2.0 | 2.0 | 884 | $2,742 | $3.10 | 13d | 4 | 1.09mi |
| 3630 Westminster Ave Santa Ana, CA | 1.0 | 1.0 | 696 | $2,508 | $3.60 | 22d | 1 | 1.11mi |
| 3630 Westminster Ave Santa Ana, CA | 2.0 | 2.0 | 997 | $2,758 | $2.77 | 44d | 1 | 1.11mi |
| 1500 N Harbor Blvd Santa Ana, CA | 1.0–2.0 | 1.0–2.0 | 780 | $2,575 | $3.30 | 15d | 1 | 1.18mi |
| 2111 W 17th St Santa Ana, CA | 1.0–2.0 | 1.0–2.0 | 756 | $2,880 | $3.81 | 12d | 8 | 1.18mi |
| 1329 W Civic Center Dr Santa Ana, CA | 2.0 | 1.0 | 850 | $2,295 | $2.70 | 15d | 1 | 1.25mi |
| 1329 W Civic Center Dr Unit 09 Santa Ana, CA | 2.0 | 1.0 | 850 | $2,295 | $2.70 | 24d | 1 | 1.25mi |
| 517 S Newhope St Santa Ana, CA | 2.0 | 1.0 | 840 | $2,125 | $2.53 | 44d | 1 | 1.25mi |
| 1330 W 10th St Unit 2 Santa Ana, CA | 3.0 | 2.0 | 993 | $3,700 | $3.73 | 13d | 1 | 1.27mi |
| 12562 Cardinal Ave Unit B Garden Grove, CA | 3.0 | 1.0 | 1100 | $2,800 | $2.55 | 44d | 1 | 1.35mi |
| 2417 W Stanford St Santa Ana, CA | 2.0 | 1.0 | 700 | $3,200 | $4.57 | 24d | 1 | 1.37mi |
| 623 N Bristol St Santa Ana, CA | 1.0 | 1.0 | 708 | $2,300 | $3.25 | 24d | 1 | 1.37mi |
| 631 N Bristol St #66 Santa Ana, CA | 1.0 | 1.0 | 630 | $2,500 | $3.97 | 44d | 1 | 1.37mi |
| 1114 W Santa Ana Blvd Santa Ana, CA | 2.0 | 2.0 | 725 | $2,700 | $3.72 | 44d | 4 | 1.47mi |
| 1148 W Civic Center Dr Unit 12 Santa Ana, CA | 2.0 | 1.0 | 850 | $2,595 | $3.05 | 24d | 1 | 1.47mi |
Listing history 15 events
-
2026-06-18days on market $199,900 Active 30 DOM
-
2026-06-17days on market $199,900 Active 29 DOM
-
2026-06-16days on market $199,900 Active 28 DOM
-
2026-06-15days on market $199,900 Active 27 DOM
-
2026-06-13days on market $199,900 Active 25 DOM
-
2026-06-13days on market $199,900 Active 24 DOM
-
2026-06-09days on market $199,900 Active 21 DOM
-
2026-06-08days on market $199,900 Active 20 DOM
-
2026-06-07days on market $199,900 Active 19 DOM
-
2026-06-04days on market $199,900 Active 16 DOM
-
2026-06-03days on market $199,900 Active 15 DOM
-
2026-06-02days on market $199,900 Active 14 DOM
-
2026-06-01days on market $199,900 Active 13 DOM
-
2026-05-31days on market $199,900 Active 12 DOM
-
2026-05-19$199,900 Active
ⓘ Source: listings_history table (triggers on properties + properties_extension) + one-shot
backfill from property_details.listing_events for pre-trigger history.
Climate risk First Street
- Flood 1/10 Low FEMA zone X · 0% chance over 30 yrs
- Wildfire 1/10 Low
- Heat 5/10 Major 7 d/yr ≥89°F today · 23 d/yr by 30 yrs out
- Wind 1/10 Low
- Air quality 4/10 Moderate 5 unhealthy d/yr today · 5 by 30 yrs out
Nearby sold comps map
Loading sold comps map…
Walkable amenities ~0.75 mi
Loading nearby amenities…
Taxation est. · year 1
- Rental income
- $31,513
- − Mortgage interest
- −$11,198
- − Property taxes
- −$2,998
- − Insurance
- −$1,000
- − Repairs & maintenance
- −$2,521
- − Management
- −$2,521
- − Depreciation
- −$5,815
- Taxable income
- $5,460
- Est. tax owed @ 24.0%
- −$1,310
- After-tax cash flow
- $7,007/yr
For passive investors: Depreciation is non-cash, so a rental often shows a tax loss while cash-flowing — sheltering income. Rental losses are passive: they offset passive income freely, and up to $25,000/yr can offset ordinary (W-2) income if you actively participate and your MAGI is under $100k (phasing out to $0 by $150k); unused losses carry forward. On sale, claimed depreciation is recaptured at up to 25%, and gains may owe capital-gains tax (a 1031 exchange can defer both). Figures are a year-1 estimate at your 24.0% rate — not tax advice; consult a CPA.
Schools (NCES district)
- District
- Santa Ana Unified
- NCES district ID
- 0635310
- Math proficiency
- 23% ▼ -2.00%
- Reading proficiency
- 37% ▲ 5.00%
- Median HH income
- $55,752
- Composite
- 26.7/100
- National rank
- #7152
- State rank
- #329 of 517 in CA
Livability — Santa Ana
- Score
- 55/100
- State rank
- #871
- US rank
- #23502
Category grades
Schools grade is shown separately in the Schools card above.
Census & demographics
- Census place
- Santa Ana, CA
- County
- Orange County · 3,096,323 people
- City population
- 288,255
- Metro
- Los Angeles-Long Beach-Anaheim, CA
- Population (ZIP)
- 62,447
- Household income
- $84,437
- Rent vs Own
- Severe rent burden
- 1835.0
Population outlook (Orange County) Hauer SSP2
- Today (2025)
- 3,477,456 people
- By 2030
- 3,613,117 · +3.9%
- By 2040
- 3,835,945 · +10.3%
- By 2050
- 3,968,736 · +14.1%
- By 2075
- 4,097,053 · +17.8%
- By 2100
- 3,903,633 · +12.3%
Race, ethnicity, and origin ACS 2023
- Neighborhood character
- Predominantly Hispanic (77%)
- Race & ethnicity
- Hispanic / Latino 77% Two or more races 19% Asian 16% White 5% Native American 2%
- Hispanic origin (detail)
- Mexican 72%
- Common ancestry
- Iranian 1%
- Foreign-born
- 47% · Canada, Vietnam, China
- Languages at home
- 17% English-only · Spanish 68% Vietnamese 13% Other Asian/Pacific 1%
Political lean MEDSL · Orange
- 2024 margin
- Toss-up / Even · D 49.7% · R 47.1% · Other 3.2%
- 2008→2024 swing
- +5.2pp toward D · 2008: -2.6pp · 2024: 2.6pp
- All cycles
- 2024: D+2.6 2020: D+9.0 2016: D+7.7 2012: R+8.3 2008: R+2.6
Not yet ingested
- Civics
- —
Market trends
- HPI YoY
- ▼ -666.61%
- Current HPI
- 458.1824
- Rent YoY
- —
- Metro
- Los Angeles-Long Beach-Anaheim, CA
- State GDP YoY
- ▲ 3.21%
- F500 in state
- 116
Industry mix (Fortune 500 HQ in CA)
| Industry | F500 HQs | Revenue |
|---|---|---|
| Technology | 27 | $1,492B |
|
||
| Financial Services | 3 | $174B |
|
||
| Retail | 3 | $44B |
|
||
| Insurance | 3 | $26B |
|
||
| Media / Entertainment | 2 | $115B |
|
||
| Pharmaceuticals / Biotech | 2 | $62B |
|
||
Price history
1 event — show timeline
- 2026-05-19 Listed $199,900 CRMLS
Property tax history
-0.7%/yrLatest (2025): $34 · +0.6% YoY. Source: county tax records.
Cash-flow waterfall
monthlySold comps — $/sqft
last 12 mo · ≤1 miLoading sold comps…