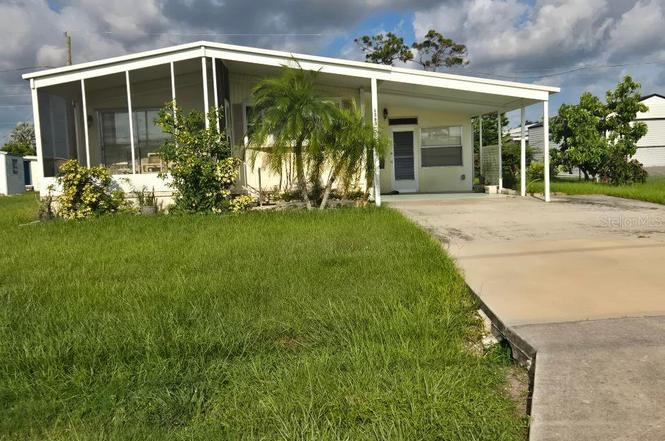
1363 Seagull Dr · Englewood, FL
Flood risk 8/10 · Major
- FEMA flood zone
- X (shaded)
- Chance of flooding over 30 yrs
- 0.96%
- Est. flood insurance / yr
- $507 – $1,088
Fire risk 5/10 · Moderate
- Est. fire insurance / yr
- $947 – $1,759
Heat risk 10/10 · Severe
- Hot days now (above 107°F)
- 7 days/yr
- Hot days in 30 yrs
- 30 days/yr
Wind risk 10/10 · Severe
- Chance of severe wind over 30 yrs
- 99.0%
Air-quality risk 2/10 · Minimal
- Unhealthy air days now
- 1 days/yr
- Unhealthy air days in 30 yrs
- 1 days/yr
Risk factors via First Street. Map © Google.
Why this score? — see what drove the C+ grade
The composite is a weighted blend of 9 inputs, each scored 0–100. Each bar is that input's sub-score; the figure is the points it added to the 100-point composite (weight × sub-score).
- Cash flow +25.7/30.0
- DSCR +8.6/10.0
- ARV discount +7.5/15.0
- 1% rule +6.8/10.0
- Schools +4.6/10.0
- Livability +3.7/5.0
- Rent growth +2.5/5.0
- Condition / age +2.5/5.0
- Appreciation +0.0/10.0
$169,000
🖨 Deal sheet (PDF) 📄 Offer letter ✓ Due diligence
Listing remarks MLS
POPULAR HOLIDAY MOBILE ESTATES * * * GREAT BUY * * * SPOTLESS, AIRY & BRIGHT HOME * * * MANY IMPROVEMENTS * * * FURNISHED * * * This home has been well maintained, had new plumbing in 1996, new roof over in 1994, new A/C in 1995, thermal windows in 1997, and driveway culvert in 1999. This home is in great condition! Minutes to area beaches great shopping and restaurants.
Key facts
- Lemon bay access
- Boat ramp access
- Fully furnished
Tags
Property features AI
Finance
- Other: Directions: Route 776 east to Ibis Ln. left to stop then right to Seagull Dr., turn left; home is on the right
- Financial info: Lease restrictions apply; Turnkey furnished
- HOA & community: Has HOA (annual fee $100 / $8.33 monthly); Association amenities include clubhouse, recreation facilities, pickleball and shuffleboard courts; Deed restrictions and community street lights; Golf carts allowed; Senior community; Pets allowed (cats and dogs); Association name listed as Chris Baker
Exterior
- Parking: Covered parking; Boat parking; 1-car carport
- Security: Security lights; Smoke detectors
- Utilities: Public water; Public sewer; High-speed internet/BB/HS available; Cable available; Fiber optics available; Phone available; Sewer connected; Water connected; 1 well on property
- Home design: Manufactured double-wide home (attached); One level; Faces west
- Construction: Metal siding; Metal roof; Crawlspace foundation; Built by Schu (make: Schu)
- Exterior features: Covered patio/porch; Exterior lighting; Rain gutters; Storage shed; Fruit trees and landscaped trees on lot; Flood zone
Interior
- Kitchen: Convection oven; Dishwasher; Disposal; Exhaust fan; Ice maker; Microwave; Range hood; Refrigerator
- Bedrooms: 2 bedrooms
- Flooring: Ceramic tile; Hardwood; Laminate; Tile
- Bathrooms: 2 full bathrooms
- Heating & cooling: Central heating (electric); Central air conditioning
- Interior features: Ceiling fans; Eat-in kitchen; Kitchen/family room combo; Open floorplan; Thermostat; Blinds, drapes, rods, shades and shutters on windows; Wood window frames
- Laundry & utility: Washer hookup; Dryer hookup (electric); Inside laundry room; Inside utility
Neighborhood map
What this means for you Summary
Snapshot
- This is a 2-bed/2.0-bath manufactured listed at $169k.
Deal economics
- At list price, monthly cash flow is $339 ($4k/yr) — positive.
- The deal already cash-flows at list — no discount required.
- Meets the 1% rule at list price ($2k rent vs $169k).
- Recommended offer: $149k (12.0% below list) — sets the bar for market timing.
- Cap rate 9.2% vs local median 3.8% in Englewood — top-decile yield for the area; either an underpriced asset or a hidden risk that comps aren't pricing in. Stress-test before assuming the spread holds.
Location & tenants
- Location reads 73/100 on livability (#321 in FL) — a middle-class / working-renter tenant base. Strengths: housing A+, cost of living A, health & safety A; Watch: employment C-, amenities F, commute F.
- Charlotte (suburban): math 54% / reading 54% proficiency, ranked #22 of 73 in FL (top 30%) — acceptable for families but not a draw, mixed tenant base, ~2y average lease.
- Zoned schools: Myakka River Elementary School (math 65% / reading 60%, grade B, #601 of 2,144 statewide, top 28%, 608 students, 51% FRL); L. A. Ainger Middle School (math 65% / reading 53%, grade B, #144 of 571 statewide, top 26%, 720 students, 40% FRL); Lemon Bay High School (math 50% / reading 56%, grade C-, #148 of 667 statewide, top 23%, 1,360 students, 28% FRL).
- Market conditions: Rents soft (-0.1%/yr); 737 active listings in the ZIP; 8 comparable units currently listed for rent nearby; rentals at typical pace (median 23d on market — plan ~3-4 weeks tenant-placement turnaround); 4,585 units permitted in Charlotte County in 2024 (703 in 5+ unit buildings).
- This rent runs 42% of the median local income ($57k/yr) — at the standard rent-burdened threshold; future hikes will face affordability resistance.
Forward outlook
- Local home prices are declining (-3.0%/yr); year-one equity from $1k of loan paydown is wiped out by about $5k of value loss. Plan a longer hold.
- Charlotte County population projected at +24% by 2050 — long-run rental-demand tailwind backs the buy-and-hold thesis.
Negotiation context
- It's been on market 314 days — a 12% lower offer ($149k) is reasonable based on typical stale-listing flexibility.
- 2 sale attempts since 17y ago; this cycle's ask has dropped $26k (13%) from the opening price — seller is motivated, your offer sets the floor, not the list.
- Current owner paid $65k; list at $169k implies a 160% gain — meaningful room to come down on a strong offer.
Risks & watch-outs
- Watch-outs: flood insurance adds $66/mo.
- Climate carrying-cost: severe flood risk; severe wind risk, 99% chance of damaging wind over 30y; moderate wildfire risk; extreme-heat days projected 7→30/yr by 2055 (HVAC capex compounding) — expect insurance premiums to compound above CPI over the hold.
Questions for the listing agent
- It's been on market 314 days. Have you received any prior offers? Is the seller open to a 12% concession, seller financing, or rate buy-down credit?
- Built in 1979 — when were the roof, HVAC, electrical panel, plumbing, and water heater last replaced?
- What's the actual annual flood-insurance premium (NFIP or private), and is the property in a SFHA with mandatory coverage?
- What does the HOA fee cover, when was the last increase, and are there any pending special assessments or reserve-fund shortfalls?
- Why hasn't it sold? Are there any deal-killer items the seller is aware of (foundation, flood, title, zoning, code violations)?
- Is there a deadline driving the sale (1031 exchange, divorce, estate, relocation)? That informs how much negotiation room exists.
- Schools are A-rated — typically a magnet for longer-tenancy family renters. What's the average tenant stay here, and is there a school-zone premium baked into asking?
- What's the average days-on-market for RENTAL listings here right now (not sales)? A rising rental-DOM trend means longer vacancies and softer asking-rent achievability than the comps imply.
- What's the recent tenant-quality profile in this submarket — average credit score on applications, eviction rate, late-payment / NSF rate, and stable-employment percentage? A property-management company in the area should have these aggregated.
- How much new for-sale + rental construction is in the pipeline within 1–3 miles? Heavy new supply typically softens prices + rents 12–24 months out; constrained supply supports both.
Investment metrics
- 1% rule
- 1.18% ✓
- Cap rate
- 9.17%
- Cash-on-cash
- 10.27%
- DSCR
- 1.46
- GRM
- 7.1
CMA / ARV
- ARV (on-the-fly)
- $47,040
- Comps found
- 1
Show comp detail 1 sale within ~0.75 mi
| Address | Dist | Beds/Ba | Sqft | Sold | Price | $/sf | Match |
|---|---|---|---|---|---|---|---|
| 426 Camino Real | 0.54mi | 2/2.0 | 818 (-15%) | 8mo | $40,000 | $49 | 44 |
Match score weights: distance 35% · size 25% · config 20% · recency 20%. Top-matched comps best support the ARV.
Projected returns pro-forma
-3.0% appreciation · 0.0% rent growth · sell at horizon
- IRR
- -6.8%
- Equity multiple
- 0.76×
- Total profit
- $-11,572
- Equity at exit
- $25,198
- IRR
- -1.6%
- Equity multiple
- 0.90×
- Total profit
- $-4,524
- Equity at exit
- $14,612
Cash invested: $47,320 (down + closing). Projections, not guarantees.
Landlord ↔ Tenant lean methodology
- Overall (STATE)
- 87 Strongly Landlord-Friendly
- State Florida
- 87 Strongly Landlord-Friendly · R+3
- County
- — inherits STATE
- City
- — inherits STATE
ZIP-level market 34224
- Home prices YoY
- -18.9%
- Rents YoY
- -0.1%
- Active inventory
- 737
- Price-to-rent
- 7.1×
Monthly cashflow live
- Estimated rent
- $1,986 high interval (Pro) →
- Mortgage (P&I)
- −$886
- Tax from tax record
- −$199 /mo · $2,393/yr
- Insurance
- −$70
- Flood insurance flood zone
- −$66 /mo · $798/yr
- HOA
- −$8
- Vacancy / Maint / Mgmt
- −$417
- Net cashflow
- $339
Break-even live
Sensitivity live
| Price | -10% $434 | -5% $386 | +0% $339 | +5% $291 | +10% $243 |
|---|---|---|---|---|---|
| Rent | -10% $182 | -5% $260 | +0% $339 | +5% $417 | +10% $496 |
| Rate | -1.0pp $424 | -0.5pp $382 | base $339 | +0.5pp $295 | +1.0pp $250 |
UW: 25.0% down · 7.5% · 30yr · 1.5% tax · 5.0% vac · 8.0% maint · 8.0% mgmt
Financing live
Cash to close
- Down payment
- $42,250
- Closing costs
- $5,070
- Reserves months
- —
- Total cash needed
- —
Loan-product check · same deal, 3 products live
Conventional
25% down · 7.5% · 30yr
- Down + closing
- —
- Monthly P&I
- —
- Monthly cashflow
- —
- DSCR
- —
- Eligible?
- —
Personal DTI + credit; lowest rate.
DSCR
20% down · 8.5% · 30yr
- Down + closing
- —
- Monthly P&I
- —
- Monthly cashflow
- —
- DSCR
- —
- Eligible?
- —
No personal income docs; deal must DSCR.
Hard money
10% down · 12.0% · 12mo
- Down + closing
- —
- Monthly P&I
- —
- Monthly cashflow
- —
- DSCR
- —
- Eligible?
- —
Short-term bridge; refi at stabilization.
Rent comps 8 comps
| Address | Beds | Baths | Sqft | Rent | $/sqft | DOM | Units | Dist |
|---|---|---|---|---|---|---|---|---|
| 2275 S McCall Rd #201 Englewood, FL | 2.0 | 2.0 | 1050 | $2,000 | $1.90 | 15d | 1 | 0.49mi |
| 1604 Cardinal Ln Unit 1 Englewood, FL | 1.0 | 1.0 | 750 | $1,300 | $1.73 | 22d | 1 | 0.52mi |
| 6699 San Casa Dr Englewood, FL | 2.0 | 2.0 | 1028 | $1,900 | $1.85 | 22d | 1 | 0.95mi |
| 1531 Placida Rd #203 Englewood, FL | 2.0 | 2.0 | 1056 | $3,900 | $3.69 | 22d | 1 | 1.15mi |
| 1531 Placida Rd #204 Englewood, FL | 2.0 | 2.0 | 1056 | $3,500 | $3.31 | 22d | 1 | 1.16mi |
| 9264 Anita Ave Unit A Englewood, FL | 2.0 | 2.0 | 1008 | $1,400 | $1.39 | 22d | 1 | 1.22mi |
| 9312 Anita Ave Unit B Englewood, FL | 2.0 | 1.0 | 972 | $1,600 | $1.65 | 22d | 1 | 1.31mi |
| 1435 New Point Comfort Rd Unit B Englewood, FL | 1.0 | 1.0 | 744 | $1,520 | $2.04 | 22d | 1 | 1.43mi |
HOA detail
- Monthly dues
- $8 · $96/yr
Listing history 24 events
-
2026-06-22days on market $169,000 Active 314 DOM
-
2026-06-18days on market $169,000 Active 311 DOM
-
2026-06-17days on market $169,000 Active 310 DOM
-
2026-06-16days on market $169,000 Active 309 DOM
-
2026-06-15days on market $169,000 Active 308 DOM
-
2026-06-14days on market $169,000 Active 306 DOM
-
2026-06-13days on market $169,000 Active 305 DOM
-
2026-06-10days on market $169,000 Active 303 DOM
-
2026-06-09days on market $169,000 Active 302 DOM
-
2026-06-08days on market $169,000 Active 301 DOM
-
2026-06-05days on market $169,000 Active 297 DOM
-
2026-06-02days on market $169,000 Active 295 DOM
-
2026-06-01days on market $169,000 Active 294 DOM
-
2026-05-31days on market $169,000 Active 293 DOM
-
2026-05-30days on market $169,000 Active 292 DOM
-
2026-04-06price $169,000
-
2026-03-09price $189,000
-
2025-08-11$195,000 Active
-
2009-05-13soldstatus $65,000
-
2009-05-08soldstatus $65,000 390-char remark
Show marketing remark (390 chars)
POPULAR HOLIDAY MOBILE ESTATES * * * GREAT BUY * * * SPOTLESS, AIRY & BRIGHT HOME * * * MANY IMPROVEMENTS * * * FURNISHED * * * This home has been well maintained, had new plumbing in 1996, new roof over in 1994, new A/C in 1995, thermal windows in 1997, and driveway culvert in 1999. This home is in great condition! Minutes to area beaches great shopping and restaurants.
-
2009-02-06$83,900 390-char remark
Show marketing remark (390 chars)
POPULAR HOLIDAY MOBILE ESTATES * * * GREAT BUY * * * SPOTLESS, AIRY & BRIGHT HOME * * * MANY IMPROVEMENTS * * * FURNISHED * * * This home has been well maintained, had new plumbing in 1996, new roof over in 1994, new A/C in 1995, thermal windows in 1997, and driveway culvert in 1999. This home is in great condition! Minutes to area beaches great shopping and restaurants.
-
2002-01-28soldstatus $64,900
-
1990-02-01soldstatus $52,000
-
1978-03-01soldstatus $6,000
ⓘ Source: listings_history table (triggers on properties + properties_extension) + one-shot
backfill from property_details.listing_events for pre-trigger history.
Tax reassessment forecast FL · Resets to sale price
- Current annual tax
- $2,393 · $199/mo
- Projected year-2 tax
- $2,393 · $199/mo
- Expected delta
- $0/yr ($0/mo · 0.0%)
ⓘ Screening estimate from a state-policy table — verify with the county assessor before closing.
Climate risk First Street
- Flood 8/10 Severe FEMA zone X (shaded) · 96% chance over 30 yrs
- Wildfire 5/10 Major
- Heat 10/10 Extreme 7 d/yr ≥107°F today · 30 d/yr by 30 yrs out
- Wind 10/10 Extreme 99% chance of damaging wind over 30 yrs
- Air quality 2/10 Low 1 unhealthy d/yr today · 1 by 30 yrs out
Nearby sold comps map
Loading sold comps map…
Walkable amenities ~0.75 mi
Loading nearby amenities…
Taxation est. · year 1
- Rental income
- $23,836
- − Mortgage interest
- −$9,467
- − Property taxes
- −$2,393
- − Insurance
- −$1,642
- − Repairs & maintenance
- −$1,907
- − Management
- −$1,907
- − HOA
- −$96
- − Depreciation
- −$4,916
- Taxable income
- $1,507
- Est. tax owed @ 24.0%
- −$362
- After-tax cash flow
- $3,702/yr
For passive investors: Depreciation is non-cash, so a rental often shows a tax loss while cash-flowing — sheltering income. Rental losses are passive: they offset passive income freely, and up to $25,000/yr can offset ordinary (W-2) income if you actively participate and your MAGI is under $100k (phasing out to $0 by $150k); unused losses carry forward. On sale, claimed depreciation is recaptured at up to 25%, and gains may owe capital-gains tax (a 1031 exchange can defer both). Figures are a year-1 estimate at your 24.0% rate — not tax advice; consult a CPA.
Schools (NCES district)
- District
- Charlotte
- NCES district ID
- 1200240
- Math proficiency
- 54% ▼ -6.00%
- Reading proficiency
- 54% ▼ -1.00%
- Median HH income
- $44,864
- Composite
- 45.62/100
- National rank
- #2586
- State rank
- #22 of 73 in FL
Livability — Englewood
- Score
- 73/100
- State rank
- #321
- US rank
- #5655
Category grades
Schools grade is shown separately in the Schools card above.
Census & demographics
- Census place
- Englewood, FL
- County
- Charlotte County · 196,994 people
- City population
- 35,420
- Metro
- Punta Gorda, FL
- Population (ZIP)
- 15,536
- Household income
- $57,281
- Rent vs Own
- Severe rent burden
- 329.0
Population outlook (Charlotte County) Hauer SSP2
- Today (2025)
- 198,646 people
- By 2030
- 210,507 · +6.0%
- By 2040
- 230,857 · +16.2%
- By 2050
- 247,148 · +24.4%
- By 2075
- 281,777 · +41.8%
- By 2100
- 293,609 · +47.8%
Race, ethnicity, and origin ACS 2023
- Neighborhood character
- Predominantly White (92%)
- Race & ethnicity
- White 92% Two or more races 5% Hispanic / Latino 3% Asian 1%
- Common ancestry
- Romanian 4% Slovak 4% Lithuanian 4%
- Foreign-born
- 9% · Canada
- Languages at home
- 92% English-only · Other Indo-European 2% Spanish 2% German/W. Germanic 1%
Political lean MEDSL · Charlotte
- 2024 margin
- Solid R (+34.0) · D 32.7% · R 66.7%
- 2008→2024 swing
- -26.7pp toward R · 2008: -7.2pp · 2024: -34.0pp
- All cycles
- 2024: R+34.0 2020: R+26.6 2016: R+27.8 2012: R+14.3 2008: R+7.2
Not yet ingested
- Civics
- —
Market trends
- HPI YoY
- ▼ -75.76%
- Current HPI
- 325.0345
- Rent YoY
- ▼ -0.11%
- Metro
- Punta Gorda, FL
- State GDP YoY
- ▲ 3.28%
- F500 in state
- 36
Industry mix (Fortune 500 HQ in FL)
| Industry | F500 HQs | Revenue |
|---|---|---|
| Industrial Technology | 2 | $29B |
|
||
| Insurance | 2 | $17B |
|
||
| Retail | 1 | $60B |
|
||
| Technology Distribution | 1 | $58B |
|
||
| Homebuilding | 1 | $35B |
|
||
| Technology Manufacturing | 1 | $35B |
|
||
Price history
+2716.7% since first listed9 events — show timeline
- 2026-04-06 Price Changed $169,000 Stellar MLS as Distributed by MLS Grid
- 2026-03-09 Price Changed $189,000 Stellar MLS as Distributed by MLS Grid
- 2025-08-11 Listed $195,000 Stellar MLS as Distributed by MLS Grid
- 2009-05-13 Sold (Public Records) $65,000 Public Records
- 2009-05-08 Sold (MLS) $65,000 Stellar MLS as Distributed by MLS Grid
- 2009-02-06 Listed $83,900 Stellar MLS as Distributed by MLS Grid
- 2002-01-28 Sold (Public Records) $64,900 Public Records
- 1990-02-01 Sold (Public Records) $52,000 Public Records
- 1978-03-01 Sold (Public Records) $6,000 Public Records
Property tax history
+7.2%/yrLatest (2025): $2,393 · -4.2% YoY. Source: county tax records.
Cash-flow waterfall
monthlySold comps — $/sqft
last 12 mo · ≤1 miLoading sold comps…