 7-Plex
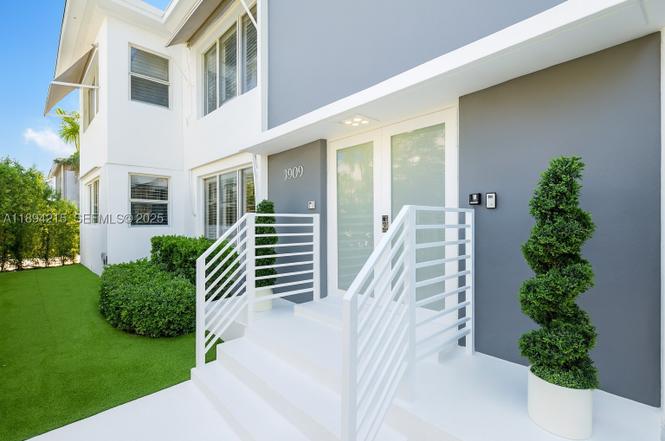
3909 Garden Ave · Miami Beach, FL
Flood risk 9/10 · Severe
- FEMA flood zone
- AE
- Chance of flooding over 30 yrs
- 0.99%
- Est. flood insurance / yr
- $1,737 – $8,500
Fire risk 3/10 · Minor
- Est. fire insurance / yr
- $947 – $1,759
Heat risk 10/10 · Severe
- Hot days now (above 101°F)
- 7 days/yr
- Hot days in 30 yrs
- 29 days/yr
Wind risk 10/10 · Severe
- Chance of severe wind over 30 yrs
- 99.0%
Air-quality risk 2/10 · Minimal
- Unhealthy air days now
- 1 days/yr
- Unhealthy air days in 30 yrs
- 1 days/yr
Risk factors via First Street. Map © Google.
Why this score? — see what drove the B+ grade
The composite is a weighted blend of 9 inputs, each scored 0–100. Each bar is that input's sub-score; the figure is the points it added to the 100-point composite (weight × sub-score).
- Cash flow +30.0/30.0
- DSCR +10.0/10.0
- 1% rule +9.6/10.0
- ARV discount +7.5/15.0
- Appreciation +5.5/10.0
- Schools +4.2/10.0
- Livability +4.0/5.0
- Rent growth +3.4/5.0
- Condition / age +2.5/5.0
$2,500,000
🖨 Deal sheet 📄 Offer letter ✓ Due diligence
Multi-family units
County records classify this as Multi-Family (5+ Unit). Listing-text estimate: 7 units. confirmed
5+ unit building — per-unit beds/baths from public records are typically unavailable; the breakdown below (if shown) is an estimate from the listing text.
Listing remarks
An architectural gem Miami Beach’s prime location. Completely redesigned with a contemporary flair . This four-unit building features spacious 2-bedroom apartments, each approximately 1,000 SF with open kitchens, custom closets, Central AC and impact windows washer & Dryer. This Residence Building is finished with top-of-the-line materials and luxury craftsmanship. Most desirable neighborhoods surrounded by multimillion-dollar villas and luxury condominiums, this property offers a strong community environment, A-rated schools, and proximity to restaurants, offices, and beaches , just 20 minutes from Miami International Airport and major highways. All units are leased to qualifi
Key facts
- Central ac
- Open kitchens
- Custom closets
Tags
Property features AI
Finance
- Financial info: Property contains multiple rental units (total of 10 units: four + three + two + one); Units show current rents around $4,000–$4,250 per unit (varies by unit); Units are unfurnished
- HOA & community: Gardener, pest control, sewer, trash collection and water may be included in some rental arrangements
Exterior
- Parking: On-street parking
- Security: High-impact doors
- Utilities: Public water; Public sewer; Cable available
- Home design: Two-story building; Concrete flat roof; Block construction; Resale property
- Construction: Block construction; Concrete flat roof; Model: The New Miami Beach
- Exterior features: Barbecue area; Security/high-impact doors; Exterior lighting; Automatic sprinklers
Interior
- Kitchen: Some units include a dishwasher
- Bedrooms: Multiple two-bedroom units (all units are 2-bedrooms)
- Flooring: Ceramic tile flooring
- Bathrooms: Each unit has two full bathrooms
- Heating & cooling: Central heating; Central air conditioning; Some units have individual air conditioning units
- Interior features: Impact glass windows; Updated/remodeled condition
- Laundry & utility: Washer/dryer hookups in some units; On-site laundry room (in at least one unit); Community laundry facilities
Neighborhood map
What this means for you Summary
Snapshot
- This is a 7 × 3-bed/2.9-bath units multifamily listed at $2.50M.
Deal economics
- At list price, monthly cash flow is $11k ($134k/yr) — positive. Per door: $2k/mo.
- The deal already cash-flows at list — no discount required.
- Meets the 1% rule at list price ($37k rent vs $2.50M).
- Recommended offer: $2.20M (12.0% below list) — sets the bar for market timing.
- Cap rate 11.9% vs local median 1.5% in Miami Beach — top-decile yield for the area; either an underpriced asset or a hidden risk that comps aren't pricing in. Stress-test before assuming the spread holds.
Location & tenants
- Location reads 80/100 on livability (#108 in FL, #1,672 nationally) — a professional / high-income tenant draw. Strengths: crime A+, commute A+, health & safety A+; Watch: housing C-, amenities D-, cost of living F.
- Miami-Dade (suburban): math 45% / reading 54% proficiency, ranked #40 of 73 in FL (top 55%) — families likely to look elsewhere, expect single-tenant / working-renter base with shorter leases; 64% free/reduced lunch — lower-income household profile, screen leases tightly.
- Market conditions: Rents rising (+3.5%/yr); 670 active listings in the ZIP; solid renter incomes; 10,051 units permitted in Miami-Dade County in 2024 (7,758 in 5+ unit buildings).
Forward outlook
- In year one you build about $41k of equity ($17k loan paydown + $24k appreciation (1.0% local appreciation)).
- Miami-Dade County population projected at +28% by 2050 — long-run rental-demand tailwind backs the buy-and-hold thesis.
- At projected returns (1.0% appreciation + 3.5% rent growth), your $700k cash investment doubles in ~4 years — after that, you're playing with house money.
- By year 4, paydown + projected appreciation supports a ~$151k cash-out refi (75% LTV) — recoverable capital for the next deal without selling this one.
Negotiation context
- It's been on market 245 days — a 12% lower offer ($2.20M) is reasonable based on typical stale-listing flexibility.
- 22 sale attempts since 5y ago; this cycle's ask has dropped $400k (14%) from the opening price — seller is motivated, your offer sets the floor, not the list.
- Current owner paid $1.98M; 27% above their basis — modest negotiation headroom, anchor on the comps not their cost.
Risks & watch-outs
- Watch-outs: flood insurance adds $427/mo.
- Climate carrying-cost: in FEMA flood zone AE (mandatory federal flood insurance); severe wind risk, 99% chance of damaging wind over 30y; extreme-heat days projected 7→29/yr by 2055 (HVAC capex compounding) — expect insurance premiums to compound above CPI over the hold.
Questions for the listing agent
- It's been on market 245 days. Have you received any prior offers? Is the seller open to a 12% concession, seller financing, or rate buy-down credit?
- Can we see the unit-by-unit rent roll, current vacancy, and any below-market leases? What's the average tenancy length?
- What capital expenditures (roof, boiler, parking lot, exteriors) have been made in the last 5 years, and what's planned in the next 2?
- What's the actual annual flood-insurance premium (NFIP or private), and is the property in a SFHA with mandatory coverage?
- Why hasn't it sold? Are there any deal-killer items the seller is aware of (foundation, flood, title, zoning, code violations)?
- Is there a deadline driving the sale (1031 exchange, divorce, estate, relocation)? That informs how much negotiation room exists.
- Schools are A-rated — typically a magnet for longer-tenancy family renters. What's the average tenant stay here, and is there a school-zone premium baked into asking?
- What's the average days-on-market for RENTAL listings here right now (not sales)? A rising rental-DOM trend means longer vacancies and softer asking-rent achievability than the comps imply.
- What's the recent tenant-quality profile in this submarket — average credit score on applications, eviction rate, late-payment / NSF rate, and stable-employment percentage? A property-management company in the area should have these aggregated.
- How much new apartment / multifamily construction is in the pipeline within 1–3 miles? Heavy new supply (>2% of stock underway) typically softens rents 12–24 months out; light construction supports rent growth.
Investment metrics
- 1% rule
- 1.46% ✓
- Cap rate
- 11.87%
- Cash-on-cash
- 19.92%
- DSCR
- 1.89
- GRM
- 5.7
CMA / ARV
No comps found within radius.
Projected returns pro-forma
0.96% appreciation · 3.52% rent growth · sell at horizon
- IRR
- 21.6%
- Equity multiple
- 2.11×
- Total profit
- $775,361
- Equity at exit
- $848,899
- IRR
- 25.0%
- Equity multiple
- 4.06×
- Total profit
- $2,140,350
- Equity at exit
- $1,124,594
Cash invested: $700,000 (down + closing). Projections, not guarantees.
Landlord ↔ Tenant lean methodology
- Overall (STATE)
- 87 Strongly Landlord-Friendly
- State Florida
- 87 Strongly Landlord-Friendly · R+3
- County
- — inherits STATE
- City
- — inherits STATE
ZIP-level market 33140
- Home prices YoY
- 0.3%
- Rents YoY
- 3.5%
- Active inventory
- 670
- Price-to-rent
- 39.9×
Monthly cashflow live
- Estimated rent
- $36,577 medium interval (Pro) →
- Mortgage (P&I)
- −$13,110
- Tax est. 1.5%
- −$3,125 /mo · $37,500/yr
- Insurance
- −$1,042
- Flood insurance flood zone
- −$427 /mo · $5,118/yr
- HOA
- −$0
- Vacancy / Maint / Mgmt
- −$7,681
- Net cashflow
- $11,192
Break-even live
7-unit breakdown (identical units grouped — click to expand)
| Units | Beds | Baths | Est. rent |
|---|---|---|---|
| 7× units | 3 | 2.9 | $36,575 |
| #1 | 3 | 2.9 | $5,225 |
| #2 | 3 | 2.9 | $5,225 |
| #3 | 3 | 2.9 | $5,225 |
| #4 | 3 | 2.9 | $5,225 |
| #5 | 3 | 2.9 | $5,225 |
| #6 | 3 | 2.9 | $5,225 |
| #7 | 3 | 2.9 | $5,225 |
| Total (7 units) | $36,577 | ||
UW: 25.0% down · 7.5% · 30yr · 1.5% tax · 5.0% vac · 8.0% maint · 8.0% mgmt
Financing live
Cash to close
- Down payment
- $625,000
- Closing costs
- $75,000
- Reserves months
- —
- Total cash needed
- —
Loan-product check · same deal, 3 products live
Conventional
25% down · 7.5% · 30yr
- Down + closing
- —
- Monthly P&I
- —
- Monthly cashflow
- —
- DSCR
- —
- Eligible?
- —
Personal DTI + credit; lowest rate.
DSCR
20% down · 8.5% · 30yr
- Down + closing
- —
- Monthly P&I
- —
- Monthly cashflow
- —
- DSCR
- —
- Eligible?
- —
No personal income docs; deal must DSCR.
Hard money
10% down · 12.0% · 12mo
- Down + closing
- —
- Monthly P&I
- —
- Monthly cashflow
- —
- DSCR
- —
- Eligible?
- —
Short-term bridge; refi at stabilization.
Listing history 50 events
-
2026-06-18days on market $2,500,000 Active 245 DOM
-
2026-06-17days on market $2,500,000 Active 244 DOM
-
2026-06-16days on market $2,500,000 Active 243 DOM
-
2026-06-15days on market $2,500,000 Active 242 DOM
-
2026-06-13days on market $2,500,000 Active 240 DOM
-
2026-06-09days on market $2,500,000 Active 236 DOM
-
2026-06-08days on market $2,500,000 Active 235 DOM
-
2026-06-08days on market $2,500,000 Active 234 DOM
-
2026-06-04days on market $2,500,000 Active 231 DOM
-
2026-06-03days on market $2,500,000 Active 230 DOM
-
2026-06-02days on market $2,500,000 Active 229 DOM
-
2026-06-01days on market $2,500,000 Active 228 DOM
-
2026-05-31days on market $2,500,000 Active 227 DOM
-
2026-01-13price $2,500,000
-
2025-10-15$2,900,000 Active
-
2025-06-11historical
-
2024-09-27$2,850,000 Active
-
2024-09-19historical $4,000
-
2024-09-15$4,000
-
2024-09-15historical $4,000
-
2024-09-10$4,000
-
2024-09-10historical $4,000
-
2024-09-05$4,000
-
2024-09-05historical $4,000
-
2024-09-04$4,000
-
2024-09-04historical $4,000
-
2024-09-03$4,000
-
2024-09-03historical $4,000
-
2024-09-02$4,000
-
2024-09-02historical $4,000
-
2024-08-28$4,000
-
2024-08-28historical $4,000
-
2024-08-24historical $4,000
-
2024-08-24$4,000
-
2024-08-20historical $4,000
-
2024-08-20$4,000
-
2024-08-15$4,000
-
2024-08-15historical $4,000
-
2024-08-10$4,000
-
2024-08-10historical $4,000
-
2024-08-01$4,000
-
2024-08-01historical $4,000
-
2024-07-29$4,000
-
2023-09-26$2,890,000 Active
-
2023-08-15historical
-
2023-08-15historical
-
2023-08-14price $2,700,000
-
2023-08-14price $2,700,000
-
2023-08-07$2,890,000 Active
-
2023-07-10price $2,890,000
ⓘ Source: listings_history table (triggers on properties + properties_extension) + one-shot
backfill from property_details.listing_events for pre-trigger history.
Climate risk First Street
- Flood 9/10 Extreme FEMA zone AE · 99% chance over 30 yrs
- Wildfire 3/10 Moderate
- Heat 10/10 Extreme 7 d/yr ≥101°F today · 29 d/yr by 30 yrs out
- Wind 10/10 Extreme 99% chance of damaging wind over 30 yrs
- Air quality 2/10 Low 1 unhealthy d/yr today · 1 by 30 yrs out
Nearby sold comps map
Loading sold comps map…
Walkable amenities ~0.75 mi
Loading nearby amenities…
Taxation est. · year 1
- Rental income
- $438,924
- − Mortgage interest
- −$140,039
- − Property taxes
- −$37,500
- − Insurance
- −$17,618
- − Repairs & maintenance
- −$35,114
- − Management
- −$35,114
- − Depreciation
- −$72,727
- Taxable income
- $100,812
- Est. tax owed @ 24.0%
- −$24,195
- After-tax cash flow
- $110,113/yr
For passive investors: Depreciation is non-cash, so a rental often shows a tax loss while cash-flowing — sheltering income. Rental losses are passive: they offset passive income freely, and up to $25,000/yr can offset ordinary (W-2) income if you actively participate and your MAGI is under $100k (phasing out to $0 by $150k); unused losses carry forward. On sale, claimed depreciation is recaptured at up to 25%, and gains may owe capital-gains tax (a 1031 exchange can defer both). Figures are a year-1 estimate at your 24.0% rate — not tax advice; consult a CPA.
Schools (NCES district)
- District
- Miami-Dade
- NCES district ID
- 1200390
- Math proficiency
- 45% ▼ -16.00%
- Reading proficiency
- 54% ▼ -5.00%
- Median HH income
- $43,928
- Composite
- 41.76/100
- National rank
- #3397
- State rank
- #40 of 73 in FL
Livability — Miami Beach
- Score
- 80/100
- State rank
- #108
- US rank
- #1672
Category grades
Schools grade is shown separately in the Schools card above.
Census & demographics
- Census place
- Miami Beach, FL
- County
- Miami-Dade County · 2,697,751 people
- City population
- 90,533
- Metro
- Miami-Fort Lauderdale-Pompano Beach, FL
- Population (ZIP)
- 20,342
- Household income
- $107,063
- Rent vs Own
- Severe rent burden
- 870.0
Population outlook (Miami-Dade County) Hauer SSP2
- Today (2025)
- 3,126,439 people
- By 2030
- 3,325,765 · +6.4%
- By 2040
- 3,697,561 · +18.3%
- By 2050
- 4,012,134 · +28.3%
- By 2075
- 4,605,612 · +47.3%
- By 2100
- 4,866,598 · +55.7%
Race, ethnicity, and origin ACS 2023
- Neighborhood character
- Diverse neighborhood (Simpson 0.59)
- Race & ethnicity
- White 46% Hispanic / Latino 44% Two or more races 23% Black 3% Asian 2%
- Hispanic origin (detail)
- Mexican 2% Puerto Rican 2% Cuban 19% Salvadoran 6%
- Common ancestry
- Scotch-Irish 5% Romanian 3% Italian 3%
- Foreign-born
- 44% · Canada, Dominican Republic, Jamaica
- Languages at home
- 43% English-only · Spanish 45% Other Indo-European 6% French/Haitian/Cajun 2%
Political lean MEDSL · Miami-Dade
- 2024 margin
- R (+11.4) · D 43.9% · R 55.4%
- 2008→2024 swing
- -27.6pp toward R · 2008: 16.1pp · 2024: -11.4pp
- All cycles
- 2024: R+11.4 2020: D+7.3 2016: D+29.6 2012: D+23.7 2008: D+16.1
Not yet ingested
- Civics
- —
Market trends
- HPI YoY
- ▲ 0.96%
- Current HPI
- 302.8514
- Rent YoY
- ▲ 3.52%
- Metro
- Miami-Fort Lauderdale-Pompano Beach, FL
- State GDP YoY
- ▲ 3.28%
- F500 in state
- 36
Industry mix (Fortune 500 HQ in FL)
| Industry | F500 HQs | Revenue |
|---|---|---|
| Industrial Technology | 2 | $29B |
|
||
| Insurance | 2 | $17B |
|
||
| Retail | 1 | $60B |
|
||
| Technology Distribution | 1 | $58B |
|
||
| Homebuilding | 1 | $35B |
|
||
| Technology Manufacturing | 1 | $35B |
|
||
Price history
+19.0% since first listed49 events — show timeline
- 2026-01-13 Price Changed $2,500,000 MARMLS
- 2025-10-15 Listed $2,900,000 MARMLS
- 2025-06-11 Listing Removed — MARMLS
- 2024-09-27 Listed $2,850,000 MARMLS
- 2024-09-19 Rental Removed $4,000 REALLYO
- 2024-09-15 Listed for Rent $4,000 REALLYO
- 2024-09-15 Rental Removed $4,000 REALLYO
- 2024-09-10 Listed for Rent $4,000 REALLYO
- 2024-09-10 Rental Removed $4,000 REALLYO
- 2024-09-05 Listed for Rent $4,000 REALLYO
- 2024-09-05 Rental Removed $4,000 REALLYO
- 2024-09-04 Listed for Rent $4,000 REALLYO
- 2024-09-04 Rental Removed $4,000 REALLYO
- 2024-09-03 Listed for Rent $4,000 REALLYO
- 2024-09-03 Rental Removed $4,000 REALLYO
- 2024-09-02 Listed for Rent $4,000 REALLYO
- 2024-09-02 Rental Removed $4,000 REALLYO
- 2024-08-28 Listed for Rent $4,000 REALLYO
- 2024-08-28 Rental Removed $4,000 REALLYO
- 2024-08-24 Rental Removed $4,000 REALLYO
- 2024-08-24 Listed for Rent $4,000 REALLYO
- 2024-08-20 Rental Removed $4,000 REALLYO
- 2024-08-20 Listed for Rent $4,000 REALLYO
- 2024-08-15 Listed for Rent $4,000 REALLYO
- 2024-08-15 Rental Removed $4,000 REALLYO
- 2024-08-10 Listed for Rent $4,000 REALLYO
- 2024-08-10 Rental Removed $4,000 REALLYO
- 2024-08-01 Listed for Rent $4,000 REALLYO
- 2024-08-01 Rental Removed $4,000 REALLYO
- 2024-07-29 Listed for Rent $4,000 REALLYO
- 2023-09-26 Listed $2,890,000 MARMLS
- 2023-08-15 Listing Removed — MARMLS
- 2023-08-15 Listing Removed — MARMLS
- 2023-08-14 Price Changed $2,700,000 MARMLS
- 2023-08-14 Price Changed $2,700,000 MARMLS
- 2023-08-07 Listed $2,890,000 MARMLS
- 2023-07-10 Price Changed $2,890,000 MARMLS
- 2023-06-14 Relisted — MARMLS
- 2023-06-14 Price Changed $2,950,000 MARMLS
- 2023-05-31 Relisted — MARMLS
- 2023-03-27 Relisted — MARMLS
- 2023-03-15 Price Changed $2,890,000 MARMLS
- 2023-02-09 Price Changed $2,800,000 MARMLS
- 2023-01-10 Price Changed $2,850,000 MARMLS
- 2022-09-01 Listed $2,950,000 MARMLS
- 2022-08-20 Price Changed $4,200 RENT.
- 2021-12-30 Sold (MLS) $1,975,000 MARMLS
- 2021-09-30 Contingent — MARMLS
- 2021-05-24 Listed $2,100,000 MARMLS
Cash-flow waterfall
monthlySold comps — $/sqft
last 12 mo · ≤1 miLoading sold comps…