 Fourplex
1617 N El Dorado St · Stockton, CA
Flood risk 5/10 · Moderate
- FEMA flood zone
- X
- Chance of flooding over 30 yrs
- 0.24%
- Est. flood insurance / yr
- $507 – $1,088
Fire risk 1/10 · Minimal
- Est. fire insurance / yr
- $659 – $1,223
Heat risk 7/10 · Major
- Hot days now (above 103°F)
- 7 days/yr
- Hot days in 30 yrs
- 15 days/yr
Wind risk 1/10 · Minimal
- Chance of severe wind over 30 yrs
- —
Air-quality risk 10/10 · Severe
- Unhealthy air days now
- 30 days/yr
- Unhealthy air days in 30 yrs
- 30 days/yr
Risk factors via First Street. Map © Google.
Why this score? — see what drove the D grade
The composite is a weighted blend of 9 inputs, each scored 0–100. Each bar is that input's sub-score; the figure is the points it added to the 100-point composite (weight × sub-score).
- Cash flow +18.3/30.0
- DSCR +5.7/10.0
- ARV discount +5.0/15.0
- 1% rule +4.4/10.0
- Rent growth +3.1/5.0
- Schools +2.9/10.0
- Livability +2.9/5.0
- Condition / age +2.5/5.0
- Appreciation +0.0/10.0
$729,999
🖨 Deal sheet (PDF) 📄 Offer letter ✓ Due diligence
Multi-family units
County records classify this as Multi-Family (2-4 Unit). Listing-text estimate: 4 units. confirmed
Listing remarks
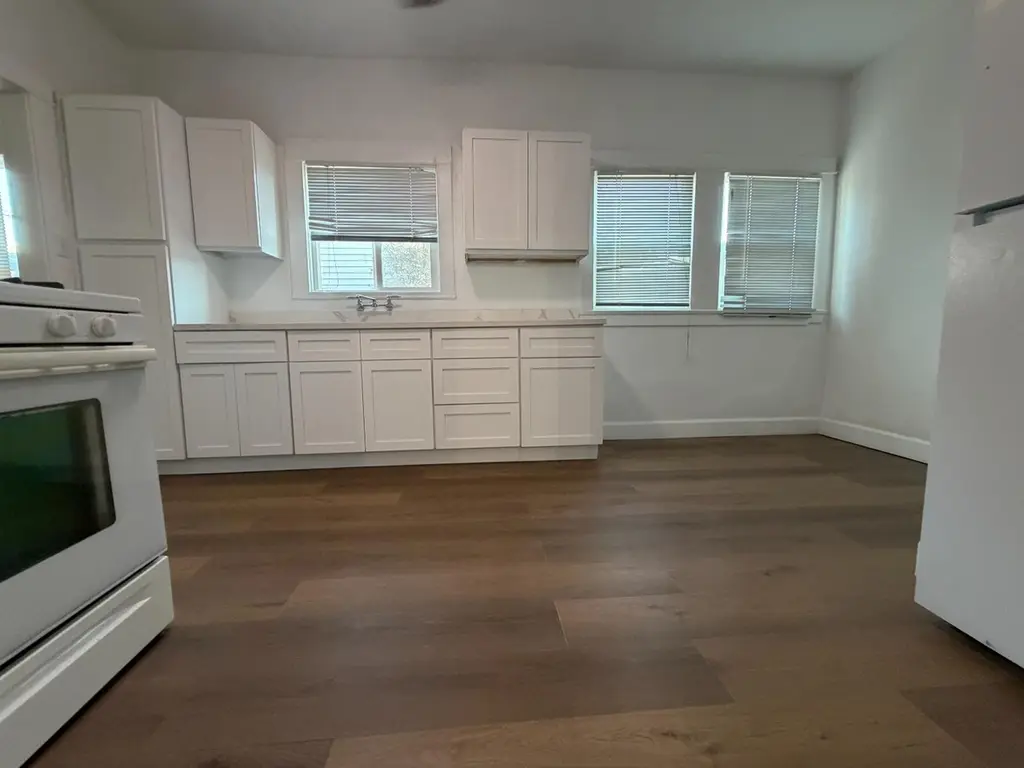
RARE opportunity to own a well-maintained, income-producing four-plex in one of Stockton's most desirable and walkable neighborhoods. Just moments from Miracle Mile, Downtown Stockton, and the University of the Pacific (UOP). Multi-family properties with four units are becoming increasingly difficult to find, making this an exceptional opportunity for investors or owner-occupants seeking long-term value and stable cash flow. Blending timeless 1920s character with thoughtful modern updates, this charming property offers both strong investment fundamentals and an appealing lifestyle for tenants. Residents enjoy being within walking distance to an exciting mix of local restaurants featuring Ja
Key facts
- Open floor plan
- Modern updates
- Four plex
Tags
Neighborhood map
What this means for you Summary
Snapshot
- This is a 4 × 2-bed/1.0-bath units multifamily listed at $730k.
Deal economics
- At list price, monthly cash flow is $667 ($8k/yr) — positive. Per door: $167/mo.
- The deal already cash-flows at list — no discount required.
- To meet the 1% rule (rent ≥ 1% of price), the offer needs to be $685k (6.2% below list).
- Recommended offer: $664k (9.0% below list) — sets the bar for market timing.
- Cap rate 7.4% vs local median 3.6% in Stockton — top-decile yield for the area; either an underpriced asset or a hidden risk that comps aren't pricing in. Stress-test before assuming the spread holds.
Location & tenants
- Location reads 57/100 on livability (#734 in CA) — a working-class tenant base; expect higher turnover. Strengths: housing A+, health & safety A, amenities A-; Watch: employment C-, crime F, commute F.
- Stockton Unified (urban): math 23% / reading 46% proficiency, ranked #295 of 517 in CA (top 57%) — families likely to look elsewhere, expect single-tenant / working-renter base with shorter leases; 78% free/reduced lunch — lower-income household profile, screen leases tightly.
- Zoned schools: Cleveland Elementary (652 students, 78% FRL); Stagg Senior High (math 12% / reading 32%, grade F, #950 of 1,170 statewide, top 82%, 1,773 students, 71% FRL) — zoned schools at 75% FRL track the district average.
- Zoned-school proficiency averages 22% at this address vs 34% district-wide (-12 pts) — the specific schools serving this property underperform the Stockton Unified average; the district grade overstates school quality for this exact location.
- Market conditions: Rents rising (+2.4%/yr); 140 active listings in the ZIP; solid renter incomes; 3,779 units permitted in San Joaquin County in 2024 (0 in 5+ unit buildings).
Forward outlook
- Local home prices are declining (-3.0%/yr); year-one equity from $5k of loan paydown is wiped out by about $22k of value loss. Plan a longer hold.
- San Joaquin County population projected at +17% by 2050 — long-run rental-demand tailwind backs the buy-and-hold thesis.
Negotiation context
- It's been on market 104 days — a 9% lower offer ($664k) is reasonable based on typical stale-listing flexibility.
- 2 sale attempts since 2y ago; this cycle's ask is 48729% above the opening price — seller raised mid-cycle; expect resistance to lowballs.
- Current owner paid $550k; 33% above their basis — modest negotiation headroom, anchor on the comps not their cost.
Risks & watch-outs
- Watch-outs: built in 1924 — expect roof / HVAC / electrical / plumbing capex.
- Climate carrying-cost: moderate flood risk; extreme-heat days projected 7→15/yr by 2055 (HVAC capex compounding) — expect insurance premiums to compound above CPI over the hold.
Questions for the listing agent
- It's been on market 104 days. Have you received any prior offers? Is the seller open to a 9% concession, seller financing, or rate buy-down credit?
- Can we see the unit-by-unit rent roll, current vacancy, and any below-market leases? What's the average tenancy length?
- What capital expenditures (roof, boiler, parking lot, exteriors) have been made in the last 5 years, and what's planned in the next 2?
- Built in 1924 — when were the roof, HVAC, electrical panel, plumbing, and water heater last replaced?
- Why hasn't it sold? Are there any deal-killer items the seller is aware of (foundation, flood, title, zoning, code violations)?
- Is there a deadline driving the sale (1031 exchange, divorce, estate, relocation)? That informs how much negotiation room exists.
- Schools are D-rated, which usually means shorter tenancies and higher turnover. Who's the typical renter profile here, and what's been the actual vacancy rate?
- Crime grade is F in this area — have there been break-ins, vandalism, or insurance claims at this property in the last 3 years? What carrier currently insures it and at what premium?
- The area grade is low — what's the realistic commute time and amenity access for the typical tenant pool here? Any planned neighborhood developments (good or bad) we should know about?
- What's the average days-on-market for RENTAL listings here right now (not sales)? A rising rental-DOM trend means longer vacancies and softer asking-rent achievability than the comps imply.
- What's the recent tenant-quality profile in this submarket — average credit score on applications, eviction rate, late-payment / NSF rate, and stable-employment percentage? A property-management company in the area should have these aggregated.
- How much new apartment / multifamily construction is in the pipeline within 1–3 miles? Heavy new supply (>2% of stock underway) typically softens rents 12–24 months out; light construction supports rent growth.
Investment metrics
- 1% rule
- 0.94% ✗
- Cap rate
- 7.39%
- Cash-on-cash
- 3.92%
- DSCR
- 1.17
- GRM
- 8.9
CMA / ARV
- ARV (median comp)
- $691,521
- List price
- $729,999
- Delta
- 5.56%
- Verdict
- FAIR
- Comps
- 20 within 1.0 mi
Projected returns pro-forma
-3.0% appreciation · 2.37% rent growth · sell at horizon
- IRR
- -10.9%
- Equity multiple
- 0.61×
- Total profit
- $-80,190
- Equity at exit
- $108,845
- IRR
- -2.5%
- Equity multiple
- 0.84×
- Total profit
- $-32,919
- Equity at exit
- $63,117
Cash invested: $204,400 (down + closing). Projections, not guarantees.
Landlord ↔ Tenant lean methodology
- Overall (STATE)
- 18 Strongly Tenant-Friendly
- State California
- 18 Strongly Tenant-Friendly · D+13
- County
- — inherits STATE
- City
- — inherits STATE
ZIP-level market 95204
- Rents YoY
- 2.4%
- Active inventory
- 140
- Price-to-rent
- 35.5×
Monthly cashflow live
- Estimated rent
- $6,851 high interval (Pro) →
- Mortgage (P&I)
- −$3,828
- Tax from tax record
- −$613 /mo · $7,352/yr
- Insurance
- −$304
- HOA
- −$0
- Vacancy / Maint / Mgmt
- −$1,439
- Net cashflow
- $667
Break-even live
Sensitivity live
| Price | -10% $1,080 | -5% $874 | +0% $667 | +5% $461 | +10% $254 |
|---|---|---|---|---|---|
| Rent | -10% $126 | -5% $397 | +0% $667 | +5% $938 | +10% $1,208 |
| Rate | -1.0pp $1,035 | -0.5pp $853 | base $667 | +0.5pp $478 | +1.0pp $286 |
4-unit breakdown (identical units grouped — click to expand)
| Units | Beds | Baths | Est. rent |
|---|---|---|---|
| 4× units | 2 | 1 | $6,852 |
| #1 | 2 | 1 | $1,713 |
| #2 | 2 | 1 | $1,713 |
| #3 | 2 | 1 | $1,713 |
| #4 | 2 | 1 | $1,713 |
| Total (4 units) | $6,851 | ||
UW: 25.0% down · 7.5% · 30yr · 1.5% tax · 5.0% vac · 8.0% maint · 8.0% mgmt
Financing live
Cash to close
- Down payment
- $182,500
- Closing costs
- $21,900
- Reserves months
- —
- Total cash needed
- —
Loan-product check · same deal, 3 products live
Conventional
25% down · 7.5% · 30yr
- Down + closing
- —
- Monthly P&I
- —
- Monthly cashflow
- —
- DSCR
- —
- Eligible?
- —
Personal DTI + credit; lowest rate.
DSCR
20% down · 8.5% · 30yr
- Down + closing
- —
- Monthly P&I
- —
- Monthly cashflow
- —
- DSCR
- —
- Eligible?
- —
No personal income docs; deal must DSCR.
Hard money
10% down · 12.0% · 12mo
- Down + closing
- —
- Monthly P&I
- —
- Monthly cashflow
- —
- DSCR
- —
- Eligible?
- —
Short-term bridge; refi at stabilization.
Listing history 23 events
-
2026-06-21days on market $729,999 Active 104 DOM
-
2026-06-18days on market $729,999 Active 101 DOM
-
2026-06-17days on market $729,999 Active 100 DOM
-
2026-06-16days on market $729,999 Active 99 DOM
-
2026-06-15days on market $729,999 Active 98 DOM
-
2026-06-14days on market $729,999 Active 96 DOM
-
2026-06-10days on market $729,999 Active 93 DOM
-
2026-06-09days on market $729,999 Active 92 DOM
-
2026-06-08days on market $729,999 Active 91 DOM
-
2026-06-07days on market $729,999 Active 90 DOM
-
2026-06-05days on market $729,999 Active 87 DOM
-
2026-06-03days on market $729,999 Active 86 DOM
-
2026-06-03days on market $729,999 Active 85 DOM
-
2026-06-01days on market $729,999 Active 84 DOM
-
2026-05-31days on market $729,999 Active 83 DOM
-
2025-03-30historical $1,495
-
2025-02-18$1,495
-
2024-09-19historical $1,495
-
2024-08-16price $1,495
-
2024-07-20$1,600
-
2021-04-23soldstatus $550,000
-
2020-07-31soldstatus $305,000
-
1989-08-10soldstatus $115,000
ⓘ Source: listings_history table (triggers on properties + properties_extension) + one-shot
backfill from property_details.listing_events for pre-trigger history.
Tax reassessment forecast CA · Resets to sale price
- Current annual tax
- $7,352 · $613/mo
- Projected year-2 tax
- $7,352 · $613/mo
- Expected delta
- $0/yr ($0/mo · 0.0%)
ⓘ Screening estimate from a state-policy table — verify with the county assessor before closing.
Climate risk First Street
- Flood 5/10 Major FEMA zone X · 24% chance over 30 yrs
- Wildfire 1/10 Low
- Heat 7/10 Severe 7 d/yr ≥103°F today · 15 d/yr by 30 yrs out
- Wind 1/10 Low
- Air quality 10/10 Extreme 30 unhealthy d/yr today · 30 by 30 yrs out
Nearby sold comps map
Loading sold comps map…
Walkable amenities ~0.75 mi
Loading nearby amenities…
Taxation est. · year 1
- Rental income
- $82,212
- − Mortgage interest
- −$40,891
- − Property taxes
- −$7,352
- − Insurance
- −$3,650
- − Repairs & maintenance
- −$6,577
- − Management
- −$6,577
- − Depreciation
- −$21,236
- Taxable loss
- −$4,072
- Est. tax savings @ 24.0%
- +$977
- After-tax cash flow
- $8,984/yr
For passive investors: Depreciation is non-cash, so a rental often shows a tax loss while cash-flowing — sheltering income. Rental losses are passive: they offset passive income freely, and up to $25,000/yr can offset ordinary (W-2) income if you actively participate and your MAGI is under $100k (phasing out to $0 by $150k); unused losses carry forward. On sale, claimed depreciation is recaptured at up to 25%, and gains may owe capital-gains tax (a 1031 exchange can defer both). Figures are a year-1 estimate at your 24.0% rate — not tax advice; consult a CPA.
Schools (NCES district)
- District
- Stockton Unified
- NCES district ID
- 0638010
- Math proficiency
- 23% ▲ 2.00%
- Reading proficiency
- 46% ▲ 16.00%
- Median HH income
- $37,563
- Composite
- 28.65/100
- National rank
- #6701
- State rank
- #295 of 517 in CA
Livability — Stockton
- Score
- 57/100
- State rank
- #734
- US rank
- #21638
Category grades
Schools grade is shown separately in the Schools card above.
Census & demographics
- Census place
- Stockton, CA
- County
- San Joaquin County · 729,570 people
- City population
- 332,006
- Metro
- Stockton, CA
- Population (ZIP)
- 31,035
- Household income
- $75,548
- Rent vs Own
- Severe rent burden
- 1434.0
Population outlook (San Joaquin County) Hauer SSP2
- Today (2025)
- 796,965 people
- By 2030
- 828,849 · +4.0%
- By 2040
- 885,611 · +11.1%
- By 2050
- 929,798 · +16.7%
- By 2075
- 994,578 · +24.8%
- By 2100
- 971,291 · +21.9%
Race, ethnicity, and origin ACS 2023
- Neighborhood character
- Diverse neighborhood (Simpson 0.66)
- Race & ethnicity
- Hispanic / Latino 48% White 31% Two or more races 18% Asian 9% Black 7% Native American 2%
- Hispanic origin (detail)
- Mexican 42%
- Common ancestry
- Slovak 2% Russian 1% Italian 1%
- Foreign-born
- 18% · Canada, Vietnam, China
- Languages at home
- 67% English-only · Spanish 27% Other Asian/Pacific 3% Tagalog/Filipino 2%
Political lean MEDSL · San Joaquin
- 2024 margin
- Toss-up / Even · D 48.0% · R 48.9% · Other 3.0%
- 2008→2024 swing
- -11.6pp toward R · 2008: 10.7pp · 2024: -0.9pp
- All cycles
- 2024: R+0.9 2020: D+13.9 2016: D+12.9 2012: D+8.9 2008: D+10.7
Not yet ingested
- Civics
- —
Market trends
- HPI YoY
- ▼ -386.16%
- Current HPI
- 333.3367
- Rent YoY
- ▲ 2.37%
- Metro
- Stockton, CA
- State GDP YoY
- ▲ 3.21%
- F500 in state
- 116
Industry mix (Fortune 500 HQ in CA)
| Industry | F500 HQs | Revenue |
|---|---|---|
| Technology | 27 | $1,492B |
|
||
| Financial Services | 3 | $174B |
|
||
| Retail | 3 | $44B |
|
||
| Insurance | 3 | $26B |
|
||
| Media / Entertainment | 2 | $115B |
|
||
| Pharmaceuticals / Biotech | 2 | $62B |
|
||
Price history
-98.7% since first listed8 events — show timeline
- 2025-03-30 Rental Removed $1,495 BUILDIUM
- 2025-02-18 Listed for Rent $1,495 BUILDIUM
- 2024-09-19 Rental Removed $1,495 BUILDIUM
- 2024-08-16 Price Changed $1,495 BUILDIUM
- 2024-07-20 Listed for Rent $1,600 BUILDIUM
- 2021-04-23 Sold (Public Records) $550,000 Public Records
- 2020-07-31 Sold (Public Records) $305,000 Public Records
- 1989-08-10 Sold (Public Records) $115,000 Public Records
Property tax history
+8.0%/yrLatest (2025): $7,352 · +1.6% YoY. Source: county tax records.
Cash-flow waterfall
monthlySold comps — $/sqft
last 12 mo · ≤1 miLoading sold comps…