21923 Ottawa Rd #12 · Apple Valley, CA
Flood risk 1/10 · Minimal
- FEMA flood zone
- D
- Chance of flooding over 30 yrs
- 0.0%
- Est. flood insurance / yr
- $544 – $1,084
Fire risk 6/10 · Moderate
- Est. fire insurance / yr
- $659 – $1,223
Heat risk 7/10 · Major
- Hot days now (above 100°F)
- 4 days/yr
- Hot days in 30 yrs
- 10 days/yr
Wind risk 1/10 · Minimal
- Chance of severe wind over 30 yrs
- —
Air-quality risk 10/10 · Severe
- Unhealthy air days now
- 25 days/yr
- Unhealthy air days in 30 yrs
- 30 days/yr
Risk factors via First Street. Map © Google.
Why this score? — see what drove the B grade
The composite is a weighted blend of 9 inputs, each scored 0–100. Each bar is that input's sub-score; the figure is the points it added to the 100-point composite (weight × sub-score).
- Cash flow +30.0/30.0
- 1% rule +10.0/10.0
- DSCR +10.0/10.0
- ARV discount +7.5/15.0
- Condition / age +3.8/5.0
- Rent growth +3.6/5.0
- Schools +3.1/10.0
- Livability +3.1/5.0
- Appreciation +0.0/10.0
$37,000
🖨 Deal sheet (PDF) 📄 Offer letter ✓ Due diligence
Listing remarks
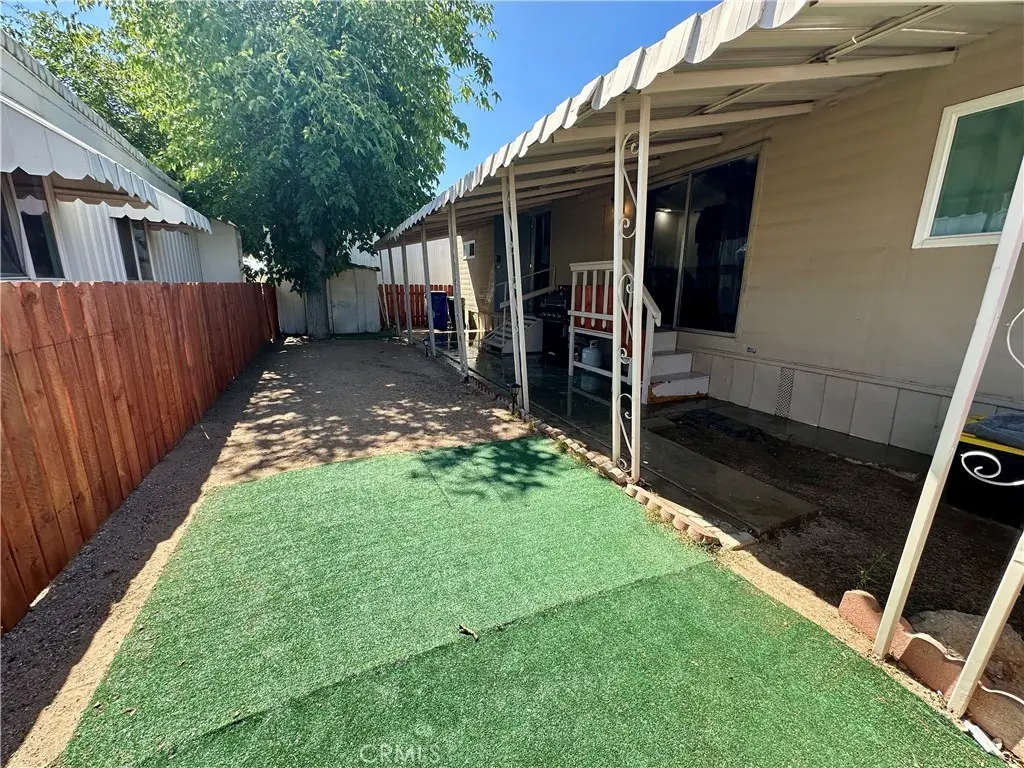
Welcome to this charming and affordable 1-bedroom, 1-bath manufactured home located in a well-kept Apple Valley community. This move-in-ready home offers a comfortable layout with an open living area, dining space, newer windows, modern recessed lights and a functional kitchen perfect for everyday living. The home features 500 sq ft of interior space, a cozy front porch, large shade providing tree, and totally fenced for your privacy. Recent updates and a well-maintained interior make this home an excellent option for first-time buyers, downsizers, or anyone seeking low-maintenance living. The community offers a peaceful environment with easy access to shopping, dining, schools, and major r
Key facts
- Functional kitchen
- Open living area
- Cozy front porch
Tags
Property features AI
Finance
- Other: Park name: Apple Valley Mobile Home Park
- HOA & community: Land lease: $700 monthly (park-managed); Community feature: Valley
Exterior
- Parking: Assigned parking; Located in Apple Valley Mobile Home Park; 2 pads available
- Utilities: Standard electric; Natural gas connected; Sewer connected (public sewer); Water connected (district/public)
- Home design: Mobile home model Pilgrim; Single-story; Entry level 1
- Construction: Mobile home 10 ft × 50 ft; Year built: see remarks
- Exterior features: Wood fencing; No pool; 0–1 Unit/Acre lot characteristic; Private, paved road frontage; Has a view
Interior
- Kitchen: Gas water heater (appliance)
- Flooring: Laminated flooring
- Bathrooms: 1 full bathroom with bathtub
- Heating & cooling: Heating: see remarks; Cooling: see remarks
- Interior features: One-level home; Entry facing Ottawa Rd
- Laundry & utility: No laundry hookups on site
Neighborhood map
What this means for you Summary
Snapshot
- This is a 1-bed/1.0-bath manufactured listed at $37k. Condition is rated good.
Deal economics
- At list price, monthly cash flow is $905 ($11k/yr) — positive.
- The deal already cash-flows at list — no discount required.
- Meets the 1% rule at list price ($1k rent vs $37k).
- Recommended offer: $36k (3.0% below list) — sets the bar for market timing.
- Cap rate 35.6% vs local median 3.5% in Apple Valley — top-decile yield for the area; either an underpriced asset or a hidden risk that comps aren't pricing in. Stress-test before assuming the spread holds.
Location & tenants
- Location reads 61/100 on livability (#532 in CA) — a middle-class / working-renter tenant base. Strengths: housing A+, commute B+; Watch: employment D+, schools F, crime D-.
- Apple Valley Unified (suburban): math 25% / reading 40% proficiency, ranked #955 of 1,400 in CA (top 68%) — families likely to look elsewhere, expect single-tenant / working-renter base with shorter leases; 60% free/reduced lunch — lower-income household profile, screen leases tightly.
- Market conditions: Rents rising fast (+4.3%/yr); 417 active listings in the ZIP; 5 comparable units currently listed for rent nearby; rentals leasing fast (median 11d on market — plan ~1-2 weeks tenant-placement turnaround); 5,458 units permitted in San Bernardino County in 2024 (1,500 in 5+ unit buildings).
Forward outlook
- Local home prices are declining (-3.0%/yr); year-one equity from $256 of loan paydown is wiped out by about $1k of value loss. Plan a longer hold.
- San Bernardino County population projected at +15% by 2050 — modest demand growth; plan on rents tracking national, not racing it.
- At projected returns (-3.0% appreciation + 4.3% rent growth), your $10k cash investment doubles in ~2 years — after that, you're playing with house money.
Negotiation context
- It's been on market 36 days — a 3% lower offer ($36k) is reasonable based on typical stale-listing flexibility.
Risks & watch-outs
- Climate carrying-cost: major wildfire risk; extreme-heat days projected 4→10/yr by 2055 (HVAC capex compounding) — expect insurance premiums to compound above CPI over the hold.
Questions for the listing agent
- It's been on market 36 days. Have you received any prior offers? Is the seller open to a 3% concession, seller financing, or rate buy-down credit?
- Built in 1962 — when were the roof, HVAC, electrical panel, plumbing, and water heater last replaced?
- Is there a deadline driving the sale (1031 exchange, divorce, estate, relocation)? That informs how much negotiation room exists.
- Schools are F-rated, which usually means shorter tenancies and higher turnover. Who's the typical renter profile here, and what's been the actual vacancy rate?
- Crime grade is D in this area — have there been break-ins, vandalism, or insurance claims at this property in the last 3 years? What carrier currently insures it and at what premium?
- What's the average days-on-market for RENTAL listings here right now (not sales)? A rising rental-DOM trend means longer vacancies and softer asking-rent achievability than the comps imply.
- What's the recent tenant-quality profile in this submarket — average credit score on applications, eviction rate, late-payment / NSF rate, and stable-employment percentage? A property-management company in the area should have these aggregated.
- How much new for-sale + rental construction is in the pipeline within 1–3 miles? Heavy new supply typically softens prices + rents 12–24 months out; constrained supply supports both.
Investment metrics
- 1% rule
- 3.97% ✓
- Cap rate
- 35.63%
- Cash-on-cash
- 104.79%
- DSCR
- 5.66
- GRM
- 2.1
CMA / ARV
- ARV (median comp)
- $16,852
- List price
- $37,000
- Delta
- 119.56%
- Verdict
- OVERPRICED
- Comps
- 2 within 1.0 mi
Projected returns pro-forma
-3.0% appreciation · 4.3% rent growth · sell at horizon
- IRR
- —
- Equity multiple
- 6.17×
- Total profit
- $53,592
- Equity at exit
- $5,517
- IRR
- —
- Equity multiple
- 13.47×
- Total profit
- $129,151
- Equity at exit
- $3,199
Cash invested: $10,360 (down + closing). Projections, not guarantees.
Landlord ↔ Tenant lean methodology
- Overall (STATE)
- 18 Strongly Tenant-Friendly
- State California
- 18 Strongly Tenant-Friendly · D+13
- County
- — inherits STATE
- City
- — inherits STATE
ZIP-level market 92308
- Home prices YoY
- -28.8%
- Rents YoY
- 4.3%
- Active inventory
- 417
- Price-to-rent
- 2.1×
Monthly cashflow live
- Estimated rent
- $1,469 high interval (Pro) →
- Mortgage (P&I)
- −$194
- Tax est. 1.5%
- −$46 /mo · $555/yr
- Insurance
- −$15
- HOA
- −$0
- Vacancy / Maint / Mgmt
- −$308
- Net cashflow
- $905
Break-even live
Sensitivity live
| Price | -10% $930 | -5% $917 | +0% $905 | +5% $892 | +10% $879 |
|---|---|---|---|---|---|
| Rent | -10% $789 | -5% $847 | +0% $905 | +5% $963 | +10% $1,021 |
| Rate | -1.0pp $923 | -0.5pp $914 | base $905 | +0.5pp $895 | +1.0pp $885 |
UW: 25.0% down · 7.5% · 30yr · 1.5% tax · 5.0% vac · 8.0% maint · 8.0% mgmt
Financing live
Cash to close
- Down payment
- $9,250
- Closing costs
- $1,110
- Reserves months
- —
- Total cash needed
- —
Loan-product check · same deal, 3 products live
Conventional
25% down · 7.5% · 30yr
- Down + closing
- —
- Monthly P&I
- —
- Monthly cashflow
- —
- DSCR
- —
- Eligible?
- —
Personal DTI + credit; lowest rate.
DSCR
20% down · 8.5% · 30yr
- Down + closing
- —
- Monthly P&I
- —
- Monthly cashflow
- —
- DSCR
- —
- Eligible?
- —
No personal income docs; deal must DSCR.
Hard money
10% down · 12.0% · 12mo
- Down + closing
- —
- Monthly P&I
- —
- Monthly cashflow
- —
- DSCR
- —
- Eligible?
- —
Short-term bridge; refi at stabilization.
Rent comps 5 comps
| Address | Beds | Baths | Sqft | Rent | $/sqft | DOM | Units | Dist |
|---|---|---|---|---|---|---|---|---|
| 13193 Navajo Rd Unit 3 Apple Valley, CA | 1.0 | 1.0 | 614 | $1,350 | $2.20 | 44d | 1 | 0.29mi |
| 14080 Mohawk Rd Apple Valley, CA | 2.0 | 2.0 | 748 | $1,849 | $2.47 | 6d | 1 | 1.05mi |
| 14080 Mohawk Rd Apple Valley, CA | 2.0 | 2.0 | 748 | $1,850 | $2.47 | 25d | 1 | 1.05mi |
| 22544 Sioux Rd Unit 21 Apple Valley, CA | 1.0 | 1.0 | 660 | $1,195 | $1.81 | 0d | 1 | 1.40mi |
| 22544 Sioux Rd Unit 21 Apple Valley, CA | 1.0 | 1.0 | 660 | $1,195 | $1.81 | 10d | 1 | 1.40mi |
Listing history 15 events
-
2026-06-18days on market $37,000 Active 36 DOM
-
2026-06-17days on market $37,000 Active 35 DOM
-
2026-06-16days on market $37,000 Active 34 DOM
-
2026-06-15days on market $37,000 Active 33 DOM
-
2026-06-13days on market $37,000 Active 31 DOM
-
2026-06-13days on market $37,000 Active 30 DOM
-
2026-06-09days on market $37,000 Active 27 DOM
-
2026-06-08days on market $37,000 Active 26 DOM
-
2026-06-07days on market $37,000 Active 25 DOM
-
2026-06-04days on market $37,000 Active 22 DOM
-
2026-06-03days on market $37,000 Active 21 DOM
-
2026-06-02days on market $37,000 Active 20 DOM
-
2026-06-01days on market $37,000 Active 19 DOM
-
2026-05-31days on market $37,000 Active 18 DOM
-
2026-05-13$37,000 Active 985-char remark
ⓘ Source: listings_history table (triggers on properties + properties_extension) + one-shot
backfill from property_details.listing_events for pre-trigger history.
Climate risk First Street
- Flood 1/10 Low FEMA zone D · 0% chance over 30 yrs
- Wildfire 6/10 Major
- Heat 7/10 Severe 4 d/yr ≥100°F today · 10 d/yr by 30 yrs out
- Wind 1/10 Low
- Air quality 10/10 Extreme 25 unhealthy d/yr today · 30 by 30 yrs out
Nearby sold comps map
Loading sold comps map…
Walkable amenities ~0.75 mi
Loading nearby amenities…
Taxation est. · year 1
- Rental income
- $17,626
- − Mortgage interest
- −$2,073
- − Property taxes
- −$555
- − Insurance
- −$185
- − Repairs & maintenance
- −$1,410
- − Management
- −$1,410
- − Depreciation
- −$1,076
- Taxable income
- $10,917
- Est. tax owed @ 24.0%
- −$2,620
- After-tax cash flow
- $8,236/yr
For passive investors: Depreciation is non-cash, so a rental often shows a tax loss while cash-flowing — sheltering income. Rental losses are passive: they offset passive income freely, and up to $25,000/yr can offset ordinary (W-2) income if you actively participate and your MAGI is under $100k (phasing out to $0 by $150k); unused losses carry forward. On sale, claimed depreciation is recaptured at up to 25%, and gains may owe capital-gains tax (a 1031 exchange can defer both). Figures are a year-1 estimate at your 24.0% rate — not tax advice; consult a CPA.
Condition & rehab AI · 5 photos
This move-in-ready manufactured home offers a comfortable layout with modern updates and a well-maintained interior, making it an excellent option for first-time buyers or downsizers seeking low-maintenance living.
Value-add opportunities
- Both Paint the exterior walls — Fresh paint can enhance curb appeal and increase both resale and rental value.
- Both Replace the front porch railings — Weathered railings can detract from the home's appeal and should be replaced for a more inviting appearance.
- Both Upgrade the HVAC system — A more efficient HVAC system can improve comfort and reduce energy costs, benefiting both resale and rental value.
Renovation cost estimate screening
Value-add ROI direction
- Both Paint the exterior walls — Fresh paint can enhance curb appeal and increase both resale and rental value. ↑
- Both Replace the front porch railings — Weathered railings can detract from the home's appeal and should be replaced for a more inviting appearance. ↑
- Both Upgrade the HVAC system — A more efficient HVAC system can improve comfort and reduce energy costs, benefiting both resale and rental value. ↑
ⓘ Cost ranges are severity-bucket heuristics (US national rule-of-thumb). Get contractor quotes + a written scope before underwriting a rehab budget.
Schools (NCES district)
- District
- Apple Valley Unified
- NCES district ID
- 0600017
- Math proficiency
- 25% ▬ 0.00%
- Reading proficiency
- 40% ▬ 0.00%
- Median HH income
- $49,264
- Composite
- 30.91/100
- National rank
- #11351
- State rank
- #955 of 1400 in CA
Livability — Apple Valley
- Score
- 61/100
- State rank
- #532
- US rank
- #17800
Category grades
Schools grade is shown separately in the Schools card above.
Census & demographics
- Census place
- Apple Valley, CA
- County
- San Bernardino County · 2,030,291 people
- City population
- 83,889
- Metro
- Riverside-San Bernardino-Ontario, CA
- Population (ZIP)
- 42,709
- Household income
- $66,568
- Rent vs Own
- Severe rent burden
- 1389.0
Population outlook (San Bernardino County) Hauer SSP2
- Today (2025)
- 2,300,329 people
- By 2030
- 2,378,907 · +3.4%
- By 2040
- 2,523,137 · +9.7%
- By 2050
- 2,642,388 · +14.9%
- By 2075
- 2,880,769 · +25.2%
- By 2100
- 2,909,436 · +26.5%
Race, ethnicity, and origin ACS 2023
- Neighborhood character
- Diverse neighborhood (Simpson 0.65)
- Race & ethnicity
- White 44% Hispanic / Latino 38% Two or more races 19% Black 9% Asian 3%
- Hispanic origin (detail)
- Mexican 34%
- Common ancestry
- Italian 1% Iranian 1% Slovak 1%
- Foreign-born
- 11% · Canada, South Korea
- Languages at home
- 75% English-only · Spanish 20% Tagalog/Filipino 1% Other Asian/Pacific 1%
Political lean MEDSL · San Bernardino
- 2024 margin
- Toss-up / Even · D 47.5% · R 49.7% · Other 2.8%
- 2008→2024 swing
- -8.5pp toward R · 2008: 6.3pp · 2024: -2.1pp
- All cycles
- 2024: R+2.1 2020: D+10.7 2016: D+9.8 2012: D+5.4 2008: D+6.3
Not yet ingested
- Civics
- —
Market trends
- HPI YoY
- ▼ -145.60%
- Current HPI
- 359.2305
- Rent YoY
- ▲ 4.30%
- Metro
- Riverside-San Bernardino-Ontario, CA
- State GDP YoY
- ▲ 3.21%
- F500 in state
- 116
Industry mix (Fortune 500 HQ in CA)
| Industry | F500 HQs | Revenue |
|---|---|---|
| Technology | 27 | $1,492B |
|
||
| Financial Services | 3 | $174B |
|
||
| Retail | 3 | $44B |
|
||
| Insurance | 3 | $26B |
|
||
| Media / Entertainment | 2 | $115B |
|
||
| Pharmaceuticals / Biotech | 2 | $62B |
|
||
Price history
1 event — show timeline
- 2026-05-13 Listed $37,000 CRMLS
Cash-flow waterfall
monthlySold comps — $/sqft
last 12 mo · ≤1 miLoading sold comps…