 🌊 Lakefront
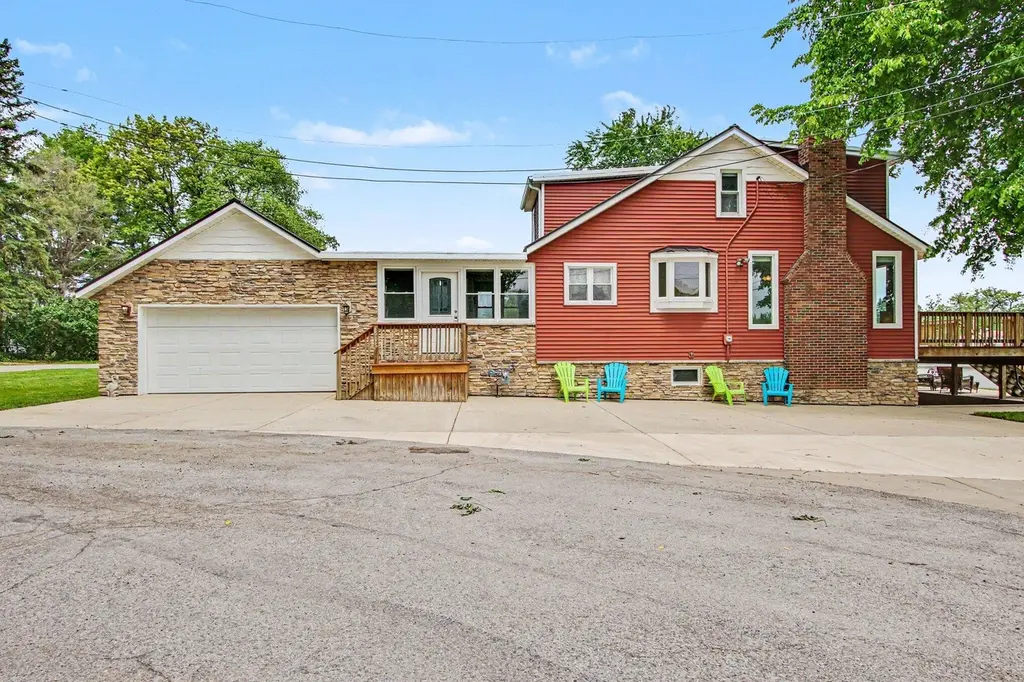
515 Lakeview Ct · Lake Dalecarlia, IN
Flood risk 1/10 · Minimal
- FEMA flood zone
- X (unshaded)
- Chance of flooding over 30 yrs
- 0.0%
- Est. flood insurance / yr
- $507 – $1,088
Fire risk 3/10 · Minor
- Est. fire insurance / yr
- $717 – $1,331
Heat risk 2/10 · Minimal
- Hot days now (above 101°F)
- 7 days/yr
- Hot days in 30 yrs
- 16 days/yr
Wind risk 2/10 · Minimal
- Chance of severe wind over 30 yrs
- 1.0%
Air-quality risk 2/10 · Minimal
- Unhealthy air days now
- 1 days/yr
- Unhealthy air days in 30 yrs
- 2 days/yr
Risk factors via First Street. Map © Google.
Why this score? — see what drove the D+ grade
The composite is a weighted blend of 9 inputs, each scored 0–100. Each bar is that input's sub-score; the figure is the points it added to the 100-point composite (weight × sub-score).
- Cash flow +15.0/30.0
- ARV discount +7.5/15.0
- 1% rule +5.0/10.0
- DSCR +5.0/10.0
- Schools +4.5/10.0
- Livability +3.5/5.0
- Rent growth +2.5/5.0
- Condition / age +2.5/5.0
- Appreciation +0.0/10.0
$1
🖨 Deal sheet 📄 Offer letter ✓ Due diligence
Listing remarks MLS
Spacious lakefront home offers 120'of frontage!Great location, great views, double lot!Large kitchen opens to comfortable liv rm w/ fireplace insert for supplemental heating. Great views from the liv rm, oversized newer vinyl window. 2 bedrooms on main lev along w/ 1/2 bath. Upstairs you will find a very large master bedr overlooking the lake & has double closets. The 2nd bedroom also is a great size & overlooks the lake. Both rooms have newer vinyl windows. The large landing area upstairs offers a nook which could be an office/computer area or play/TV area for the kids. Lower lev is a walkout to the backyard. Half is finished & half is unfinished for storage & furnace area. The removable boat lift & dock (5yrs old) will remain. The following are some of the updates:Roof replaced 97' (tear off), basement waterproofed 02'w/ new drain tile around entire perimeter w/ lifetime transferable warranty, furnace & air replaced in 97', water softener new in 2000 w/ reverse osmosis for kitchen, new tub surround in full bath 2005.
Key facts
- Fully remodeled
- Large wood deck
- Lake frontage
Tags
Property features AI
Finance
- Other: Property is vacant; Assessor-listed living area above grade
- HOA & community: Homeowners association with annual fee; Association amenities include a park and playground
Exterior
- Parking: Attached garage; 2-car garage; Driveway; Additional parking; Concrete surfaces; Garage door opener; Garage faces side
- Utilities: Public water; Public sewer; 100 amp electrical service
- Home design: Two-story home; Built in 1949
- Construction: Stone and vinyl siding; Metal roof; Basement with interior entry, walk-out access, unfinished storage space and sump pump
- Exterior features: Deck; Patio; Rain gutters; Bay windows; Lakefront with lake privileges; Lake and neighborhood views
Interior
- Kitchen: Stainless steel appliances; Gas range; Refrigerator; Microwave; Dishwasher; Pantry
- Bedrooms: Primary bedroom; Bedroom 2; Bedroom 3
- Bathrooms: 1 full bathroom; 1 three-quarter bathroom; 1 half bathroom
- Heating & cooling: Forced air heating (natural gas); Central air conditioning
- Interior features: Ceiling fans; Walk-in closets; Recessed lighting; Pantry; Eat-in kitchen; Entrance foyer; Double vanity
- Laundry & utility: Main level laundry room with sink; Washer and dryer included; Water softener (owned); Gas water heater
Neighborhood map
What this means for you Summary
Snapshot
- This is a 4-bed/1.5-bath single-family listed at $1.
Deal economics
- At list price, monthly cash flow is $1k ($18k/yr) — positive.
- The deal already cash-flows at list — no discount required.
- Meets the 1% rule at list price ($2k rent vs $1).
Location & tenants
- Location reads 70/100 on livability (#161 in IN) — a middle-class / working-renter tenant base. Strengths: crime A+, employment A+, housing A+; Watch: schools C-, amenities F, commute F.
- Tri-Creek School Corporation (town): math 46% / reading 56% proficiency, ranked #39 of 301 in IN (top 13%) — acceptable for families but not a draw, mixed tenant base, ~2y average lease.
- Market conditions: 350 active listings in the ZIP; 1,642 units permitted in Lake County in 2024 (14 in 5+ unit buildings).
Forward outlook
- Local home prices are declining (-3.0%/yr); year-one equity from $0 of loan paydown is wiped out by about $0 of value loss. Plan a longer hold.
- Lake County population projected to shrink 7% by 2050 — rents likely to lag national; underwrite the cash flow, not the appreciation.
- At projected returns (-3.0% appreciation + 3.0% rent growth), your $0 cash investment doubles in ~1 year — after that, you're playing with house money.
Negotiation context
- It's been on market 18 days — a 2% lower offer ($0) is reasonable based on typical stale-listing flexibility.
- 4 sale attempts since 27y ago with the ask held roughly flat each time — persistent listings suggest the price (not the market) is what's stuck; bring a comps-based counter.
Risks & watch-outs
- Watch-outs: built in 1949 — expect roof / HVAC / electrical / plumbing capex.
Questions for the listing agent
- Built in 1949 — when were the roof, HVAC, electrical panel, plumbing, and water heater last replaced?
- What does the HOA fee cover, when was the last increase, and are there any pending special assessments or reserve-fund shortfalls?
- Is there a deadline driving the sale (1031 exchange, divorce, estate, relocation)? That informs how much negotiation room exists.
- The area grade is low — what's the realistic commute time and amenity access for the typical tenant pool here? Any planned neighborhood developments (good or bad) we should know about?
- This sits on a lake — are riparian / water-frontage rights deeded with the parcel? Any dock permits, shoreline easements, or HOA water-use restrictions?
- What's the documented flood / surge / shoreline-erosion history here (FEMA AND non-FEMA — e.g., storm surge, creek backup, septic-field saturation)?
- Any water-quality or seasonal algae-bloom issues that affect tenant satisfaction or short-term-rental demand?
- What's the average days-on-market for RENTAL listings here right now (not sales)? A rising rental-DOM trend means longer vacancies and softer asking-rent achievability than the comps imply.
- What's the recent tenant-quality profile in this submarket — average credit score on applications, eviction rate, late-payment / NSF rate, and stable-employment percentage? A property-management company in the area should have these aggregated.
- How much new for-sale + rental construction is in the pipeline within 1–3 miles? Heavy new supply typically softens prices + rents 12–24 months out; constrained supply supports both.
Investment metrics
- 1% rule
- 187647.00% ✓
- Cap rate
- 1753691.56%
- Cash-on-cash
- 6263161.67%
- DSCR
- 278676.45
- GRM
- 0.0
CMA / ARV
- ARV (on-the-fly)
- $403,456
- Comps found
- 12
Show comp detail 12 sales within ~0.75 mi
| Address | Dist | Beds/Ba | Sqft | Sold | Price | $/sf | Match |
|---|---|---|---|---|---|---|---|
| 16005 Wheeler St | 0.40mi | 4/2.0 | 2,072 (+1%) | 7mo | $299,900 | $145 | 72 |
| 15952 Stevenson St | 0.51mi | 4/2.0 | 2,072 (+1%) | 2mo | $369,900 | $179 | 70 |
| 6714 W 159th Ln | 0.49mi | 4/2.0 | 2,072 (+1%) | 8mo | $339,900 | $164 | 66 |
| 6794 W 159th Ave | 0.56mi | 4/2.0 | 2,072 (+1%) | 6mo | $320,245 | $155 | 65 |
| 6764 W 159th Ln | 0.52mi | 4/2.0 | 2,192 (+7%) | 6mo | $319,900 | $146 | 57 |
| 15950 Hobart St | 0.57mi | 4/2.0 | 2,192 (+7%) | 6mo | $339,900 | $155 | 54 |
| 16003 Hobart St | 0.54mi | 4/2.5 | 1,882 (-8%) | 5mo | $370,230 | $197 | 53 |
| 6734 W 159th Ave | 0.50mi | 4/2.5 | 1,830 (-11%) | 7mo | $359,900 | $197 | 49 |
| 6784 W 159th Ave | 0.54mi | 4/2.5 | 1,822 (-11%) | 7mo | $379,900 | $209 | 47 |
| 16017 Hobart St | 0.54mi | 4/2.5 | 1,822 (-11%) | 7mo | $379,900 | $209 | 47 |
| 789 S Lakeview Dr | 0.52mi | 3/2.0 (-1) | 1,807 (-12%) | 5mo | $480,000 | $266 | 45 |
| 245 Island Dr | 0.51mi | 3/2.0 (-1) | 1,742 (-15%) | 6mo | $400,000 | $230 | 39 |
Match score weights: distance 35% · size 25% · config 20% · recency 20%. Top-matched comps best support the ARV.
Projected returns pro-forma
-3.0% appreciation · 3.0% rent growth · sell at horizon
- IRR
- —
- Equity multiple
- 332567.71×
- Total profit
- $93,119
- Equity at exit
- $0
- IRR
- —
- Equity multiple
- 718236.24×
- Total profit
- $201,106
- Equity at exit
- $0
Cash invested: $0 (down + closing). Projections, not guarantees.
Landlord ↔ Tenant lean methodology
- Overall (STATE)
- 90 Strongly Landlord-Friendly
- State Indiana
- 90 Strongly Landlord-Friendly · R+11
- County
- — inherits STATE
- City
- — inherits STATE
ZIP-level market 46356
- Home prices YoY
- -30.1%
- Active inventory
- 350
Monthly cashflow live
- Estimated rent
- $1,876 medium interval (Pro) →
- Mortgage (P&I)
- −$0
- Tax est. 1.5%
- −$0 /mo · $0/yr
- Insurance
- −$0
- HOA
- −$21
- Vacancy / Maint / Mgmt
- −$394
- Net cashflow
- $1,461
Break-even live
UW: 25.0% down · 7.5% · 30yr · 1.5% tax · 5.0% vac · 8.0% maint · 8.0% mgmt
Financing live
Cash to close
- Down payment
- $0
- Closing costs
- $0
- Reserves months
- —
- Total cash needed
- —
Loan-product check · same deal, 3 products live
Conventional
25% down · 7.5% · 30yr
- Down + closing
- —
- Monthly P&I
- —
- Monthly cashflow
- —
- DSCR
- —
- Eligible?
- —
Personal DTI + credit; lowest rate.
DSCR
20% down · 8.5% · 30yr
- Down + closing
- —
- Monthly P&I
- —
- Monthly cashflow
- —
- DSCR
- —
- Eligible?
- —
No personal income docs; deal must DSCR.
Hard money
10% down · 12.0% · 12mo
- Down + closing
- —
- Monthly P&I
- —
- Monthly cashflow
- —
- DSCR
- —
- Eligible?
- —
Short-term bridge; refi at stabilization.
HOA detail
- Monthly dues
- $21 · $252/yr
- Likely covers
- water
Listing history 13 events
-
2026-06-18days on market $1 Active 18 DOM
-
2026-06-17days on market $1 Active 17 DOM
-
2026-06-16days on market $1 Active 16 DOM
-
2026-06-15days on market $1 Active 15 DOM
-
2026-06-13days on market $1 Active 13 DOM
-
2026-06-09days on market $1 Active 9 DOM
-
2026-06-08days on market $1 Active 8 DOM
-
2026-06-07days on market $1 Active 7 DOM
-
2026-06-04days on market $1 Active 4 DOM
-
2026-06-03days on market $1 Active 3 DOM
-
2026-06-02days on market $1 Active 2 DOM
-
2026-05-31remarks 699-char remark
-
2026-05-31$1 Active 1 DOM
ⓘ Source: listings_history table (triggers on properties + properties_extension) + one-shot
backfill from property_details.listing_events for pre-trigger history.
Climate risk First Street
- Flood 1/10 Low FEMA zone X (unshaded) · 0% chance over 30 yrs
- Wildfire 3/10 Moderate
- Heat 2/10 Low 7 d/yr ≥101°F today · 16 d/yr by 30 yrs out
- Wind 2/10 Low 100% chance of damaging wind over 30 yrs
- Air quality 2/10 Low 1 unhealthy d/yr today · 2 by 30 yrs out
Nearby sold comps map
Loading sold comps map…
Walkable amenities ~0.75 mi
Loading nearby amenities…
Taxation est. · year 1
- Rental income
- $22,518
- − Mortgage interest
- −$0
- − Property taxes
- −$0
- − Insurance
- −$0
- − Repairs & maintenance
- −$1,801
- − Management
- −$1,801
- − HOA
- −$252
- − Depreciation
- −$0
- Taxable income
- $18,663
- Est. tax owed @ 24.0%
- −$4,479
- After-tax cash flow
- $13,058/yr
For passive investors: Depreciation is non-cash, so a rental often shows a tax loss while cash-flowing — sheltering income. Rental losses are passive: they offset passive income freely, and up to $25,000/yr can offset ordinary (W-2) income if you actively participate and your MAGI is under $100k (phasing out to $0 by $150k); unused losses carry forward. On sale, claimed depreciation is recaptured at up to 25%, and gains may owe capital-gains tax (a 1031 exchange can defer both). Figures are a year-1 estimate at your 24.0% rate — not tax advice; consult a CPA.
Schools (NCES district)
- District
- Tri-Creek School Corporation
- NCES district ID
- 1811460
- Math proficiency
- 46% ▼ -8.00%
- Reading proficiency
- 56% ▼ -5.00%
- Median HH income
- $64,614
- Composite
- 44.97/100
- National rank
- #2704
- State rank
- #39 of 301 in IN
Livability — Lake Dalecarlia
- Score
- 70/100
- State rank
- #161
- US rank
- #7821
Category grades
Schools grade is shown separately in the Schools card above.
Census & demographics
- Census place
- Lake Dalecarlia, IN
- Population (ZIP)
- 19,396
Population outlook (Lake County) Hauer SSP2
- Today (2025)
- 484,026 people
- By 2030
- 478,091 · -1.2%
- By 2040
- 462,974 · -4.3%
- By 2050
- 449,894 · -7.1%
- By 2075
- 436,169 · -9.9%
- By 2100
- 426,607 · -11.9%
Race, ethnicity, and origin ACS 2023
- Neighborhood character
- Predominantly White (88%)
- Race & ethnicity
- White 88% Hispanic / Latino 9% Two or more races 6%
- Hispanic origin (detail)
- Mexican 8%
- Common ancestry
- Romanian 16% Iranian 10% Lithuanian 2%
- Foreign-born
- 4% · Canada
- Languages at home
- 95% English-only · Spanish 4% Russian/Polish/Slavic 1%
Political lean MEDSL · Lake
- 2024 margin
- Lean D (+5.6) · D 52.1% · R 46.5% · Other 1.5%
- 2008→2024 swing
- -28.6pp toward R · 2008: 34.3pp · 2024: 5.6pp
- All cycles
- 2024: D+5.6 2020: D+15.1 2016: D+20.6 2012: D+31.0 2008: D+34.3
Not yet ingested
- Civics
- —
Market trends
- HPI YoY
- ▼ -110.73%
- Current HPI
- 256.6224
- Rent YoY
- —
- Metro
- —
- State GDP YoY
- ▲ 2.90%
- F500 in state
- 18
Industry mix (Fortune 500 HQ in IN)
| Industry | F500 HQs | Revenue |
|---|---|---|
| Industrial Machinery | 2 | $37B |
|
||
| Healthcare | 1 | $177B |
|
||
| Pharmaceuticals | 1 | $45B |
|
||
| Metals / Steel | 1 | $18B |
|
||
| Agriculture | 1 | $17B |
|
||
| Packaging | 1 | $12B |
|
||
Price history
+58.7% since first listed5 events — show timeline
- 2026-05-28 Listed $1 NIRA MLS as Distributed by MLS Grid
- 2006-06-12 Listed $237,900 NIRA MLS as Distributed by MLS Grid
- 1999-11-04 Listed $149,900 NIRA MLS as Distributed by MLS Grid
- 1999-10-25 Listing Removed — NIRA MLS as Distributed by MLS Grid
- 1999-05-25 Listed $149,900 NIRA MLS as Distributed by MLS Grid
Property tax history
+8.3%/yrLatest (2024): $3,736 · +0.4% YoY. Source: county tax records.
Cash-flow waterfall
monthlySold comps — $/sqft
last 12 mo · ≤1 miLoading sold comps…