5404 Earlann Dr · Louisville/Jefferson County metro government (balance), KY
Flood risk 1/10 · Minimal
- FEMA flood zone
- X (unshaded)
- Chance of flooding over 30 yrs
- 0.0%
- Est. flood insurance / yr
- $507 – $1,088
Fire risk 1/10 · Minimal
- Est. fire insurance / yr
- $839 – $1,559
Heat risk 5/10 · Moderate
- Hot days now (above 105°F)
- 7 days/yr
- Hot days in 30 yrs
- 18 days/yr
Wind risk 2/10 · Minimal
- Chance of severe wind over 30 yrs
- 2.0%
Air-quality risk 3/10 · Minor
- Unhealthy air days now
- 2 days/yr
- Unhealthy air days in 30 yrs
- 5 days/yr
Risk factors via First Street. Map © Google.
Why this score? — see what drove the B- grade
The composite is a weighted blend of 9 inputs, each scored 0–100. Each bar is that input's sub-score; the figure is the points it added to the 100-point composite (weight × sub-score).
- Cash flow +30.0/30.0
- 1% rule +10.0/10.0
- DSCR +10.0/10.0
- ARV discount +7.5/15.0
- Rent growth +3.2/5.0
- Livability +2.5/5.0
- Condition / age +2.5/5.0
- Schools +2.3/10.0
- Appreciation +0.0/10.0
$85,000
🖨 Deal sheet 📄 Offer letter ✓ Due diligence
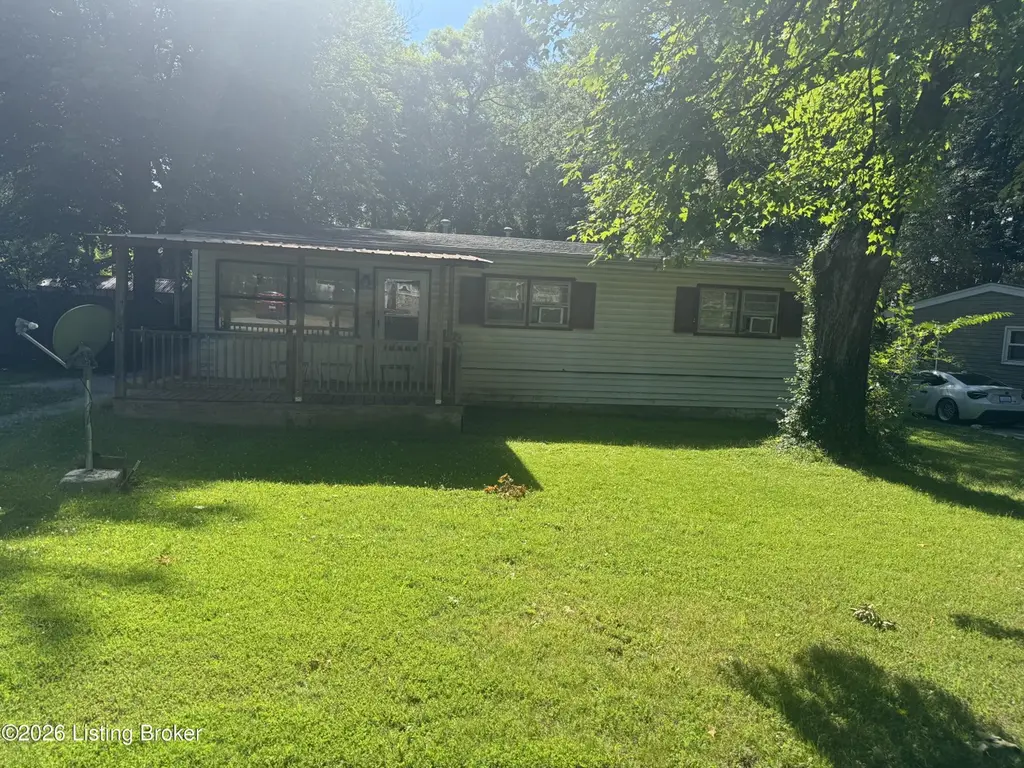
Listing remarks
Attention Investors!!! This one has a new roof & a new furnace! Great neighborhood for a flip or buy & hold for your portfolio with an ARV of 200k! 3/1 with a one car garage & a big yard! Hurry, won't last long! The home needs a complete rehab. Cash or Hard money only!
Key facts
- 9,135 sq ft lot
- Garage
- Built 1954
Property features AI
Finance
- Other: Subdivision: Meadow Hill
- HOA & community: No monthly maintenance or association fee
Exterior
- Parking: Detached garage with space for one vehicle
- Utilities: Electricity connected
- Home design: Single-family ranch-style home; One story
- Construction: Built in 1954; Vinyl siding construction; Shingle roof; Concrete block foundation
- Exterior features: Private and partial fencing; Cleared, level lot; Lot dimensions approximately 63 x 145
Interior
- Kitchen: Kitchen located on the first floor
- Bedrooms: Three bedrooms, all on the first floor
- Bathrooms: One full bathroom on the first floor
- Heating & cooling: Electric forced-air heating; Wall/window cooling unit(s)
- Interior features: Five total rooms; Four closets; No basement; Living room on the first floor; Laundry room on the first floor; First-floor primary bedroom
- Laundry & utility: First-floor laundry
Neighborhood map
What this means for you Summary
Snapshot
- This is a 3-bed/1.0-bath single-family listed at $85k.
Deal economics
- At list price, monthly cash flow is $540 ($6k/yr) — positive.
- The deal already cash-flows at list — no discount required.
- Meets the 1% rule at list price ($1k rent vs $85k).
- Cap rate 13.9% vs local median 4.0% in Louisville/Jefferson County metro government (balance) — top-decile yield for the area; either an underpriced asset or a hidden risk that comps aren't pricing in. Stress-test before assuming the spread holds.
Location & tenants
- Location reads: area grade B — affects rentability + tenant quality, not the cash-flow math above.
- Jefferson County (urban): math 19% / reading 35% proficiency, ranked #121 of 165 in KY (top 73%) — low school quality limits family demand, transient renter base, plan for 1-2y turnover.
- Market conditions: Rents rising (+2.6%/yr); 103 active listings in the ZIP; 7 comparable units currently listed for rent nearby; rentals leasing fast (median 3d on market — plan ~1-2 weeks tenant-placement turnaround); 2,836 units permitted in Jefferson County in 2024 (1,558 in 5+ unit buildings).
- This rent runs 30% of the median local income ($56k/yr) — at the standard rent-burdened threshold; future hikes will face affordability resistance.
Forward outlook
- Local home prices are declining (-3.0%/yr); year-one equity from $588 of loan paydown is wiped out by about $3k of value loss. Plan a longer hold.
- Jefferson County population projected at +13% by 2050 — modest demand growth; plan on rents tracking national, not racing it.
- At projected returns (-3.0% appreciation + 2.6% rent growth), your $24k cash investment doubles in ~5 years — after that, you're playing with house money.
Negotiation context
- Only 5 days on market — expect competitive offers; lowballing is unlikely to land.
Risks & watch-outs
- Watch-outs: built in 1954 — expect roof / HVAC / electrical / plumbing capex.
- Climate carrying-cost: extreme-heat days projected 7→18/yr by 2055 (HVAC capex compounding) — expect insurance premiums to compound above CPI over the hold.
Questions for the listing agent
- Built in 1954 — when were the roof, HVAC, electrical panel, plumbing, and water heater last replaced?
- Is there a deadline driving the sale (1031 exchange, divorce, estate, relocation)? That informs how much negotiation room exists.
- What's the average days-on-market for RENTAL listings here right now (not sales)? A rising rental-DOM trend means longer vacancies and softer asking-rent achievability than the comps imply.
- What's the recent tenant-quality profile in this submarket — average credit score on applications, eviction rate, late-payment / NSF rate, and stable-employment percentage? A property-management company in the area should have these aggregated.
- How much new for-sale + rental construction is in the pipeline within 1–3 miles? Heavy new supply typically softens prices + rents 12–24 months out; constrained supply supports both.
Investment metrics
- 1% rule
- 1.65% ✓
- Cap rate
- 13.91%
- Cash-on-cash
- 27.21%
- DSCR
- 2.21
- GRM
- 5.0
CMA / ARV
- ARV (on-the-fly)
- $187,200
- Comps found
- 12
Show comp detail 12 sales within ~0.75 mi
| Address | Dist | Beds/Ba | Sqft | Sold | Price | $/sf | Match |
|---|---|---|---|---|---|---|---|
| 1115 Lone Oak Ave | 0.39mi | 3/1.0 | 947 (-1%) | 2mo | $215,000 | $227 | 78 |
| 1109 Ireland Dr | 0.07mi | 2/1.0 (-1) | 994 (+4%) | 13mo | $161,600 | $163 | 75 |
| 5417 Sunset Dr | 0.23mi | 3/2.0 | 1,025 (+7%) | 8mo | $220,000 | $215 | 67 |
| 1104 Lone Oak Ave | 0.43mi | 3/1.0 | 1,025 (+7%) | 4mo | $215,000 | $210 | 66 |
| 1118 Minor Ln | 0.12mi | 2/1.0 (-1) | 1,062 (+11%) | 13mo | $200,000 | $188 | 61 |
| 7112 Deanna Dr | 0.40mi | 3/1.0 | 1,050 (+9%) | 7mo | $215,000 | $205 | 60 |
| 5402 Sunset Dr | 0.27mi | 3/1.0 | 1,025 (+7%) | 20mo | $210,000 | $205 | 59 |
| 1115 Clay Ave | 0.11mi | 3/1.0 | 1,100 (+15%) | 15mo | $215,000 | $195 | 58 |
| 1030 Reeves Rd Rd | 0.43mi | 3/1.0 | 1,085 (+13%) | 4mo | $200,000 | $184 | 56 |
| 1011 Reeves Rd | 0.45mi | 3/1.0 | 1,100 (+15%) | 4mo | $215,000 | $195 | 51 |
| 1229 Bates Ave | 0.61mi | 3/1.0 | 1,075 (+12%) | 9mo | $169,900 | $158 | 44 |
| 1156 Markwell Ln | 0.43mi | 3/1.5 | 825 (-14%) | 18mo | $112,000 | $136 | 39 |
Match score weights: distance 35% · size 25% · config 20% · recency 20%. Top-matched comps best support the ARV.
Projected returns pro-forma
-3.0% appreciation · 2.61% rent growth · sell at horizon
- IRR
- 20.8%
- Equity multiple
- 1.84×
- Total profit
- $20,061
- Equity at exit
- $12,674
- IRR
- 28.7%
- Equity multiple
- 3.50×
- Total profit
- $59,536
- Equity at exit
- $7,349
Cash invested: $23,800 (down + closing). Projections, not guarantees.
Landlord ↔ Tenant lean methodology
- Overall (STATE)
- 83 Strongly Landlord-Friendly
- State Kentucky
- 83 Strongly Landlord-Friendly · R+16
- County
- — inherits STATE
- City
- — inherits STATE
ZIP-level market 40219
- Rents YoY
- 2.6%
- Active inventory
- 103
- Price-to-rent
- 5.0×
Monthly cashflow live
- Estimated rent
- $1,405 high interval (Pro) →
- Mortgage (P&I)
- −$446
- Tax from tax record
- −$89 /mo · $1,068/yr
- Insurance
- −$35
- HOA
- −$0
- Vacancy / Maint / Mgmt
- −$295
- Net cashflow
- $540
Break-even live
UW: 25.0% down · 7.5% · 30yr · 1.5% tax · 5.0% vac · 8.0% maint · 8.0% mgmt
Financing live
Cash to close
- Down payment
- $21,250
- Closing costs
- $2,550
- Reserves months
- —
- Total cash needed
- —
Loan-product check · same deal, 3 products live
Conventional
25% down · 7.5% · 30yr
- Down + closing
- —
- Monthly P&I
- —
- Monthly cashflow
- —
- DSCR
- —
- Eligible?
- —
Personal DTI + credit; lowest rate.
DSCR
20% down · 8.5% · 30yr
- Down + closing
- —
- Monthly P&I
- —
- Monthly cashflow
- —
- DSCR
- —
- Eligible?
- —
No personal income docs; deal must DSCR.
Hard money
10% down · 12.0% · 12mo
- Down + closing
- —
- Monthly P&I
- —
- Monthly cashflow
- —
- DSCR
- —
- Eligible?
- —
Short-term bridge; refi at stabilization.
Rent comps 7 comps
| Address | Beds | Baths | Sqft | Rent | $/sqft | DOM | Units | Dist |
|---|---|---|---|---|---|---|---|---|
| 3700 Chateau Ln Louisville, KY | 2.0 | 1.0 | 850 | $1,100 | $1.29 | 23d | 1 | 0.32mi |
| 150 Markwell Ct Louisville, KY | 1.0–2.0 | 1.0 | 720 | $1,275 | $1.77 | 3d | 10 | 0.34mi |
| 7510 Dunwoody Ct Louisville, KY | 1.0–2.0 | 1.0 | 750 | $1,150 | $1.53 | 23d | 1 | 0.43mi |
| 7500 Beechview Way Louisville, KY | 1.0–2.0 | 1.0 | 743 | $1,122 | $1.51 | 3d | 15 | 0.89mi |
| 4203 Foreman Ln Louisville, KY | 2.0 | 1.0 | 865 | $974 | $1.13 | 3d | 6 | 1.17mi |
| 7301 Monsey Cir Louisville, KY | 1.0–3.0 | 1.0–2.0 | 1245 | $2,048 | $1.64 | 1d | 30 | 1.28mi |
| 3511 Bonaventure Blvd Louisville, KY | 2.0 | 1.0 | 907 | $1,112 | $1.23 | 1d | 7 | 1.41mi |
Listing history 6 events
-
2026-06-18days on market $85,000 Active 5 DOM
-
2026-06-17days on market $85,000 Active 4 DOM
-
2026-06-16days on market $85,000 Active 3 DOM
-
2026-06-15days on market $85,000 Active 2 DOM
-
2026-06-13remarks 275-char remark
-
2026-06-13$85,000 Active 1 DOM
ⓘ Source: listings_history table (triggers on properties + properties_extension) + one-shot
backfill from property_details.listing_events for pre-trigger history.
Tax reassessment forecast KY · Resets to sale price
- Current annual tax
- $1,068 · $89/mo
- Projected year-2 tax
- $1,068 · $89/mo
- Expected delta
- $0/yr ($0/mo · 0.0%)
ⓘ Screening estimate from a state-policy table — verify with the county assessor before closing.
Climate risk First Street
- Flood 1/10 Low FEMA zone X (unshaded) · 0% chance over 30 yrs
- Wildfire 1/10 Low
- Heat 5/10 Major 7 d/yr ≥105°F today · 18 d/yr by 30 yrs out
- Wind 2/10 Low 2% chance of damaging wind over 30 yrs
- Air quality 3/10 Moderate 2 unhealthy d/yr today · 5 by 30 yrs out
Nearby sold comps map
Loading sold comps map…
Walkable amenities ~0.75 mi
Loading nearby amenities…
Taxation est. · year 1
- Rental income
- $16,858
- − Mortgage interest
- −$4,761
- − Property taxes
- −$1,068
- − Insurance
- −$425
- − Repairs & maintenance
- −$1,349
- − Management
- −$1,349
- − Depreciation
- −$2,473
- Taxable income
- $5,434
- Est. tax owed @ 24.0%
- −$1,304
- After-tax cash flow
- $5,172/yr
For passive investors: Depreciation is non-cash, so a rental often shows a tax loss while cash-flowing — sheltering income. Rental losses are passive: they offset passive income freely, and up to $25,000/yr can offset ordinary (W-2) income if you actively participate and your MAGI is under $100k (phasing out to $0 by $150k); unused losses carry forward. On sale, claimed depreciation is recaptured at up to 25%, and gains may owe capital-gains tax (a 1031 exchange can defer both). Figures are a year-1 estimate at your 24.0% rate — not tax advice; consult a CPA.
Schools (NCES district)
- District
- Jefferson County
- NCES district ID
- 2102990
- Math proficiency
- 19% ▼ -17.00%
- Reading proficiency
- 35% ▼ -11.00%
- Median HH income
- $47,885
- Composite
- 23.45/100
- National rank
- #7884
- State rank
- #121 of 165 in KY
Livability — Louisville/Jefferson County metro government (balance)
No livability data for this city. (Only ~50 U.S. cities are tracked.)
Census & demographics
- Census place
- Louisville/Jefferson County metro government (balance), KY
- County
- Jefferson County · 790,184 people
- City population
- 419,741
- Metro
- Louisville/Jefferson County, KY-IN
- Population (ZIP)
- 39,909
- Household income
- $55,720
- Rent vs Own
- Severe rent burden
- 1533.0
Population outlook (Jefferson County) Hauer SSP2
- Today (2025)
- 823,112 people
- By 2030
- 849,343 · +3.2%
- By 2040
- 895,696 · +8.8%
- By 2050
- 933,630 · +13.4%
- By 2075
- 1,028,262 · +24.9%
- By 2100
- 1,072,675 · +30.3%
Race, ethnicity, and origin ACS 2023
- Neighborhood character
- Diverse neighborhood (Simpson 0.67)
- Race & ethnicity
- White 44% Black 26% Hispanic / Latino 25% Two or more races 16% Asian 1%
- Hispanic origin (detail)
- Mexican 8% Cuban 14%
- Common ancestry
- Lithuanian 1% Italian 1% Slovak 1%
- Foreign-born
- 21% · Canada
- Languages at home
- 70% English-only · Spanish 22% French/Haitian/Cajun 3% Arabic 2%
Political lean MEDSL · Jefferson
- 2024 margin
- D (+16.6) · D 57.4% · R 40.9% · Other 1.7%
- 2008→2024 swing
- +4.5pp toward D · 2008: 12.0pp · 2024: 16.6pp
- All cycles
- 2024: D+16.6 2020: D+20.1 2016: D+13.3 2012: D+11.1 2008: D+12.0
Not yet ingested
- Civics
- —
Market trends
- HPI YoY
- ▼ -278.92%
- Current HPI
- 264.3235
- Rent YoY
- ▲ 2.61%
- Metro
- Louisville/Jefferson County, KY-IN
- State GDP YoY
- ▲ 1.81%
- F500 in state
- 4
Industry mix (Fortune 500 HQ in KY)
| Industry | F500 HQs | Revenue |
|---|---|---|
| Healthcare | 1 | $118B |
|
||
| Food / Beverage | 1 | $7B |
|
||
Price history
+1.2% since first listed2 events — show timeline
- 2026-06-13 Listed $85,000 Metro Search MLS
- 2007-03-26 Sold (Public Records) $84,000 Public Records
Property tax history
+7.7%/yrLatest (2025): $1,068 · +84.6% YoY. Source: county tax records.
Cash-flow waterfall
monthlySold comps — $/sqft
last 12 mo · ≤1 miLoading sold comps…