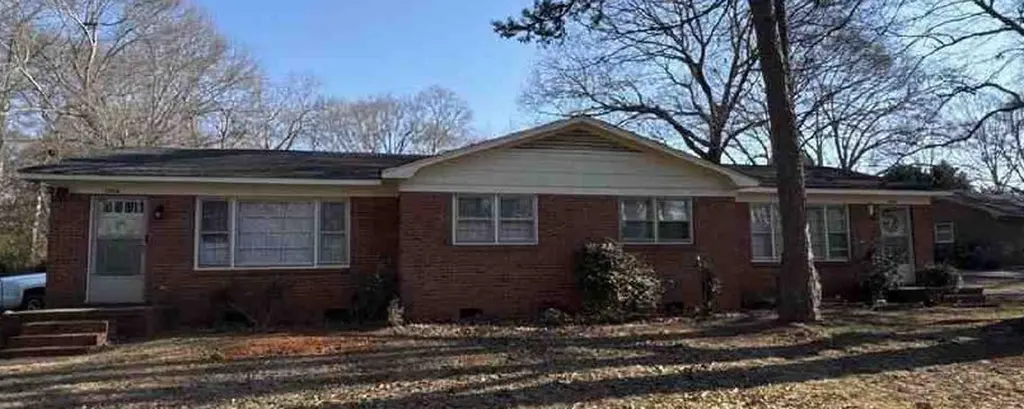
 Duplex
2052 Pineview Dr Unit *** · Spartanburg, SC
Flood risk 1/10 · Minimal
- FEMA flood zone
- X (unshaded)
- Chance of flooding over 30 yrs
- 0.0%
- Est. flood insurance / yr
- $507 – $1,088
Fire risk 4/10 · Minor
- Est. fire insurance / yr
- $783 – $1,453
Heat risk 5/10 · Moderate
- Hot days now (above 105°F)
- 7 days/yr
- Hot days in 30 yrs
- 16 days/yr
Wind risk 2/10 · Minimal
- Chance of severe wind over 30 yrs
- 2.0%
Air-quality risk 4/10 · Minor
- Unhealthy air days now
- 4 days/yr
- Unhealthy air days in 30 yrs
- 4 days/yr
Risk factors via First Street. Map © Google.
Why this score? — see what drove the D grade
The composite is a weighted blend of 9 inputs, each scored 0–100. Each bar is that input's sub-score; the figure is the points it added to the 100-point composite (weight × sub-score).
- Cash flow +15.3/30.0
- ARV discount +7.5/15.0
- DSCR +4.7/10.0
- 1% rule +4.2/10.0
- Livability +3.8/5.0
- Schools +3.1/10.0
- Rent growth +2.7/5.0
- Condition / age +2.2/5.0
- Appreciation +0.0/10.0
$245,000
🖨 Deal sheet (PDF) 📄 Offer letter ✓ Due diligence
Multi-family units
County records classify this as Multi-Family (2-4 Unit). Listing-text estimate: 2 units. confirmed
Listing remarks
Investor Opportunity – Turnkey Duplex! Welcome to 2052-2054 Pineview Drive in Spartanburg— a well-maintained duplex. Each unit features 2 bedrooms and 1 full bathroom with approximately 972 square feet per side, providing comfortable and functional living space for tenants. Unit’s features include: central heat and air, dishwasher, range, refrigerator, storage, washer & dryer connections. Whether you're looking to expand your rental portfolio or step into your first investment property, this duplex offers strong income potential in a high-demand Spartanburg Eastside rental area. Don’t miss your chance to own a great multi-family property in Spartanburg conveni
Key facts
- Storage
- Turnkey duplex
- Central heat and air
Tags
Property features AI
Finance
- Other: Property listed as residential income (duplex)
Exterior
- Utilities: Public water; Septic tank sewer
- Home design: Duplex residential income property; One level
- Construction: Brick veneer construction; Composition roof
- Exterior features: Composition roof; Brick veneer construction; Lot approximately 1.18 acres; Lot dimensions: 220 x 120 x 73 x 130 x 140 x 120 x 11; Zoned for the city
Interior
- Interior features: Electric water heater; Central air conditioning (electric); Forced air heating
Neighborhood map
What this means for you Summary
Snapshot
- This is a 2 × 2-bed/1-bath units multifamily listed at $245k. Condition is rated fair.
Deal economics
- At list price, monthly cash flow is $88 ($1k/yr) — positive. Per door: $44/mo.
- The deal already cash-flows at list — no discount required.
- To meet the 1% rule (rent ≥ 1% of price), the offer needs to be $226k (8.0% below list).
- Recommended offer: $226k (8.0% below list) — sets the bar for 1% rule.
- Cap rate 6.7% vs local median 3.9% in Spartanburg — top-decile yield for the area; either an underpriced asset or a hidden risk that comps aren't pricing in. Stress-test before assuming the spread holds.
Location & tenants
- Location reads 76/100 on livability (#24 in SC, #3,679 nationally) — a middle-class / working-renter tenant base. Strengths: amenities A+, commute A+, cost of living A+; Watch: crime F, employment F.
- Spartanburg 07 (urban): math 34% / reading 41% proficiency, ranked #39 of 80 in SC (top 49%) — families likely to look elsewhere, expect single-tenant / working-renter base with shorter leases; 62% free/reduced lunch — lower-income household profile, screen leases tightly.
- Zoned schools: Jesse Boyd Elementary (math 52% / reading 57%, grade C, #123 of 597 statewide, top 22%, 495 students, 57% FRL); Mccracken Middle (math 41% / reading 49%, grade D, #48 of 229 statewide, top 22%, 926 students, 78% FRL); Spartanburg High (math 67% / reading 79%, grade B+, #44 of 196 statewide, top 23%, 2,056 students, 85% FRL).
- Zoned-school proficiency averages 58% at this address vs 38% district-wide (+20 pts) — the actual schools serving this property are materially stronger than the Spartanburg 07 average implies; a family-tenant draw the district grade alone would hide.
- Market conditions: Rents flat; 276 active listings in the ZIP; 2 comparable units currently listed for rent nearby; 3,129 units permitted in Spartanburg County in 2024 (40 in 5+ unit buildings).
- This rent runs 41% of the median local income ($66k/yr) — at the standard rent-burdened threshold; future hikes will face affordability resistance.
Forward outlook
- Local home prices are declining (-3.0%/yr); year-one equity from $2k of loan paydown is wiped out by about $7k of value loss. Plan a longer hold.
- Spartanburg County population projected at +18% by 2050 — long-run rental-demand tailwind backs the buy-and-hold thesis.
Negotiation context
- It's been on market 25 days — a 2% lower offer ($241k) is reasonable based on typical stale-listing flexibility.
Risks & watch-outs
- Climate carrying-cost: extreme-heat days projected 7→16/yr by 2055 (HVAC capex compounding) — expect insurance premiums to compound above CPI over the hold.
Questions for the listing agent
- Can we see the unit-by-unit rent roll, current vacancy, and any below-market leases? What's the average tenancy length?
- What capital expenditures (roof, boiler, parking lot, exteriors) have been made in the last 5 years, and what's planned in the next 2?
- Have any recent inspections been done? Can we get a copy of the seller's disclosures and any deferred-maintenance estimates?
- Built in 1974 — when were the roof, HVAC, electrical panel, plumbing, and water heater last replaced?
- Is there a deadline driving the sale (1031 exchange, divorce, estate, relocation)? That informs how much negotiation room exists.
- Schools are D-rated, which usually means shorter tenancies and higher turnover. Who's the typical renter profile here, and what's been the actual vacancy rate?
- Crime grade is F in this area — have there been break-ins, vandalism, or insurance claims at this property in the last 3 years? What carrier currently insures it and at what premium?
- The area grade is low — what's the realistic commute time and amenity access for the typical tenant pool here? Any planned neighborhood developments (good or bad) we should know about?
- What's the average days-on-market for RENTAL listings here right now (not sales)? A rising rental-DOM trend means longer vacancies and softer asking-rent achievability than the comps imply.
- What's the recent tenant-quality profile in this submarket — average credit score on applications, eviction rate, late-payment / NSF rate, and stable-employment percentage? A property-management company in the area should have these aggregated.
- How much new apartment / multifamily construction is in the pipeline within 1–3 miles? Heavy new supply (>2% of stock underway) typically softens rents 12–24 months out; light construction supports rent growth.
Investment metrics
- 1% rule
- 0.92% ✗
- Cap rate
- 6.73%
- Cash-on-cash
- 1.54%
- DSCR
- 1.07
- GRM
- 9.1
CMA / ARV
No comps found within radius.
Projected returns pro-forma
-3.0% appreciation · 0.64% rent growth · sell at horizon
- IRR
- -16.5%
- Equity multiple
- 0.43×
- Total profit
- $-39,274
- Equity at exit
- $36,530
- IRR
- -13.2%
- Equity multiple
- 0.31×
- Total profit
- $-47,293
- Equity at exit
- $21,183
Cash invested: $68,600 (down + closing). Projections, not guarantees.
Landlord ↔ Tenant lean methodology
- Overall (STATE)
- 90 Strongly Landlord-Friendly
- State South Carolina
- 90 Strongly Landlord-Friendly · R+6
- County
- — inherits STATE
- City
- — inherits STATE
ZIP-level market 29307
- Home prices YoY
- -17.7%
- Rents YoY
- 0.6%
- Active inventory
- 276
- Price-to-rent
- 18.1×
Monthly cashflow live
- Estimated rent
- $2,255 medium interval (Pro) →
- Mortgage (P&I)
- −$1,285
- Tax est. 1.5%
- −$306 /mo · $3,675/yr
- Insurance
- −$102
- HOA
- −$0
- Vacancy / Maint / Mgmt
- −$474
- Net cashflow
- $88
Break-even live
Sensitivity live
| Price | -10% $258 | -5% $173 | +0% $88 | +5% $4 | +10% $-81 |
|---|---|---|---|---|---|
| Rent | -10% $-90 | -5% $-1 | +0% $88 | +5% $177 | +10% $266 |
| Rate | -1.0pp $212 | -0.5pp $151 | base $88 | +0.5pp $25 | +1.0pp $-40 |
2-unit breakdown (identical units grouped — click to expand)
| Units | Beds | Baths | Est. rent |
|---|---|---|---|
| 2× units | 2 | 1 | $2,254 |
| #1 | 2 | 1 | $1,127 |
| #2 | 2 | 1 | $1,127 |
| Total (2 units) | $2,255 | ||
UW: 25.0% down · 7.5% · 30yr · 1.5% tax · 5.0% vac · 8.0% maint · 8.0% mgmt
Financing live
Cash to close
- Down payment
- $61,250
- Closing costs
- $7,350
- Reserves months
- —
- Total cash needed
- —
Loan-product check · same deal, 3 products live
Conventional
25% down · 7.5% · 30yr
- Down + closing
- —
- Monthly P&I
- —
- Monthly cashflow
- —
- DSCR
- —
- Eligible?
- —
Personal DTI + credit; lowest rate.
DSCR
20% down · 8.5% · 30yr
- Down + closing
- —
- Monthly P&I
- —
- Monthly cashflow
- —
- DSCR
- —
- Eligible?
- —
No personal income docs; deal must DSCR.
Hard money
10% down · 12.0% · 12mo
- Down + closing
- —
- Monthly P&I
- —
- Monthly cashflow
- —
- DSCR
- —
- Eligible?
- —
Short-term bridge; refi at stabilization.
Rent comps 2 comps
| Address | Beds | Baths | Sqft | Rent | $/sqft | DOM | Units | Dist |
|---|---|---|---|---|---|---|---|---|
| 231 Broadway St Glendale, SC | 3.0 | 2.0 | 1799 | $2,200 | $1.22 | 15d | 1 | 0.74mi |
| 1631 Fernwood Glendale Rd Spartanburg, SC | 2.0–3.0 | 1.5 | 1100 | $1,045 | $0.95 | 15d | 1 | 1.45mi |
Listing history 17 events
-
2026-06-21days on market $245,000 Active 25 DOM
-
2026-06-18days on market $245,000 Active 22 DOM
-
2026-06-17days on market $245,000 Active 21 DOM
-
2026-06-16days on market $245,000 Active 20 DOM
-
2026-06-15days on market $245,000 Active 19 DOM
-
2026-06-14days on market $245,000 Active 17 DOM
-
2026-06-13days on market $245,000 Active 16 DOM
-
2026-06-10days on market $245,000 Active 14 DOM
-
2026-06-09days on market $245,000 Active 13 DOM
-
2026-06-08days on market $245,000 Active 12 DOM
-
2026-06-07days on market $245,000 Active 11 DOM
-
2026-06-02days on market $245,000 Active 6 DOM
-
2026-06-01days on market $245,000 Active 5 DOM
-
2026-05-31days on market $245,000 Active 4 DOM
-
2026-05-30days on market $245,000 Active 3 DOM
-
2026-05-27price $245,000
-
2026-05-27$260,000 Active
ⓘ Source: listings_history table (triggers on properties + properties_extension) + one-shot
backfill from property_details.listing_events for pre-trigger history.
Climate risk First Street
- Flood 1/10 Low FEMA zone X (unshaded) · 0% chance over 30 yrs
- Wildfire 4/10 Moderate
- Heat 5/10 Major 7 d/yr ≥105°F today · 16 d/yr by 30 yrs out
- Wind 2/10 Low 2% chance of damaging wind over 30 yrs
- Air quality 4/10 Moderate 4 unhealthy d/yr today · 4 by 30 yrs out
Nearby sold comps map
Loading sold comps map…
Walkable amenities ~0.75 mi
Loading nearby amenities…
Taxation est. · year 1
- Rental income
- $27,060
- − Mortgage interest
- −$13,724
- − Property taxes
- −$3,675
- − Insurance
- −$1,225
- − Repairs & maintenance
- −$2,165
- − Management
- −$2,165
- − Depreciation
- −$7,127
- Taxable loss
- −$3,021
- Est. tax savings @ 24.0%
- +$725
- After-tax cash flow
- $1,785/yr
For passive investors: Depreciation is non-cash, so a rental often shows a tax loss while cash-flowing — sheltering income. Rental losses are passive: they offset passive income freely, and up to $25,000/yr can offset ordinary (W-2) income if you actively participate and your MAGI is under $100k (phasing out to $0 by $150k); unused losses carry forward. On sale, claimed depreciation is recaptured at up to 25%, and gains may owe capital-gains tax (a 1031 exchange can defer both). Figures are a year-1 estimate at your 24.0% rate — not tax advice; consult a CPA.
Condition & rehab AI · 12 photos
This two-unit duplex requires moderate renovations to improve its condition and appeal. Repairs and updates to the exterior, interior walls, bathrooms, and kitchen are necessary to increase its resale and rental value.
Repairs flagged
- Moderate roof — Visible discoloration and potential minor damage.
- Moderate exterior — Brick exterior shows weathering and minor cracks.
- Moderate interior walls/paint — Paint appears faded and chipped in some areas.
- Moderate bathrooms — Basic fixtures and dated appearance.
- Moderate kitchen — Dated cabinetry and appliances with wear on countertops and backsplash.
Value-add opportunities
- Both Paint interior walls — Fresh paint can improve the overall appearance and value of the property.
- Both Replace worn flooring — New flooring can enhance the living area and increase the property's appeal.
- Both Update dated kitchen cabinetry and appliances — Fresh cabinetry and modern appliances can significantly boost the property's resale and rental value.
- Both Replace dated bathroom fixtures and tiles — Modern fixtures and updated tiles can greatly improve the bathrooms and add value to the property.
Renovation cost estimate screening
| Repair item | Severity | Est. cost |
|---|---|---|
| roof · Visible discoloration and potential minor damage. | Moderate | $3,000–15,000 |
| exterior · Brick exterior shows weathering and minor cracks. | Moderate | $3,000–15,000 |
| interior walls/paint · Paint appears faded and chipped in some areas. | Moderate | $3,000–15,000 |
| bathrooms · Basic fixtures and dated appearance. | Moderate | $3,000–15,000 |
| kitchen · Dated cabinetry and appliances with wear on countertops and backsplash. | Moderate | $3,000–15,000 |
| Total estimated repair cost · 5 items | $15,000–75,000 |
Value-add ROI direction
- Both Paint interior walls — Fresh paint can improve the overall appearance and value of the property. ↑
- Both Replace worn flooring — New flooring can enhance the living area and increase the property's appeal. ↑
- Both Update dated kitchen cabinetry and appliances — Fresh cabinetry and modern appliances can significantly boost the property's resale and rental value. ↑
- Both Replace dated bathroom fixtures and tiles — Modern fixtures and updated tiles can greatly improve the bathrooms and add value to the property. ↑
ⓘ Cost ranges are severity-bucket heuristics (US national rule-of-thumb). Get contractor quotes + a written scope before underwriting a rehab budget.
Schools (NCES district)
- District
- Spartanburg 07
- NCES district ID
- 4503660
- Math proficiency
- 34% ▼ -1.00%
- Reading proficiency
- 41% ▼ -1.00%
- Median HH income
- $35,825
- Composite
- 31.04/100
- National rank
- #6087
- State rank
- #39 of 80 in SC
Livability — Spartanburg
- Score
- 76/100
- State rank
- #24
- US rank
- #3679
Category grades
Schools grade is shown separately in the Schools card above.
Census & demographics
- County
- Spartanburg County · 258,607 people
- City population
- 120,406
- Metro
- Spartanburg, SC
- Population (ZIP)
- 19,115
- Household income
- $65,850
- Rent vs Own
- Severe rent burden
- 438.0
Population outlook (Spartanburg County) Hauer SSP2
- Today (2025)
- 325,495 people
- By 2030
- 338,800 · +4.1%
- By 2040
- 363,471 · +11.7%
- By 2050
- 384,156 · +18.0%
- By 2075
- 430,137 · +32.1%
- By 2100
- 442,733 · +36.0%
Race, ethnicity, and origin ACS 2023
- Neighborhood character
- Predominantly White (74%)
- Race & ethnicity
- White 74% Black 20% Two or more races 4% Hispanic / Latino 3%
- Common ancestry
- Serbian 4% Slovak 2% Romanian 1%
- Foreign-born
- 4% · Canada, Jamaica
- Languages at home
- 91% English-only · Spanish 5% Russian/Polish/Slavic 1% Other Indo-European 1%
Political lean MEDSL · Spartanburg
- 2024 margin
- Solid R (+33.6) · D 32.6% · R 66.2% · Other 1.2%
- 2008→2024 swing
- -12.0pp toward R · 2008: -21.6pp · 2024: -33.6pp
- All cycles
- 2024: R+33.6 2020: R+27.3 2016: R+30.0 2012: R+23.1 2008: R+21.6
Not yet ingested
- Civics
- —
Market trends
- HPI YoY
- ▼ -52.58%
- Current HPI
- 244.9855
- Rent YoY
- ▲ 0.64%
- Metro
- Spartanburg, SC
- State GDP YoY
- ▲ 4.51%
- F500 in state
- 2
Industry mix (Fortune 500 HQ in SC)
| Industry | F500 HQs | Revenue |
|---|---|---|
| Packaging | 1 | $7B |
|
||
Price history
-5.8% since first listed2 events — show timeline
- 2026-05-27 Price Changed $245,000 SPMLS
- 2026-05-27 Listed $260,000 SPMLS
Cash-flow waterfall
monthlySold comps — $/sqft
last 12 mo · ≤1 miLoading sold comps…