 6-Plex
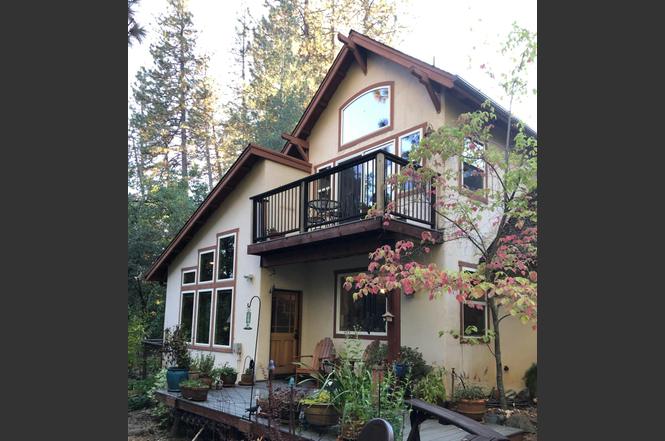
26070 - 26080 Green Acres Rd · Colfax, CA
Flood risk 1/10 · Minimal
- FEMA flood zone
- X (unshaded)
- Chance of flooding over 30 yrs
- 0.0%
- Est. flood insurance / yr
- $507 – $1,088
Fire risk 8/10 · Major
- Est. fire insurance / yr
- $659 – $1,223
Heat risk 5/10 · Moderate
- Hot days now (above 98°F)
- 7 days/yr
- Hot days in 30 yrs
- 14 days/yr
Wind risk 1/10 · Minimal
- Chance of severe wind over 30 yrs
- —
Air-quality risk 10/10 · Severe
- Unhealthy air days now
- 22 days/yr
- Unhealthy air days in 30 yrs
- 32 days/yr
Risk factors via First Street. Map © Google.
Why this score? — see what drove the B- grade
The composite is a weighted blend of 9 inputs, each scored 0–100. Each bar is that input's sub-score; the figure is the points it added to the 100-point composite (weight × sub-score).
- Cash flow +30.0/30.0
- DSCR +10.0/10.0
- 1% rule +8.0/10.0
- ARV discount +7.5/15.0
- Livability +3.6/5.0
- Schools +2.6/10.0
- Rent growth +2.5/5.0
- Condition / age +2.5/5.0
- Appreciation +0.0/10.0
$650,000
🖨 Deal sheet 📄 Offer letter ✓ Due diligence
Multi-family units
County records classify this as Multi-Family (2-4 Unit). Listing-text estimate: 6 units. estimate disagrees with records
Listing remarks
Escape to a custom-designed, multigenerational retreat commissioned in 2000 from renowned architect Michael Kent Murphy. Set in the middle of 6.25 GORGEOUS ACRES, just two miles from historic downtown Colfax, this home features stunning reclaimed Douglas fir floors, VAULTED CEILINGS and large energy-efficient windows that flood the spaces with natural light and incredible views. Discover delightful surprises throughout, including a secret passage through the master bedroom closet to a 264 square foot FLEX-ROOM to be used as your imagination sees fit, a custom shower floor crafted from rocks collected from the nearby Bear River, and a laundry chute that goes from the upstairs bathroom to th
Key facts
- Wood stove
- Vaulted ceilings
- Granite counters
Tags
Property features AI
Finance
- HOA & community: No association
Exterior
- Parking: 4 garage spaces; Attached and detached garage options; Garage door opener; Garage faces front; Guest parking available; Paved driveway and gravel areas
- Utilities: Propane tank owned; Generator available; 220V in laundry; Well water with storage tank; Septic system (connected); Irrigation available via public district; Internet available
- Home design: Residential property with 2 houses on the lot; Detached structures; Original condition; Built in 2000; Two stories; Entry includes street entrance
- Construction: Composition roof; Outbuildings and guest house present
- Exterior features: Balcony; Uncovered courtyard; Partial wire fencing; Allows horses; Sheds, storage, guest house and outbuildings; Auto sprinkler front and rear; Private garden and landscaped front
Interior
- Kitchen: Granite counters; Pantry closet; Kitchen/family room combo; Free standing gas range; Range hood; Dishwasher; Microwave
- Bedrooms: 2 bedrooms (possible 3); Master bedroom with balcony, walk-in closet and sitting area
- Flooring: Carpet; Tile; Wood
- Bathrooms: 2 full bathrooms; Master bath with shower stall and granite/stone surfaces; Other bath with tub/shower over, shower stall and window
- Heating & cooling: Central heating; Propane heating available; Wood stove heating; Ceiling fans; Window air conditioning units
- Interior features: Cathedral ceiling; Open beam ceiling; Skylights in living room; Back porch; Window screens; Dual-pane and Low-E partial windows; One fireplace with a wood stove
- Laundry & utility: Laundry room with hookups only, inside area and sink; Laundry chute
Neighborhood map
What this means for you Summary
Snapshot
- This is a 6 × 2-bed/2.0-bath units multifamily listed at $650k.
Deal economics
- At list price, monthly cash flow is $3k ($33k/yr) — positive. Per door: $457/mo.
- The deal already cash-flows at list — no discount required.
- Meets the 1% rule at list price ($8k rent vs $650k).
- Recommended offer: $572k (12.0% below list) — sets the bar for market timing.
- Cap rate 11.4% vs local median 2.5% in Colfax — top-decile yield for the area; either an underpriced asset or a hidden risk that comps aren't pricing in. Stress-test before assuming the spread holds.
Location & tenants
- Location reads 71/100 on livability (#216 in CA) — a middle-class / working-renter tenant base. Strengths: housing A+, health & safety A+, crime B+; Watch: amenities F, commute F, cost of living F.
- Colfax Elementary (rural): math 24% / reading 33% proficiency, ranked #348 of 517 in CA (top 67%) — low school quality limits family demand, transient renter base, plan for 1-2y turnover.
- Market conditions: 105 active listings in the ZIP; solid renter incomes; 3,535 units permitted in Placer County in 2024 (689 in 5+ unit buildings).
- At $8,472/mo this rent would consume 116% of the median local household income ($88k/yr) (locally 209% of renters already pay >50% of income on rent) — very limited rent-growth headroom before tenants either downsize or default.
Forward outlook
- Local home prices are declining (-3.0%/yr); year-one equity from $4k of loan paydown is wiped out by about $20k of value loss. Plan a longer hold.
- Placer County population projected at +20% by 2050 — long-run rental-demand tailwind backs the buy-and-hold thesis.
- At projected returns (-3.0% appreciation + 3.0% rent growth), your $182k cash investment doubles in ~7 years — after that, you're playing with house money.
Negotiation context
- It's been on market 132 days — a 12% lower offer ($572k) is reasonable based on typical stale-listing flexibility.
- Current owner paid $60k; list at $650k implies a 983% gain — meaningful room to come down on a strong offer.
Risks & watch-outs
- Climate carrying-cost: severe wildfire risk; extreme-heat days projected 7→14/yr by 2055 (HVAC capex compounding) — expect insurance premiums to compound above CPI over the hold.
Questions for the listing agent
- It's been on market 132 days. Have you received any prior offers? Is the seller open to a 12% concession, seller financing, or rate buy-down credit?
- Can we see the unit-by-unit rent roll, current vacancy, and any below-market leases? What's the average tenancy length?
- What capital expenditures (roof, boiler, parking lot, exteriors) have been made in the last 5 years, and what's planned in the next 2?
- Why hasn't it sold? Are there any deal-killer items the seller is aware of (foundation, flood, title, zoning, code violations)?
- Is there a deadline driving the sale (1031 exchange, divorce, estate, relocation)? That informs how much negotiation room exists.
- What's the average days-on-market for RENTAL listings here right now (not sales)? A rising rental-DOM trend means longer vacancies and softer asking-rent achievability than the comps imply.
- What's the recent tenant-quality profile in this submarket — average credit score on applications, eviction rate, late-payment / NSF rate, and stable-employment percentage? A property-management company in the area should have these aggregated.
- How much new apartment / multifamily construction is in the pipeline within 1–3 miles? Heavy new supply (>2% of stock underway) typically softens rents 12–24 months out; light construction supports rent growth.
Investment metrics
- 1% rule
- 1.30% ✓
- Cap rate
- 11.35%
- Cash-on-cash
- 18.08%
- DSCR
- 1.80
- GRM
- 6.4
CMA / ARV
No comps found within radius.
Projected returns pro-forma
-3.0% appreciation · 3.0% rent growth · sell at horizon
- IRR
- 9.6%
- Equity multiple
- 1.38×
- Total profit
- $69,098
- Equity at exit
- $96,917
- IRR
- 18.8%
- Equity multiple
- 2.56×
- Total profit
- $284,203
- Equity at exit
- $56,200
Cash invested: $182,000 (down + closing). Projections, not guarantees.
Landlord ↔ Tenant lean methodology
- Overall (STATE)
- 18 Strongly Tenant-Friendly
- State California
- 18 Strongly Tenant-Friendly · D+13
- County
- — inherits STATE
- City
- — inherits STATE
ZIP-level market 95713
- Active inventory
- 105
- Price-to-rent
- 38.4×
Monthly cashflow live
- Estimated rent
- $8,472 medium interval (Pro) →
- Mortgage (P&I)
- −$3,409
- Tax from tax record
- −$272 /mo · $3,258/yr
- Insurance
- −$271
- HOA
- −$0
- Vacancy / Maint / Mgmt
- −$1,779
- Net cashflow
- $2,742
Break-even live
6-unit breakdown (identical units grouped — click to expand)
| Units | Beds | Baths | Est. rent |
|---|---|---|---|
| 6× units | 2 | 2 | $8,472 |
| #1 | 2 | 2 | $1,412 |
| #2 | 2 | 2 | $1,412 |
| #3 | 2 | 2 | $1,412 |
| #4 | 2 | 2 | $1,412 |
| #5 | 2 | 2 | $1,412 |
| #6 | 2 | 2 | $1,412 |
| Total (6 units) | $8,472 | ||
UW: 25.0% down · 7.5% · 30yr · 1.5% tax · 5.0% vac · 8.0% maint · 8.0% mgmt
Financing live
Cash to close
- Down payment
- $162,500
- Closing costs
- $19,500
- Reserves months
- —
- Total cash needed
- —
Loan-product check · same deal, 3 products live
Conventional
25% down · 7.5% · 30yr
- Down + closing
- —
- Monthly P&I
- —
- Monthly cashflow
- —
- DSCR
- —
- Eligible?
- —
Personal DTI + credit; lowest rate.
DSCR
20% down · 8.5% · 30yr
- Down + closing
- —
- Monthly P&I
- —
- Monthly cashflow
- —
- DSCR
- —
- Eligible?
- —
No personal income docs; deal must DSCR.
Hard money
10% down · 12.0% · 12mo
- Down + closing
- —
- Monthly P&I
- —
- Monthly cashflow
- —
- DSCR
- —
- Eligible?
- —
Short-term bridge; refi at stabilization.
Listing history 17 events
-
2026-06-19days on market $650,000 Active 132 DOM
-
2026-06-18days on market $650,000 Active 131 DOM
-
2026-06-17days on market $650,000 Active 130 DOM
-
2026-06-16days on market $650,000 Active 129 DOM
-
2026-06-15days on market $650,000 Active 128 DOM
-
2026-06-13days on market $650,000 Active 126 DOM
-
2026-06-13days on market $650,000 Active 125 DOM
-
2026-06-10days on market $650,000 Active 123 DOM
-
2026-06-09days on market $650,000 Active 122 DOM
-
2026-06-08days on market $650,000 Active 121 DOM
-
2026-06-07statusdays on market $650,000 Active 120 DOM
-
2026-06-02status $650,000 Pending 119 DOM
-
2026-06-02days on market $650,000 Active 119 DOM
-
2026-06-01days on market $650,000 Active 118 DOM
-
2026-05-31days on market $650,000 Active 117 DOM
-
1988-07-08soldstatus $60,000
-
1988-07-08soldstatus $60,000
ⓘ Source: listings_history table (triggers on properties + properties_extension) + one-shot
backfill from property_details.listing_events for pre-trigger history.
Tax reassessment forecast CA · Resets to sale price
- Current annual tax
- $3,258 · $272/mo
- Projected year-2 tax
- $4,940 · $412/mo
- Expected delta
- +$1,682/yr (+$140/mo · 51.6%)
ⓘ Screening estimate from a state-policy table — verify with the county assessor before closing.
Climate risk First Street
- Flood 1/10 Low FEMA zone X (unshaded) · 0% chance over 30 yrs
- Wildfire 8/10 Severe
- Heat 5/10 Major 7 d/yr ≥98°F today · 14 d/yr by 30 yrs out
- Wind 1/10 Low
- Air quality 10/10 Extreme 22 unhealthy d/yr today · 32 by 30 yrs out
Nearby sold comps map
Loading sold comps map…
Walkable amenities ~0.75 mi
Loading nearby amenities…
Taxation est. · year 1
- Rental income
- $101,664
- − Mortgage interest
- −$36,410
- − Property taxes
- −$3,258
- − Insurance
- −$3,250
- − Repairs & maintenance
- −$8,133
- − Management
- −$8,133
- − Depreciation
- −$18,909
- Taxable income
- $23,570
- Est. tax owed @ 24.0%
- −$5,657
- After-tax cash flow
- $27,245/yr
For passive investors: Depreciation is non-cash, so a rental often shows a tax loss while cash-flowing — sheltering income. Rental losses are passive: they offset passive income freely, and up to $25,000/yr can offset ordinary (W-2) income if you actively participate and your MAGI is under $100k (phasing out to $0 by $150k); unused losses carry forward. On sale, claimed depreciation is recaptured at up to 25%, and gains may owe capital-gains tax (a 1031 exchange can defer both). Figures are a year-1 estimate at your 24.0% rate — not tax advice; consult a CPA.
Schools (NCES district)
- District
- Colfax Elementary
- NCES district ID
- 0609300
- Math proficiency
- 24% ▼ -18.00%
- Reading proficiency
- 33% ▼ -12.00%
- Median HH income
- $59,844
- Composite
- 25.87/100
- National rank
- #7345
- State rank
- #348 of 517 in CA
Livability — Colfax
- Score
- 71/100
- State rank
- #216
- US rank
- #6827
Category grades
Schools grade is shown separately in the Schools card above.
Census & demographics
- County
- Placer County · 390,510 people
- City population
- 9,448
- Metro
- Sacramento-Roseville-Folsom, CA
- Population (ZIP)
- 9,448
- Household income
- $87,839
- Rent vs Own
- Severe rent burden
- 209.0
Population outlook (Placer County) Hauer SSP2
- Today (2025)
- 422,709 people
- By 2030
- 444,249 · +5.1%
- By 2040
- 480,192 · +13.6%
- By 2050
- 506,390 · +19.8%
- By 2075
- 550,219 · +30.2%
- By 2100
- 547,760 · +29.6%
Race, ethnicity, and origin ACS 2023
- Neighborhood character
- Predominantly White (79%)
- Race & ethnicity
- White 79% Hispanic / Latino 12% Two or more races 9% Asian 2%
- Hispanic origin (detail)
- Mexican 7%
- Common ancestry
- Italian 5% Slovak 3% Portuguese 3%
- Foreign-born
- 7% · Canada, China
- Languages at home
- 93% English-only · Spanish 4% Other Indo-European 3%
Political lean MEDSL · Placer
- 2024 margin
- Lean R (+8.5) · D 44.3% · R 52.8% · Other 2.9%
- 2008→2024 swing
- +2.8pp toward D · 2008: -11.3pp · 2024: -8.5pp
- All cycles
- 2024: R+8.5 2020: R+6.7 2016: R+11.3 2012: R+20.1 2008: R+11.3
Not yet ingested
- Civics
- —
Market trends
- HPI YoY
- ▼ -142.00%
- Current HPI
- 238.8248
- Rent YoY
- —
- Metro
- Sacramento-Roseville-Folsom, CA
- State GDP YoY
- ▲ 3.21%
- F500 in state
- 116
Industry mix (Fortune 500 HQ in CA)
| Industry | F500 HQs | Revenue |
|---|---|---|
| Technology | 27 | $1,492B |
|
||
| Financial Services | 3 | $174B |
|
||
| Retail | 3 | $44B |
|
||
| Insurance | 3 | $26B |
|
||
| Media / Entertainment | 2 | $115B |
|
||
| Pharmaceuticals / Biotech | 2 | $62B |
|
||
Price history
+0.0% since first listed2 events — show timeline
- 1988-07-08 Sold (Public Records) $60,000 Public Records
- 1988-07-08 Sold (Public Records) $60,000 Public Records
Property tax history
+1.7%/yrLatest (2025): $3,258 · -0.7% YoY. Source: county tax records.
Cash-flow waterfall
monthlySold comps — $/sqft
last 12 mo · ≤1 miLoading sold comps…