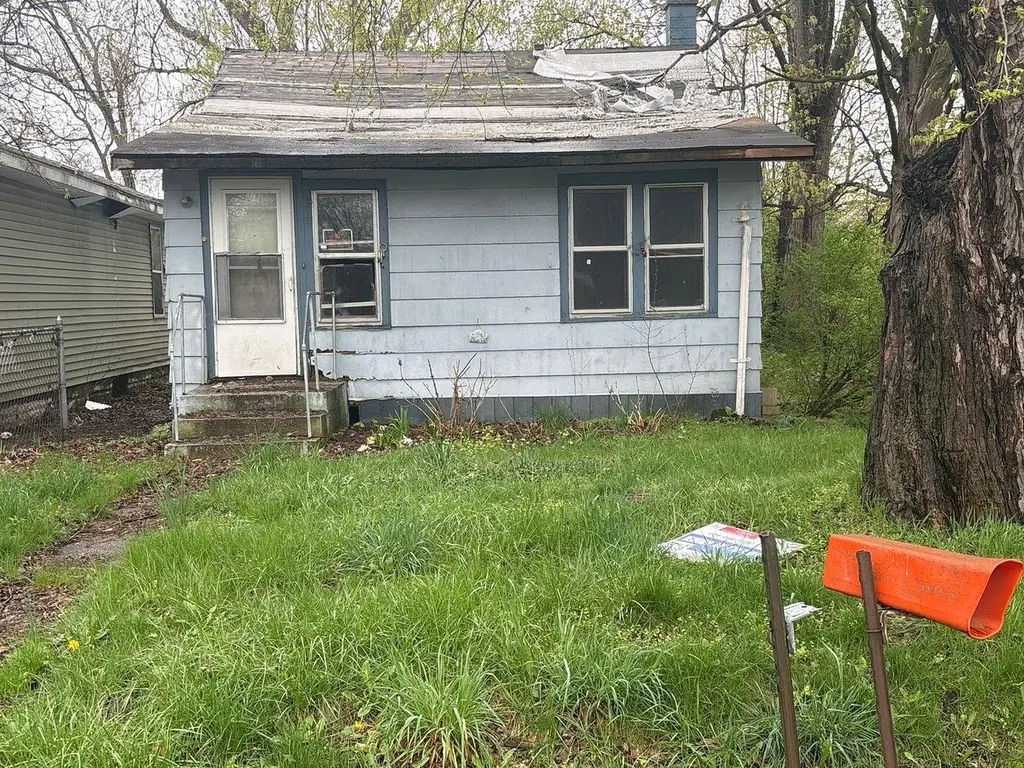
282 Chestnut St · Benton Heights, MI
Flood risk 1/10 · Minimal
- FEMA flood zone
- X (unshaded)
- Chance of flooding over 30 yrs
- 0.0%
- Est. flood insurance / yr
- $473 – $860
Fire risk 1/10 · Minimal
- Est. fire insurance / yr
- $784 – $1,456
Heat risk 2/10 · Minimal
- Hot days now (above 100°F)
- 7 days/yr
- Hot days in 30 yrs
- 14 days/yr
Wind risk 2/10 · Minimal
- Chance of severe wind over 30 yrs
- —
Air-quality risk 3/10 · Minor
- Unhealthy air days now
- 2 days/yr
- Unhealthy air days in 30 yrs
- 3 days/yr
Risk factors via First Street. Map © Google.
Why this score? — see what drove the B grade
The composite is a weighted blend of 9 inputs, each scored 0–100. Each bar is that input's sub-score; the figure is the points it added to the 100-point composite (weight × sub-score).
- Cash flow +30.0/30.0
- ARV discount +15.0/15.0
- 1% rule +10.0/10.0
- DSCR +10.0/10.0
- Livability +3.2/5.0
- Rent growth +2.5/5.0
- Condition / age +2.5/5.0
- Schools +0.8/10.0
- Appreciation +0.0/10.0
$29,500
🖨 Deal sheet 📄 Offer letter ✓ Due diligence
Listing remarks MLS
Opportunity to update, this value-add property offers strong potential for renovation. Just minutes from downtown, the airport, and under 10 minutes to the beach, the location adds long-term appeal. Conveyed via quit claim deed.
Key facts
- 5,379 sq ft lot
- Built 1930
- Listed 34 days
Property features AI
Exterior
- Utilities: Public water; Natural gas for water heater
- Home design: Ranch-style single-family home; One story
- Construction: Built in 1930; Vinyl siding
- Exterior features: Lot size about 0.12 acres; Public water
Interior
- Kitchen: Kitchen approximately 10 x 10
- Bedrooms: Primary bedroom approximately 11 x 10
- Bathrooms: 1 full bathroom
- Heating & cooling: Forced air heating
- Interior features: Total of 3 rooms; Basement: Other
- Laundry & utility: Natural gas water heater
Neighborhood map
What this means for you Summary
Snapshot
- This is a 1-bed/1.0-bath single-family listed at $30k.
Deal economics
- At list price, monthly cash flow is $628 ($8k/yr) — positive.
- The deal already cash-flows at list — no discount required.
- Meets the 1% rule at list price ($1k rent vs $30k).
- Recommended offer: $29k (3.0% below list) — sets the bar for market timing.
Location & tenants
- Location reads 63/100 on livability (#506 in MI) — a middle-class / working-renter tenant base. Strengths: cost of living A+, housing A+, health & safety A+; Watch: crime C-, schools F, amenities F.
- Benton Harbor Area Schools (urban): math 4% / reading 7% proficiency, ranked #732 of 760 in MI (top 96%) — low school quality limits family demand, transient renter base, plan for 1-2y turnover; 89% free/reduced lunch — lower-income household profile, screen leases tightly.
- Market conditions: 179 active listings in the ZIP; 1 comparable units currently listed for rent nearby; 397 units permitted in Berrien County in 2024 (40 in 5+ unit buildings).
Forward outlook
- Local home prices are declining (-3.0%/yr); year-one equity from $204 of loan paydown is wiped out by about $885 of value loss. Plan a longer hold.
- Berrien County population projected at -16% by 2050 — secular population decline; favor cash flow + early exit over multi-decade hold.
- At projected returns (-3.0% appreciation + 3.0% rent growth), your $8k cash investment doubles in ~2 years — after that, you're playing with house money.
Negotiation context
- It's been on market 35 days — a 3% lower offer ($29k) is reasonable based on typical stale-listing flexibility.
- 3 sale attempts with the ask held roughly flat each time — persistent listings suggest the price (not the market) is what's stuck; bring a comps-based counter.
Risks & watch-outs
- Watch-outs: property tax is 3.0% of price; built in 1930 — expect roof / HVAC / electrical / plumbing capex.
Questions for the listing agent
- It's been on market 35 days. Have you received any prior offers? Is the seller open to a 3% concession, seller financing, or rate buy-down credit?
- Built in 1930 — when were the roof, HVAC, electrical panel, plumbing, and water heater last replaced?
- Property tax is high relative to price — has the assessment been appealed recently, and will the sale trigger a re-assessment?
- Is there a deadline driving the sale (1031 exchange, divorce, estate, relocation)? That informs how much negotiation room exists.
- Schools are F-rated, which usually means shorter tenancies and higher turnover. Who's the typical renter profile here, and what's been the actual vacancy rate?
- What's the average days-on-market for RENTAL listings here right now (not sales)? A rising rental-DOM trend means longer vacancies and softer asking-rent achievability than the comps imply.
- What's the recent tenant-quality profile in this submarket — average credit score on applications, eviction rate, late-payment / NSF rate, and stable-employment percentage? A property-management company in the area should have these aggregated.
- How much new for-sale + rental construction is in the pipeline within 1–3 miles? Heavy new supply typically softens prices + rents 12–24 months out; constrained supply supports both.
Investment metrics
- 1% rule
- 3.73% ✓
- Cap rate
- 31.86%
- Cash-on-cash
- 91.30%
- DSCR
- 5.06
- GRM
- 2.2
CMA / ARV
- ARV (median comp)
- $43,460
- List price
- $29,500
- Delta
- -32.12%
- Verdict
- UNDERPRICED
- Comps
- 20 within 1.0 mi
Show comp detail 6 sales within ~0.75 mi
| Address | Dist | Beds/Ba | Sqft | Sold | Price | $/sf | Match |
|---|---|---|---|---|---|---|---|
| 234 Walnut St | 0.14mi | 2/1.0 (+1) | 748 (+1%) | 5mo | $18,000 | $24 | 83 |
| 254 Chestnut St | 0.03mi | 2/1.0 (+1) | 704 (-5%) | 20mo | $33,900 | $48 | 69 |
| 775 Pasadena Avenue Ave | 0.33mi | 1/1.5 | 672 (-9%) | 12mo | $55,000 | $82 | 57 |
| 831 La Salle St | 0.29mi | 2/1.0 (+1) | 640 (-14%) | 3mo | $37,000 | $58 | 56 |
| 785 Buss Ave | 0.44mi | 2/1.0 (+1) | 794 (+7%) | 22mo | $45,000 | $57 | 44 |
| 1460 Territorial Rd | 0.62mi | 2/1.0 (+1) | 712 (-4%) | 23mo | $140,000 | $197 | 41 |
Match score weights: distance 35% · size 25% · config 20% · recency 20%. Top-matched comps best support the ARV.
Projected returns pro-forma
-3.0% appreciation · 3.0% rent growth · sell at horizon
- IRR
- 92.1%
- Equity multiple
- 5.27×
- Total profit
- $35,283
- Equity at exit
- $4,399
- IRR
- 94.9%
- Equity multiple
- 10.98×
- Total profit
- $82,421
- Equity at exit
- $2,551
Cash invested: $8,260 (down + closing). Projections, not guarantees.
Landlord ↔ Tenant lean methodology
- Overall (STATE)
- 62 Landlord-Friendly
- State Michigan
- 62 Landlord-Friendly · EVEN
- County
- — inherits STATE
- City
- — inherits STATE
ZIP-level market 49022
- Active inventory
- 179
- Price-to-rent
- 2.2×
Monthly cashflow live
- Estimated rent
- $1,100 medium interval (Pro) →
- Mortgage (P&I)
- −$155
- Tax from tax record
- −$74 /mo · $883/yr
- Insurance
- −$12
- HOA
- −$0
- Vacancy / Maint / Mgmt
- −$231
- Net cashflow
- $628
Break-even live
UW: 25.0% down · 7.5% · 30yr · 1.5% tax · 5.0% vac · 8.0% maint · 8.0% mgmt
Financing live
Cash to close
- Down payment
- $7,375
- Closing costs
- $885
- Reserves months
- —
- Total cash needed
- —
Loan-product check · same deal, 3 products live
Conventional
25% down · 7.5% · 30yr
- Down + closing
- —
- Monthly P&I
- —
- Monthly cashflow
- —
- DSCR
- —
- Eligible?
- —
Personal DTI + credit; lowest rate.
DSCR
20% down · 8.5% · 30yr
- Down + closing
- —
- Monthly P&I
- —
- Monthly cashflow
- —
- DSCR
- —
- Eligible?
- —
No personal income docs; deal must DSCR.
Hard money
10% down · 12.0% · 12mo
- Down + closing
- —
- Monthly P&I
- —
- Monthly cashflow
- —
- DSCR
- —
- Eligible?
- —
Short-term bridge; refi at stabilization.
Rent comps 1 comps
| Address | Beds | Baths | Sqft | Rent | $/sqft | DOM | Units | Dist |
|---|---|---|---|---|---|---|---|---|
| 1218 Vincent Ct Benton Harbor, MI | 2.0 | 1.0 | 705 | $1,100 | $1.56 | 43d | 1 | 0.25mi |
Listing history 19 events
-
2026-06-19days on market $29,500 Active 35 DOM
-
2026-06-18days on market $29,500 Active 34 DOM
-
2026-06-17days on market $29,500 Active 33 DOM
-
2026-06-16days on market $29,500 Active 32 DOM
-
2026-06-15days on market $29,500 Active 31 DOM
-
2026-06-14days on market $29,500 Active 29 DOM
-
2026-06-13days on market $29,500 Active 28 DOM
-
2026-06-10days on market $29,500 Active 26 DOM
-
2026-06-09days on market $29,500 Active 25 DOM
-
2026-06-08days on market $29,500 Active 24 DOM
-
2026-06-07days on market $29,500 Active 23 DOM
-
2026-06-03days on market $29,500 Active 19 DOM
-
2026-06-02days on market $29,500 Active 18 DOM
-
2026-06-01days on market $29,500 Active 17 DOM
-
2026-05-31days on market $29,500 Active 16 DOM
-
2026-05-30days on market $29,500 Active 15 DOM
-
2026-05-15$29,500 Active 228-char remark
Show marketing remark (228 chars)
Opportunity to update, this value-add property offers strong potential for renovation. Just minutes from downtown, the airport, and under 10 minutes to the beach, the location adds long-term appeal. Conveyed via quit claim deed.
-
2026-05-15$29,500 Active
Show marketing remark (228 chars)
Opportunity to update, this value-add property offers strong potential for renovation. Just minutes from downtown, the airport, and under 10 minutes to the beach, the location adds long-term appeal. Conveyed via quit claim deed.
ⓘ Source: listings_history table (triggers on properties + properties_extension) + one-shot
backfill from property_details.listing_events for pre-trigger history.
Tax reassessment forecast MI · Partial reset (capped growth)
- Current annual tax
- $883 · $74/mo
- Projected year-2 tax
- $883 · $74/mo
- Expected delta
- $0/yr ($0/mo · 0.0%)
ⓘ Screening estimate from a state-policy table — verify with the county assessor before closing.
Climate risk First Street
- Flood 1/10 Low FEMA zone X (unshaded) · 0% chance over 30 yrs
- Wildfire 1/10 Low
- Heat 2/10 Low 7 d/yr ≥100°F today · 14 d/yr by 30 yrs out
- Wind 2/10 Low
- Air quality 3/10 Moderate 2 unhealthy d/yr today · 3 by 30 yrs out
Nearby sold comps map
Loading sold comps map…
Walkable amenities ~0.75 mi
Loading nearby amenities…
Taxation est. · year 1
- Rental income
- $13,200
- − Mortgage interest
- −$1,652
- − Property taxes
- −$883
- − Insurance
- −$148
- − Repairs & maintenance
- −$1,056
- − Management
- −$1,056
- − Depreciation
- −$858
- Taxable income
- $7,547
- Est. tax owed @ 24.0%
- −$1,811
- After-tax cash flow
- $5,730/yr
For passive investors: Depreciation is non-cash, so a rental often shows a tax loss while cash-flowing — sheltering income. Rental losses are passive: they offset passive income freely, and up to $25,000/yr can offset ordinary (W-2) income if you actively participate and your MAGI is under $100k (phasing out to $0 by $150k); unused losses carry forward. On sale, claimed depreciation is recaptured at up to 25%, and gains may owe capital-gains tax (a 1031 exchange can defer both). Figures are a year-1 estimate at your 24.0% rate — not tax advice; consult a CPA.
Schools (NCES district)
- District
- Benton Harbor Area Schools
- NCES district ID
- 2604830
- Math proficiency
- 4% ▬ 0.00%
- Reading proficiency
- 7% ▬ 0.00%
- Median HH income
- $27,038
- Composite
- 7.53/100
- National rank
- #14787
- State rank
- #732 of 760 in MI
Livability — Benton Heights
- Score
- 63/100
- State rank
- #506
- US rank
- #15039
Category grades
Schools grade is shown separately in the Schools card above.
Census & demographics
- Census place
- Benton Heights, MI
- Population (ZIP)
- 29,796
Population outlook (Berrien County) Hauer SSP2
- Today (2025)
- 149,273 people
- By 2030
- 145,211 · -2.7%
- By 2040
- 135,435 · -9.3%
- By 2050
- 125,543 · -15.9%
- By 2075
- 103,986 · -30.3%
- By 2100
- 82,256 · -44.9%
Race, ethnicity, and origin ACS 2023
- Neighborhood character
- Diverse neighborhood (Simpson 0.61)
- Race & ethnicity
- Black 50% White 37% Hispanic / Latino 7% Two or more races 6% Native American 2%
- Hispanic origin (detail)
- Mexican 6%
- Common ancestry
- Romanian 1% Lithuanian 1% Slovak 1%
- Foreign-born
- 3% · Canada
- Languages at home
- 94% English-only · Spanish 5%
Political lean MEDSL · Berrien
- 2024 margin
- Lean R (+7.9) · D 45.4% · R 53.2% · Other 1.4%
- 2008→2024 swing
- -13.3pp toward R · 2008: 5.5pp · 2024: -7.9pp
- All cycles
- 2024: R+7.9 2020: R+7.4 2016: R+12.7 2012: R+6.6 2008: D+5.5
Not yet ingested
- Civics
- —
Market trends
- HPI YoY
- ▼ -309.81%
- Current HPI
- 209.9723
- Rent YoY
- —
- Metro
- —
- State GDP YoY
- ▲ 1.37%
- F500 in state
- 28
Industry mix (Fortune 500 HQ in MI)
| Industry | F500 HQs | Revenue |
|---|---|---|
| Automotive Parts | 3 | $48B |
|
||
| Automotive | 2 | $372B |
|
||
| Chemicals | 1 | $45B |
|
||
| Automotive Retail | 1 | $29B |
|
||
| Healthcare / Medical Devices | 1 | $23B |
|
||
| Automotive Technology | 1 | $20B |
|
||
Price history
+0.0% since first listed3 events — show timeline
- 2026-05-15 Listed $29,500 REALCOMP
- 2026-05-15 Listed $29,500 MiRealSource-MiMLS
- 2026-05-15 Listed $29,500 SW Michigan MLS
Property tax history
+5.3%/yrLatest (2024): $883 · -74.7% YoY. Source: county tax records.
Cash-flow waterfall
monthlySold comps — $/sqft
last 12 mo · ≤1 miLoading sold comps…