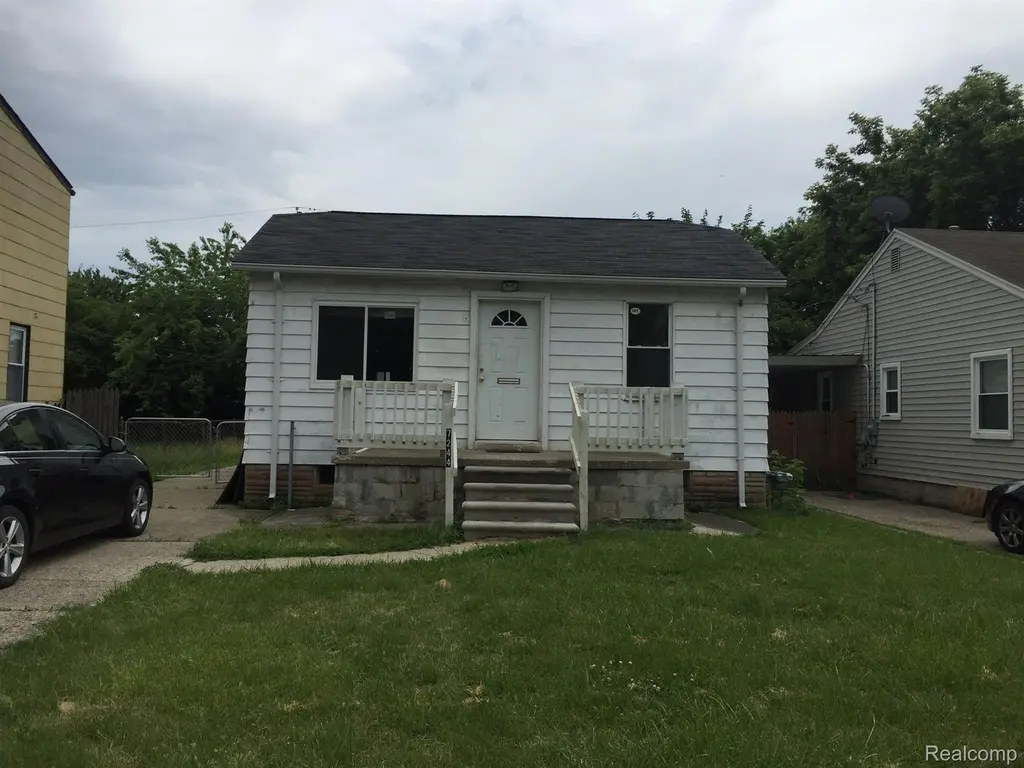
7244 Ford Ave · Warren, MI
Flood risk 4/10 · Minor
- FEMA flood zone
- X (unshaded)
- Chance of flooding over 30 yrs
- 0.21%
- Est. flood insurance / yr
- $473 – $860
Fire risk 1/10 · Minimal
- Est. fire insurance / yr
- $784 – $1,456
Heat risk 3/10 · Minor
- Hot days now (above 97°F)
- 7 days/yr
- Hot days in 30 yrs
- 15 days/yr
Wind risk 1/10 · Minimal
- Chance of severe wind over 30 yrs
- —
Air-quality risk 3/10 · Minor
- Unhealthy air days now
- 3 days/yr
- Unhealthy air days in 30 yrs
- 4 days/yr
Risk factors via First Street. Map © Google.
Why this score? — see what drove the B grade
The composite is a weighted blend of 9 inputs, each scored 0–100. Each bar is that input's sub-score; the figure is the points it added to the 100-point composite (weight × sub-score).
- Cash flow +27.8/30.0
- ARV discount +14.4/15.0
- DSCR +9.8/10.0
- 1% rule +9.7/10.0
- Livability +3.7/5.0
- Rent growth +3.1/5.0
- Condition / age +2.5/5.0
- Schools +1.0/10.0
- Appreciation +0.0/10.0
$79,999
🖨 Deal sheet (PDF) 📄 Offer letter ✓ Due diligence
Listing remarks MLS
House has tenant, please do not approach! Could be good house to live in, buy and hold rental with steady income. 2 bedrooms on main floor, 1 bedroom has a 2nd room off the back. House completely updated 3 years ago including roof, flooring throughout, bathroom & kitchen. Tenant would be open to staying, currently under rented at $925 / mo.
Key facts
- 4,356 sq ft lot
- Garage
- Built 1946
Neighborhood map
What this means for you Summary
Snapshot
- This is a 2-bed/1.0-bath single-family listed at $80k.
Deal economics
- At list price, monthly cash flow is $244 ($3k/yr) — positive.
- The deal already cash-flows at list — no discount required.
- Meets the 1% rule at list price ($1k rent vs $80k).
- Recommended offer: $79k (1.5% below list) — sets the bar for market timing.
- Cap rate 9.9% vs local median 5.3% in Warren — top-decile yield for the area; either an underpriced asset or a hidden risk that comps aren't pricing in. Stress-test before assuming the spread holds.
Location & tenants
- Location reads 74/100 on livability (#171 in MI, #4,491 nationally) — a middle-class / working-renter tenant base. Strengths: commute A+, cost of living A+, housing A+; Watch: schools D, amenities D, employment D.
- Van Dyke Public Schools (urban): math 7% / reading 19% proficiency, ranked #512 of 540 in MI (top 95%) — low school quality limits family demand, transient renter base, plan for 1-2y turnover; 80% free/reduced lunch — lower-income household profile, screen leases tightly.
- Market conditions: Rents rising (+2.4%/yr); 168 active listings in the ZIP; 7 comparable units currently listed for rent nearby; rentals lingering (median 44d on market — plan ~5-8 weeks vacancy on turnover, expect pricing pressure); 71% of comp listings sitting > 30 days — soft ceiling on asking rent; 1,321 units permitted in Macomb County in 2024 (86 in 5+ unit buildings).
Forward outlook
- Local home prices are declining (-3.0%/yr); year-one equity from $553 of loan paydown is wiped out by about $2k of value loss. Plan a longer hold.
- Macomb County population projected at +9% by 2050 — modest demand growth; plan on rents tracking national, not racing it.
- At projected returns (-3.0% appreciation + 2.4% rent growth), your $22k cash investment doubles in ~10 years — after that, you're playing with house money.
Negotiation context
- It's been on market 21 days — a 2% lower offer ($79k) is reasonable based on typical stale-listing flexibility.
- 7 sale attempts since 14y ago; this cycle's ask is 6054% above the opening price — seller raised mid-cycle; expect resistance to lowballs.
Risks & watch-outs
- Watch-outs: property tax is 3.5% of price; built in 1946 — expect roof / HVAC / electrical / plumbing capex.
Questions for the listing agent
- Built in 1946 — when were the roof, HVAC, electrical panel, plumbing, and water heater last replaced?
- Property tax is high relative to price — has the assessment been appealed recently, and will the sale trigger a re-assessment?
- Is there a deadline driving the sale (1031 exchange, divorce, estate, relocation)? That informs how much negotiation room exists.
- Schools are D-rated, which usually means shorter tenancies and higher turnover. Who's the typical renter profile here, and what's been the actual vacancy rate?
- Crime grade is D in this area — have there been break-ins, vandalism, or insurance claims at this property in the last 3 years? What carrier currently insures it and at what premium?
- What's the average days-on-market for RENTAL listings here right now (not sales)? A rising rental-DOM trend means longer vacancies and softer asking-rent achievability than the comps imply.
- What's the recent tenant-quality profile in this submarket — average credit score on applications, eviction rate, late-payment / NSF rate, and stable-employment percentage? A property-management company in the area should have these aggregated.
- How much new for-sale + rental construction is in the pipeline within 1–3 miles? Heavy new supply typically softens prices + rents 12–24 months out; constrained supply supports both.
Investment metrics
- 1% rule
- 1.47% ✓
- Cap rate
- 9.95%
- Cash-on-cash
- 13.05%
- DSCR
- 1.58
- GRM
- 5.7
CMA / ARV
- ARV (on-the-fly)
- $94,428
- Comps found
- 12
Show comp detail 12 sales within ~0.75 mi
| Address | Dist | Beds/Ba | Sqft | Sold | Price | $/sf | Match |
|---|---|---|---|---|---|---|---|
| 7204 Continental Ave | 0.31mi | 2/1.5 | 732 (0%) | 1mo | $82,500 | $113 | 83 |
| 7036 Lozier Ave | 0.41mi | 2/1.0 | 696 (-5%) | 1mo | $82,500 | $119 | 72 |
| 8284 Dodge Ave | 0.45mi | 3/1.0 (+1) | 740 (+1%) | 2mo | $100,000 | $135 | 71 |
| 7220 Stephens St | 0.69mi | 2/1.0 | 720 (-2%) | 1mo | $118,000 | $164 | 64 |
| 7044 Westminster Ave | 0.55mi | 2/1.0 | 700 (-4%) | 4mo | $103,000 | $147 | 64 |
| 7232 Theut Ave | 0.51mi | 2/1.0 | 696 (-5%) | 5mo | $112,000 | $161 | 64 |
| 8712 Ford Ave | 0.70mi | 2/1.0 | 704 (-4%) | 3mo | $85,000 | $121 | 58 |
| 8477 Prospect Ave | 0.71mi | 2/1.0 | 696 (-5%) | 1mo | $90,000 | $129 | 58 |
| 8701 Toepfer Rd | 0.75mi | 3/1.0 (+1) | 720 (-2%) | 3mo | $80,000 | $111 | 55 |
| 7251 Yacht Ave | 0.57mi | 2/1.0 | 670 (-8%) | 6mo | $38,500 | $57 | 54 |
| 8094 Chalmers Ave | 0.39mi | 2/1.0 | 630 (-14%) | 6mo | $64,000 | $102 | 54 |
| 7282 Theut Ave | 0.51mi | 2/1.0 | 816 (+12%) | 5mo | $108,000 | $132 | 52 |
Match score weights: distance 35% · size 25% · config 20% · recency 20%. Top-matched comps best support the ARV.
Projected returns pro-forma
-3.0% appreciation · 2.35% rent growth · sell at horizon
- IRR
- 2.2%
- Equity multiple
- 1.08×
- Total profit
- $1,886
- Equity at exit
- $11,928
- IRR
- 11.1%
- Equity multiple
- 1.85×
- Total profit
- $18,928
- Equity at exit
- $6,917
Cash invested: $22,400 (down + closing). Projections, not guarantees.
Landlord ↔ Tenant lean methodology
- Overall (STATE)
- 62 Landlord-Friendly
- State Michigan
- 62 Landlord-Friendly · EVEN
- County
- — inherits STATE
- City
- — inherits STATE
ZIP-level market 48091
- Rents YoY
- 2.4%
- Active inventory
- 168
- Price-to-rent
- 5.7×
Monthly cashflow live
- Estimated rent
- $1,176 high interval (Pro) →
- Mortgage (P&I)
- −$420
- Tax from tax record
- −$233 /mo · $2,790/yr
- Insurance
- −$33
- HOA
- −$0
- Vacancy / Maint / Mgmt
- −$247
- Net cashflow
- $244
Break-even live
Sensitivity live
| Price | -10% $289 | -5% $266 | +0% $244 | +5% $221 | +10% $198 |
|---|---|---|---|---|---|
| Rent | -10% $151 | -5% $197 | +0% $244 | +5% $290 | +10% $336 |
| Rate | -1.0pp $284 | -0.5pp $264 | base $244 | +0.5pp $223 | +1.0pp $202 |
UW: 25.0% down · 7.5% · 30yr · 1.5% tax · 5.0% vac · 8.0% maint · 8.0% mgmt
Financing live
Cash to close
- Down payment
- $20,000
- Closing costs
- $2,400
- Reserves months
- —
- Total cash needed
- —
Loan-product check · same deal, 3 products live
Conventional
25% down · 7.5% · 30yr
- Down + closing
- —
- Monthly P&I
- —
- Monthly cashflow
- —
- DSCR
- —
- Eligible?
- —
Personal DTI + credit; lowest rate.
DSCR
20% down · 8.5% · 30yr
- Down + closing
- —
- Monthly P&I
- —
- Monthly cashflow
- —
- DSCR
- —
- Eligible?
- —
No personal income docs; deal must DSCR.
Hard money
10% down · 12.0% · 12mo
- Down + closing
- —
- Monthly P&I
- —
- Monthly cashflow
- —
- DSCR
- —
- Eligible?
- —
Short-term bridge; refi at stabilization.
Rent comps 7 comps
| Address | Beds | Baths | Sqft | Rent | $/sqft | DOM | Units | Dist |
|---|---|---|---|---|---|---|---|---|
| 8036 Hupp Ave Warren, MI | 2.0 | 1.0 | 680 | $1,150 | $1.69 | 44d | 1 | 0.23mi |
| 7275 Chalmers Ave Warren, MI | 2.0 | 1.0 | 703 | $1,200 | $1.71 | 25d | 1 | 0.24mi |
| 8103 Lozier Ave Unit 2 Warren, MI | 1.0 | 1.0 | 600 | $650 | $1.08 | 44d | 1 | 0.52mi |
| 7033 Westminster Ave Warren, MI | 2.0 | 1.0 | 561 | $1,050 | $1.87 | 44d | 1 | 0.52mi |
| 7605 Jackson Ave Warren, MI | 2.0 | 1.0 | 600 | $1,165 | $1.94 | 25d | 1 | 0.70mi |
| 11236 Studebaker Ave Warren, MI | 2.0 | 1.0 | 672 | $1,175 | $1.75 | 44d | 1 | 0.93mi |
| 11130 Stephens Rd Warren, MI | 2.0 | 1.0 | 750 | $1,300 | $1.73 | 44d | 1 | 1.10mi |
Listing history 20 events
-
2025-08-17historical $1,250
-
2025-08-13historical $1,300
-
2025-08-10$1,300
-
2025-07-18price $1,275
-
2025-07-02$1,300
-
2024-12-17status Pending
-
2023-10-23soldstatus $80,000
-
2023-08-31status Pending 348-char remark
Show marketing remark (348 chars)
House has tenant, please do not approach! Could be good house to live in, buy and hold rental with steady income. 2 bedrooms on main floor, 1 bedroom has a 2nd room off the back. House completely updated 3 years ago including roof, flooring throughout, bathroom & kitchen. Tenant would be open to staying, currently under rented at $925 / mo.
-
2023-08-31status Pending
Show marketing remark (348 chars)
House has tenant, please do not approach! Could be good house to live in, buy and hold rental with steady income. 2 bedrooms on main floor, 1 bedroom has a 2nd room off the back. House completely updated 3 years ago including roof, flooring throughout, bathroom & kitchen. Tenant would be open to staying, currently under rented at $925 / mo.
-
2023-08-10$79,999 Active
Show marketing remark (348 chars)
House has tenant, please do not approach! Could be good house to live in, buy and hold rental with steady income. 2 bedrooms on main floor, 1 bedroom has a 2nd room off the back. House completely updated 3 years ago including roof, flooring throughout, bathroom & kitchen. Tenant would be open to staying, currently under rented at $925 / mo.
-
2023-08-10$79,999 Active 348-char remark
Show marketing remark (348 chars)
House has tenant, please do not approach! Could be good house to live in, buy and hold rental with steady income. 2 bedrooms on main floor, 1 bedroom has a 2nd room off the back. House completely updated 3 years ago including roof, flooring throughout, bathroom & kitchen. Tenant would be open to staying, currently under rented at $925 / mo.
-
2018-02-22historical
-
2018-02-19status Pending
-
2018-02-19status Pending
-
2018-02-19historical
-
2017-12-07$20,000 Active
-
2017-12-07$20,000 Active
-
2013-01-19soldstatus $3,650
-
2012-07-18$3,650
-
1995-11-03soldstatus $38,900
ⓘ Source: listings_history table (triggers on properties + properties_extension) + one-shot
backfill from property_details.listing_events for pre-trigger history.
Tax reassessment forecast MI · Partial reset (capped growth)
- Current annual tax
- $2,790 · $233/mo
- Projected year-2 tax
- $2,790 · $233/mo
- Expected delta
- $0/yr ($0/mo · 0.0%)
ⓘ Screening estimate from a state-policy table — verify with the county assessor before closing.
Climate risk First Street
- Flood 4/10 Moderate FEMA zone X (unshaded) · 21% chance over 30 yrs
- Wildfire 1/10 Low
- Heat 3/10 Moderate 7 d/yr ≥97°F today · 15 d/yr by 30 yrs out
- Wind 1/10 Low
- Air quality 3/10 Moderate 3 unhealthy d/yr today · 4 by 30 yrs out
Nearby sold comps map
Loading sold comps map…
Walkable amenities ~0.75 mi
Loading nearby amenities…
Taxation est. · year 1
- Rental income
- $14,111
- − Mortgage interest
- −$4,481
- − Property taxes
- −$2,790
- − Insurance
- −$400
- − Repairs & maintenance
- −$1,129
- − Management
- −$1,129
- − Depreciation
- −$2,327
- Taxable income
- $1,854
- Est. tax owed @ 24.0%
- −$445
- After-tax cash flow
- $2,478/yr
For passive investors: Depreciation is non-cash, so a rental often shows a tax loss while cash-flowing — sheltering income. Rental losses are passive: they offset passive income freely, and up to $25,000/yr can offset ordinary (W-2) income if you actively participate and your MAGI is under $100k (phasing out to $0 by $150k); unused losses carry forward. On sale, claimed depreciation is recaptured at up to 25%, and gains may owe capital-gains tax (a 1031 exchange can defer both). Figures are a year-1 estimate at your 24.0% rate — not tax advice; consult a CPA.
Schools (NCES district)
- District
- Van Dyke Public Schools
- NCES district ID
- 2634680
- Math proficiency
- 7% ▼ -11.00%
- Reading proficiency
- 19% ▼ -5.00%
- Median HH income
- $33,231
- Composite
- 10.46/100
- National rank
- #9784
- State rank
- #512 of 540 in MI
Livability — Warren
- Score
- 74/100
- State rank
- #171
- US rank
- #4491
Category grades
Schools grade is shown separately in the Schools card above.
Census & demographics
- Census place
- Warren, MI
- County
- Macomb County · 638,552 people
- City population
- 114,937
- Metro
- Detroit-Warren-Dearborn, MI
- Population (ZIP)
- 30,696
- Household income
- $54,230
- Rent vs Own
- Severe rent burden
- 1296.0
Population outlook (Macomb County) Hauer SSP2
- Today (2025)
- 925,296 people
- By 2030
- 948,226 · +2.5%
- By 2040
- 983,961 · +6.3%
- By 2050
- 1,010,200 · +9.2%
- By 2075
- 1,076,222 · +16.3%
- By 2100
- 1,077,065 · +16.4%
Race, ethnicity, and origin ACS 2023
- Neighborhood character
- Diverse neighborhood (Simpson 0.68)
- Race & ethnicity
- White 47% Black 25% Asian 19% Two or more races 5% Hispanic / Latino 3% Native American 2%
- Common ancestry
- Romanian 7% Lithuanian 2% Slovak 1%
- Foreign-born
- 16% · Canada
- Languages at home
- 77% English-only · Other Indo-European 14% Other Asian/Pacific 3% Russian/Polish/Slavic 2%
Political lean MEDSL · Macomb
- 2024 margin
- R (+13.7) · D 42.2% · R 55.9% · Other 1.9%
- 2008→2024 swing
- -22.3pp toward R · 2008: 8.6pp · 2024: -13.7pp
- All cycles
- 2024: R+13.7 2020: R+8.1 2016: R+11.6 2012: D+4.0 2008: D+8.6
Not yet ingested
- Civics
- —
Market trends
- HPI YoY
- ▼ -199.66%
- Current HPI
- 177.9273
- Rent YoY
- ▲ 2.35%
- Metro
- Detroit-Warren-Dearborn, MI
- State GDP YoY
- ▲ 1.37%
- F500 in state
- 28
Industry mix (Fortune 500 HQ in MI)
| Industry | F500 HQs | Revenue |
|---|---|---|
| Automotive Parts | 3 | $48B |
|
||
| Automotive | 2 | $372B |
|
||
| Chemicals | 1 | $45B |
|
||
| Automotive Retail | 1 | $29B |
|
||
| Healthcare / Medical Devices | 1 | $23B |
|
||
| Automotive Technology | 1 | $20B |
|
||
Price history
-96.8% since first listed20 events — show timeline
- 2025-08-17 Rental Removed $1,250 REALSOURCE
- 2025-08-13 Rental Removed $1,300 RENTSPREE
- 2025-08-10 Listed for Rent $1,300 RENTSPREE
- 2025-07-18 Price Changed $1,275 REALSOURCE
- 2025-07-02 Listed for Rent $1,300 REALSOURCE
- 2024-12-17 Pending — REALCOMP
- 2023-10-23 Sold (Public Records) $80,000 Public Records
- 2023-08-31 Pending — MiRealSource-MiMLS
- 2023-08-31 Pending — REALCOMP
- 2023-08-10 Listed $79,999 MiRealSource-MiMLS
- 2023-08-10 Listed $79,999 REALCOMP
- 2018-02-22 Listing Removed — REALCOMP
- 2018-02-19 Pending — MiRealSource-MiMLS
- 2018-02-19 Pending — REALCOMP
- 2018-02-19 Listing Removed — MiRealSource-MiMLS
- 2017-12-07 Listed $20,000 MiRealSource-MiMLS
- 2017-12-07 Listed $20,000 REALCOMP
- 2013-01-19 Sold (MLS) $3,650 REALCOMP
- 2012-07-18 Listed $3,650 REALCOMP
- 1995-11-03 Sold (Public Records) $38,900 Public Records
Property tax history
+9.6%/yrLatest (2025): $2,790 · +2.6% YoY. Source: county tax records.
Cash-flow waterfall
monthlySold comps — $/sqft
last 12 mo · ≤1 miLoading sold comps…