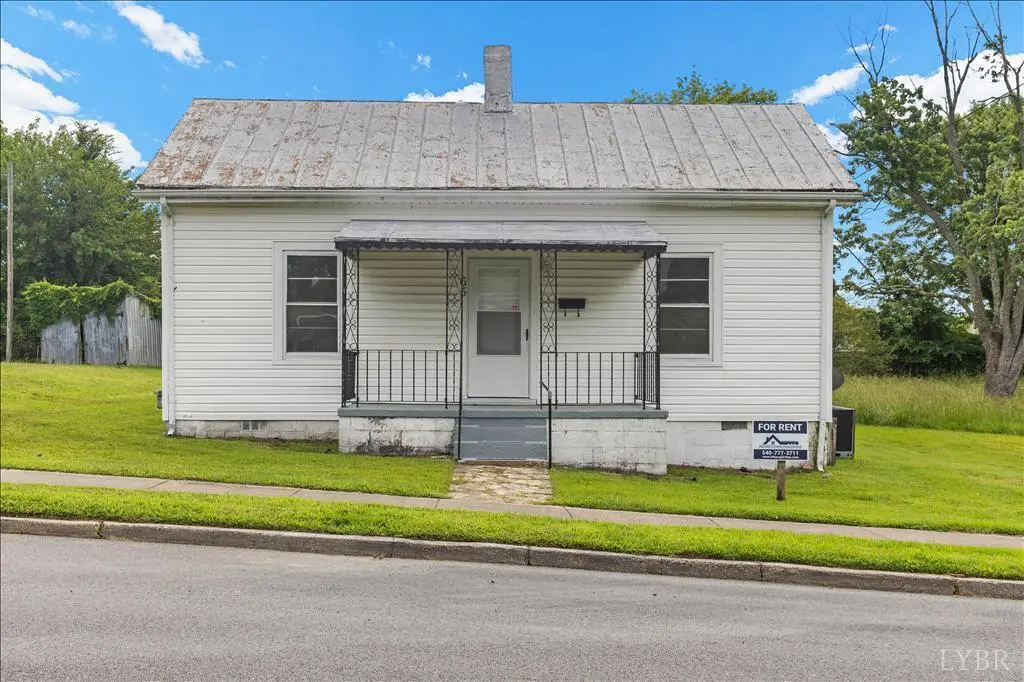
65 Glen Oak Dr · Danville, VA
Flood risk 1/10 · Minimal
- FEMA flood zone
- X (unshaded)
- Chance of flooding over 30 yrs
- 0.0%
- Est. flood insurance / yr
- $507 – $1,088
Fire risk 1/10 · Minimal
- Est. fire insurance / yr
- $666 – $1,236
Heat risk 6/10 · Moderate
- Hot days now (above 104°F)
- 7 days/yr
- Hot days in 30 yrs
- 18 days/yr
Wind risk 4/10 · Minor
- Chance of severe wind over 30 yrs
- 9.0%
Air-quality risk 2/10 · Minimal
- Unhealthy air days now
- 0 days/yr
- Unhealthy air days in 30 yrs
- 1 days/yr
Risk factors via First Street. Map © Google.
Why this score? — see what drove the C grade
The composite is a weighted blend of 9 inputs, each scored 0–100. Each bar is that input's sub-score; the figure is the points it added to the 100-point composite (weight × sub-score).
- Cash flow +25.2/30.0
- DSCR +8.3/10.0
- ARV discount +8.0/15.0
- 1% rule +5.4/10.0
- Livability +3.9/5.0
- Schools +3.0/10.0
- Rent growth +2.5/5.0
- Condition / age +2.5/5.0
- Appreciation +0.0/10.0
$105,000
🖨 Deal sheet (PDF) 📄 Offer letter ✓ Due diligence
Listing remarks MLS
Come fall in love with your next home located at 65 Glen Oak Dr. This well cared for and recently updated home features 2 bedrooms and 1 full bath in 1058sqft of living space. Set on a quiet lot this little charmer has all the makings of a great first or forever home. Recent updates include fresh paint throughout, newer appliances, newer LVP & tile flooring throughout most spaces. Each of the large bedrooms also has a ceiling fan and plenty of closet space. The one central bathroom is big and features a tub/shower combo as well as lots of counter and cabinet space to house all your personal items. The large kitchen will have you cooking up a quality meal in no time. The outdoor areas of this home allow you to park your vehicles, have a garden, build a playset or just enjoy the large lot anyway youd like. This is one not to be missed, come see it today! Can also be purchased as part of a 2 pack rental portfolio for those savvy buyers & hold investors! Sold as-is, where-is.
Key facts
- Newer appliances
- Newer lvp flooring
- Large kitchen
Tags
Neighborhood map
What this means for you Summary
Snapshot
- This is a 2-bed/1.0-bath single-family listed at $105k.
Deal economics
- At list price, monthly cash flow is $236 ($3k/yr) — positive.
- The deal already cash-flows at list — no discount required.
- Meets the 1% rule at list price ($1k rent vs $105k).
- Recommended offer: $92k (12.0% below list) — sets the bar for market timing.
- Cap rate 9.0% vs local median 5.2% in Danville — top-decile yield for the area; either an underpriced asset or a hidden risk that comps aren't pricing in. Stress-test before assuming the spread holds.
Location & tenants
- Location reads 77/100 on livability (#91 in VA, #2,952 nationally) — a middle-class / working-renter tenant base. Strengths: cost of living A+, housing A+, health & safety A+; Watch: amenities D+, crime D-, commute F.
- Danville City Public School District (town): math 30% / reading 44% proficiency, ranked #128 of 131 in VA (top 98%) — families likely to look elsewhere, expect single-tenant / working-renter base with shorter leases; 71% free/reduced lunch — lower-income household profile, screen leases tightly.
- Zoned schools: Schoolfield Elementary (math 22% / reading 40%, grade F, #1,004 of 1,108 statewide, top 91%, 500 students, 98% FRL); O. Trent Bonner Middle (math 33% / reading 53%, grade D-, #288 of 342 statewide, top 85%, 678 students, 91% FRL); George Washington High (math 44% / reading 54%, grade D, #300 of 319 statewide, top 94%, 1,309 students, 88% FRL) — zoned schools average 92% FRL vs 71% district-wide (21 pts higher); higher-poverty schools than district average — tighter screening recommended.
- Market conditions: 249 active listings in the ZIP; 12 comparable units currently listed for rent nearby; rentals lingering (median 45d on market — plan ~5-8 weeks vacancy on turnover, expect pricing pressure); 50% of comp listings sitting > 30 days — soft ceiling on asking rent; 54 units permitted in Danville city in 2024 (40 in 5+ unit buildings).
Forward outlook
- Local home prices are declining (-3.0%/yr); year-one equity from $726 of loan paydown is wiped out by about $3k of value loss. Plan a longer hold.
- Danville County population projected to shrink 7% by 2050 — rents likely to lag national; underwrite the cash flow, not the appreciation.
Negotiation context
- It's been on market 165 days — a 12% lower offer ($92k) is reasonable based on typical stale-listing flexibility.
- 5 sale attempts since 2y ago with the ask held roughly flat each time — persistent listings suggest the price (not the market) is what's stuck; bring a comps-based counter.
- Current owner paid $82k; 27% above their basis — modest negotiation headroom, anchor on the comps not their cost.
Risks & watch-outs
- Watch-outs: built in 1940 — expect roof / HVAC / electrical / plumbing capex.
- Climate carrying-cost: extreme-heat days projected 7→18/yr by 2055 (HVAC capex compounding) — expect insurance premiums to compound above CPI over the hold.
Questions for the listing agent
- It's been on market 165 days. Have you received any prior offers? Is the seller open to a 12% concession, seller financing, or rate buy-down credit?
- Built in 1940 — when were the roof, HVAC, electrical panel, plumbing, and water heater last replaced?
- Why hasn't it sold? Are there any deal-killer items the seller is aware of (foundation, flood, title, zoning, code violations)?
- Is there a deadline driving the sale (1031 exchange, divorce, estate, relocation)? That informs how much negotiation room exists.
- Schools are B-rated — typically a magnet for longer-tenancy family renters. What's the average tenant stay here, and is there a school-zone premium baked into asking?
- Crime grade is D in this area — have there been break-ins, vandalism, or insurance claims at this property in the last 3 years? What carrier currently insures it and at what premium?
- What's the average days-on-market for RENTAL listings here right now (not sales)? A rising rental-DOM trend means longer vacancies and softer asking-rent achievability than the comps imply.
- What's the recent tenant-quality profile in this submarket — average credit score on applications, eviction rate, late-payment / NSF rate, and stable-employment percentage? A property-management company in the area should have these aggregated.
- How much new for-sale + rental construction is in the pipeline within 1–3 miles? Heavy new supply typically softens prices + rents 12–24 months out; constrained supply supports both.
Investment metrics
- 1% rule
- 1.04% ✓
- Cap rate
- 8.99%
- Cash-on-cash
- 9.62%
- DSCR
- 1.43
- GRM
- 8.0
CMA / ARV
- ARV (median comp)
- $106,172
- List price
- $105,000
- Delta
- -1.10%
- Verdict
- FAIR
- Comps
- 20 within 1.0 mi
Show comp detail 12 sales within ~0.75 mi
| Address | Dist | Beds/Ba | Sqft | Sold | Price | $/sf | Match |
|---|---|---|---|---|---|---|---|
| 142 Stokesland Ave | 0.25mi | 2/1.0 | 1,084 (+2%) | 4mo | $138,000 | $127 | 81 |
| 53 Fairfield Ave | 0.42mi | 2/1.0 | 996 (-6%) | 2mo | $108,000 | $108 | 68 |
| 27 Still St | 0.41mi | 3/1.0 (+1) | 1,069 (+1%) | 7mo | $132,000 | $123 | 68 |
| 46 Baltimore Ave | 0.48mi | 2/1.0 | 1,000 (-6%) | 1mo | $80,000 | $80 | 68 |
| 89 Schoolfield Dr | 0.29mi | 3/1.0 (+1) | 1,207 (+14%) | 1mo | $90,000 | $75 | 57 |
| 312 Arlington Pl | 0.72mi | 3/2.0 (+1) | 1,070 (+1%) | 0mo | $136,000 | $127 | 55 |
| 37 Baltimore Ave | 0.51mi | 2/1.0 | 924 (-13%) | 1mo | $45,000 | $49 | 54 |
| 54 Selma Ave | 0.64mi | 2/1.0 | 960 (-9%) | 2mo | $115,000 | $120 | 53 |
| 790 Holland Rd | 0.69mi | 3/2.0 (+1) | 1,107 (+5%) | 1mo | $12,000 | $11 | 50 |
| 148 Park Ave | 0.72mi | 2/1.0 | 960 (-9%) | 2mo | $126,000 | $131 | 49 |
| 103 Fairway Dr | 0.71mi | 3/2.5 (+1) | 1,092 (+3%) | 4mo | $185,000 | $169 | 47 |
| 185 Graymont Pl | 0.63mi | 3/2.0 (+1) | 1,176 (+11%) | 6mo | $195,000 | $166 | 38 |
Match score weights: distance 35% · size 25% · config 20% · recency 20%. Top-matched comps best support the ARV.
Projected returns pro-forma
-3.0% appreciation · 3.0% rent growth · sell at horizon
- IRR
- -1.9%
- Equity multiple
- 0.93×
- Total profit
- $-2,056
- Equity at exit
- $15,656
- IRR
- 7.8%
- Equity multiple
- 1.59×
- Total profit
- $17,343
- Equity at exit
- $9,078
Cash invested: $29,400 (down + closing). Projections, not guarantees.
Landlord ↔ Tenant lean methodology
- Overall (STATE)
- 55 Moderately Landlord-Leaning
- State Virginia
- 55 Moderately Landlord-Leaning · D+2
- County
- — inherits STATE
- City
- — inherits STATE
ZIP-level market 24541
- Home prices YoY
- -17.1%
- Active inventory
- 249
- Price-to-rent
- 8.0×
Monthly cashflow live
- Estimated rent
- $1,088 high interval (Pro) →
- Mortgage (P&I)
- −$551
- Tax from tax record
- −$29 /mo · $352/yr
- Insurance
- −$44
- HOA
- −$0
- Vacancy / Maint / Mgmt
- −$228
- Net cashflow
- $236
Break-even live
Sensitivity live
| Price | -10% $295 | -5% $265 | +0% $236 | +5% $206 | +10% $176 |
|---|---|---|---|---|---|
| Rent | -10% $150 | -5% $193 | +0% $236 | +5% $279 | +10% $322 |
| Rate | -1.0pp $288 | -0.5pp $262 | base $236 | +0.5pp $208 | +1.0pp $181 |
UW: 25.0% down · 7.5% · 30yr · 1.5% tax · 5.0% vac · 8.0% maint · 8.0% mgmt
Financing live
Cash to close
- Down payment
- $26,250
- Closing costs
- $3,150
- Reserves months
- —
- Total cash needed
- —
Loan-product check · same deal, 3 products live
Conventional
25% down · 7.5% · 30yr
- Down + closing
- —
- Monthly P&I
- —
- Monthly cashflow
- —
- DSCR
- —
- Eligible?
- —
Personal DTI + credit; lowest rate.
DSCR
20% down · 8.5% · 30yr
- Down + closing
- —
- Monthly P&I
- —
- Monthly cashflow
- —
- DSCR
- —
- Eligible?
- —
No personal income docs; deal must DSCR.
Hard money
10% down · 12.0% · 12mo
- Down + closing
- —
- Monthly P&I
- —
- Monthly cashflow
- —
- DSCR
- —
- Eligible?
- —
Short-term bridge; refi at stabilization.
Rent comps 12 comps
| Address | Beds | Baths | Sqft | Rent | $/sqft | DOM | Units | Dist |
|---|---|---|---|---|---|---|---|---|
| 66 Carlson Ave Danville, VA | 2.0 | 1.0 | 966 | $1,000 | $1.04 | 45d | 1 | 0.23mi |
| 107 Baltimore Ave Danville, VA | 2.0 | 1.0 | 902 | $914 | $1.01 | 22d | 1 | 0.49mi |
| 721 Chatham Ave Unit A Danville, VA | 3.0 | 1.0 | 950 | $1,350 | $1.42 | 15d | 1 | 0.85mi |
| 732 Hughes St Danville, VA | 2.0 | 1.0 | 900 | $1,800 | $2.00 | 45d | 1 | 0.86mi |
| 380 Juless St Danville, VA | 2.0 | 1.0 | 780 | $775 | $0.99 | 45d | 1 | 1.04mi |
| 378 Juless St Danville, VA | 2.0 | 1.0 | 780 | $775 | $0.99 | 45d | 1 | 1.05mi |
| 181 Banner St Danville, VA | 3.0 | 1.0 | 1176 | $1,389 | $1.18 | 45d | 1 | 1.07mi |
| 317 Dudley St Danville, VA | 2.0 | 1.0 | 840 | $914 | $1.09 | 22d | 1 | 1.28mi |
| 245 College Park Dr Danville, VA | 2.0 | 1.0 | 782 | $775 | $0.99 | 22d | 1 | 1.39mi |
| 671 Park Ave Danville, VA | 2.0 | 1.0 | 942 | $1,100 | $1.17 | 45d | 1 | 1.40mi |
| 128 Charles St Unit 5 Danville, VA | 2.0 | 1.0 | 800 | $750 | $0.94 | 22d | 1 | 1.42mi |
| 111 Willoughby Pl Danville, VA | 2.0 | 1.0 | 700 | $775 | $1.11 | 22d | 1 | 1.48mi |
Listing history 32 events
-
2026-06-21days on market $105,000 Active 165 DOM
-
2026-06-19days on market $105,000 Active 163 DOM
-
2026-06-18days on market $105,000 Active 162 DOM
-
2026-06-17days on market $105,000 Active 161 DOM
-
2026-06-16days on market $105,000 Active 160 DOM
-
2026-06-15days on market $105,000 Active 159 DOM
-
2026-06-14days on market $105,000 Active 157 DOM
-
2026-06-13days on market $105,000 Active 156 DOM
-
2026-06-10days on market $105,000 Active 154 DOM
-
2026-06-09days on market $105,000 Active 153 DOM
-
2026-06-08days on market $105,000 Active 152 DOM
-
2026-06-07days on market $105,000 Active 151 DOM
-
2026-06-05days on market $105,000 Active 148 DOM
-
2026-06-02days on market $105,000 Active 146 DOM
-
2026-06-01days on market $105,000 Active 145 DOM
-
2026-05-31days on market $105,000 Active 144 DOM
-
2026-05-30days on market $105,000 Active 143 DOM
-
2026-01-07$105,000 Active 998-char remark
Show marketing remark (998 chars)
Come fall in love with your next home located at 65 Glen Oak Dr. This well cared for and recently updated home features 2 bedrooms and 1 full bath in 1058sqft of living space. Set on a quiet lot this little charmer has all the makings of a great first or forever home. Recent updates include fresh paint throughout, newer appliances, newer LVP & tile flooring throughout most spaces. Each of the large bedrooms also has a ceiling fan and plenty of closet space. The one central bathroom is big and features a tub/shower combo as well as lots of counter and cabinet space to house all your personal items. The large kitchen will have you cooking up a quality meal in no time. The outdoor areas of this home allow you to park your vehicles, have a garden, build a playset or just enjoy the large lot anyway youd like. This is one not to be missed, come see it today! Can also be purchased as part of a 2 pack rental portfolio for those savvy buyers & hold investors! Sold as-is, where-is.
-
2025-09-01historical $1,095
-
2025-05-28$1,095
-
2025-05-28historical $1,095
-
2025-05-15price $1,095
-
2025-04-14$1,150
-
2025-02-18soldstatus $82,400
-
2025-02-13soldstatus $82,400 Closed 201-char remark
Show marketing remark (201 chars)
CEASARS CASINO JUST AROUND THE CORNER. EXCELENT INVESTMENT OPPORTUNITY TENANT OCCUPIED. SOLD "AS IS" CONDITION. REASONABLE OFFERS ONLY!! APPOINTMENT MANDATORY FOR SHOWINGS WITH 48 HR NOTICE.
-
2024-12-21historical Active Under Contract 201-char remark
Show marketing remark (201 chars)
CEASARS CASINO JUST AROUND THE CORNER. EXCELENT INVESTMENT OPPORTUNITY TENANT OCCUPIED. SOLD "AS IS" CONDITION. REASONABLE OFFERS ONLY!! APPOINTMENT MANDATORY FOR SHOWINGS WITH 48 HR NOTICE.
-
2024-11-14price $89,900 201-char remark
Show marketing remark (201 chars)
CEASARS CASINO JUST AROUND THE CORNER. EXCELENT INVESTMENT OPPORTUNITY TENANT OCCUPIED. SOLD "AS IS" CONDITION. REASONABLE OFFERS ONLY!! APPOINTMENT MANDATORY FOR SHOWINGS WITH 48 HR NOTICE.
-
2024-09-08price $1,250,000
-
2024-09-04$99,900 Active 201-char remark
Show marketing remark (201 chars)
CEASARS CASINO JUST AROUND THE CORNER. EXCELENT INVESTMENT OPPORTUNITY TENANT OCCUPIED. SOLD "AS IS" CONDITION. REASONABLE OFFERS ONLY!! APPOINTMENT MANDATORY FOR SHOWINGS WITH 48 HR NOTICE.
-
2024-08-26price $99,900
-
2024-07-08$1,395,000 Active
-
2001-02-20soldstatus $30,000
ⓘ Source: listings_history table (triggers on properties + properties_extension) + one-shot
backfill from property_details.listing_events for pre-trigger history.
Tax reassessment forecast VA · Resets to sale price
- Current annual tax
- $352 · $29/mo
- Projected year-2 tax
- $861 · $72/mo
- Expected delta
- +$509/yr (+$42/mo · 144.7%)
ⓘ Screening estimate from a state-policy table — verify with the county assessor before closing.
Climate risk First Street
- Flood 1/10 Low FEMA zone X (unshaded) · 0% chance over 30 yrs
- Wildfire 1/10 Low
- Heat 6/10 Major 7 d/yr ≥104°F today · 18 d/yr by 30 yrs out
- Wind 4/10 Moderate 9% chance of damaging wind over 30 yrs
- Air quality 2/10 Low 0 unhealthy d/yr today · 1 by 30 yrs out
Nearby sold comps map
Loading sold comps map…
Walkable amenities ~0.75 mi
Loading nearby amenities…
Taxation est. · year 1
- Rental income
- $13,053
- − Mortgage interest
- −$5,882
- − Property taxes
- −$352
- − Insurance
- −$525
- − Repairs & maintenance
- −$1,044
- − Management
- −$1,044
- − Depreciation
- −$3,055
- Taxable income
- $1,151
- Est. tax owed @ 24.0%
- −$276
- After-tax cash flow
- $2,551/yr
For passive investors: Depreciation is non-cash, so a rental often shows a tax loss while cash-flowing — sheltering income. Rental losses are passive: they offset passive income freely, and up to $25,000/yr can offset ordinary (W-2) income if you actively participate and your MAGI is under $100k (phasing out to $0 by $150k); unused losses carry forward. On sale, claimed depreciation is recaptured at up to 25%, and gains may owe capital-gains tax (a 1031 exchange can defer both). Figures are a year-1 estimate at your 24.0% rate — not tax advice; consult a CPA.
Schools (NCES district)
- District
- Danville City Public School District
- NCES district ID
- 5101110
- Math proficiency
- 30% ▼ -22.00%
- Reading proficiency
- 44% ▼ -8.00%
- Median HH income
- $31,952
- Composite
- 30.23/100
- National rank
- #6298
- State rank
- #128 of 131 in VA
Livability — Danville
- Score
- 77/100
- State rank
- #91
- US rank
- #2952
Category grades
Schools grade is shown separately in the Schools card above.
Census & demographics
- Census place
- Danville, VA
- County
- Danville City · 59,055 people
- City population
- 59,055
- Metro
- Danville, VA
- Population (ZIP)
- 28,042
- Household income
- $51,427
- Rent vs Own
- Severe rent burden
- 1399.0
Population outlook (Danville County) Hauer SSP2
- Today (2025)
- 40,989 people
- By 2030
- 40,432 · -1.4%
- By 2040
- 39,255 · -4.2%
- By 2050
- 38,035 · -7.2%
- By 2075
- 35,612 · -13.1%
- By 2100
- 30,365 · -25.9%
Race, ethnicity, and origin ACS 2023
- Neighborhood character
- Diverse neighborhood (Simpson 0.59)
- Race & ethnicity
- White 50% Black 39% Two or more races 7% Hispanic / Latino 5% Asian 2%
- Common ancestry
- Slovak 2% Serbian 2% Lithuanian 1%
- Foreign-born
- 4% · Canada, Dominican Republic
- Languages at home
- 95% English-only · Spanish 4% Other Indo-European 1%
Political lean MEDSL · Danville
- 2024 margin
- Strong D (+21.1) · D 60.1% · R 39.0%
- 2008→2024 swing
- +1.9pp toward D · 2008: 19.1pp · 2024: 21.1pp
- All cycles
- 2024: D+21.1 2020: D+22.1 2016: D+19.9 2012: D+22.1 2008: D+19.1
Not yet ingested
- Civics
- —
Market trends
- HPI YoY
- ▼ -49.28%
- Current HPI
- 238.5992
- Rent YoY
- —
- Metro
- Danville, VA
- State GDP YoY
- ▲ 2.40%
- F500 in state
- 50
Industry mix (Fortune 500 HQ in VA)
| Industry | F500 HQs | Revenue |
|---|---|---|
| Aerospace / Defense | 4 | $236B |
|
||
| Technology / Defense | 3 | $32B |
|
||
| Financial Services | 2 | $176B |
|
||
| Utilities | 2 | $27B |
|
||
| Insurance | 2 | $25B |
|
||
| Technology | 2 | $15B |
|
||
Price history
+250.0% since first listed15 events — show timeline
- 2026-01-07 Listed $105,000 LMLS
- 2025-09-01 Rental Removed $1,095 MLSRV
- 2025-05-28 Listed for Rent $1,095 MLSRV
- 2025-05-28 Rental Removed $1,095 MLSRV
- 2025-05-15 Price Changed $1,095 MLSRV
- 2025-04-14 Listed for Rent $1,150 MLSRV
- 2025-02-18 Sold (Public Records) $82,400 Public Records
- 2025-02-13 Sold (MLS) $82,400 DRRAR
- 2024-12-21 Contingent — DRRAR
- 2024-11-14 Price Changed $89,900 DRRAR
- 2024-09-08 Price Changed $1,250,000 DRRAR
- 2024-09-04 Listed $99,900 DRRAR
- 2024-08-26 Price Changed $99,900 DRRAR
- 2024-07-08 Listed $1,395,000 DRRAR
- 2001-02-20 Sold (Public Records) $30,000 Public Records
Property tax history
+4.9%/yrLatest (2025): $352 · +0.0% YoY. Source: county tax records.
Cash-flow waterfall
monthlySold comps — $/sqft
last 12 mo · ≤1 miLoading sold comps…