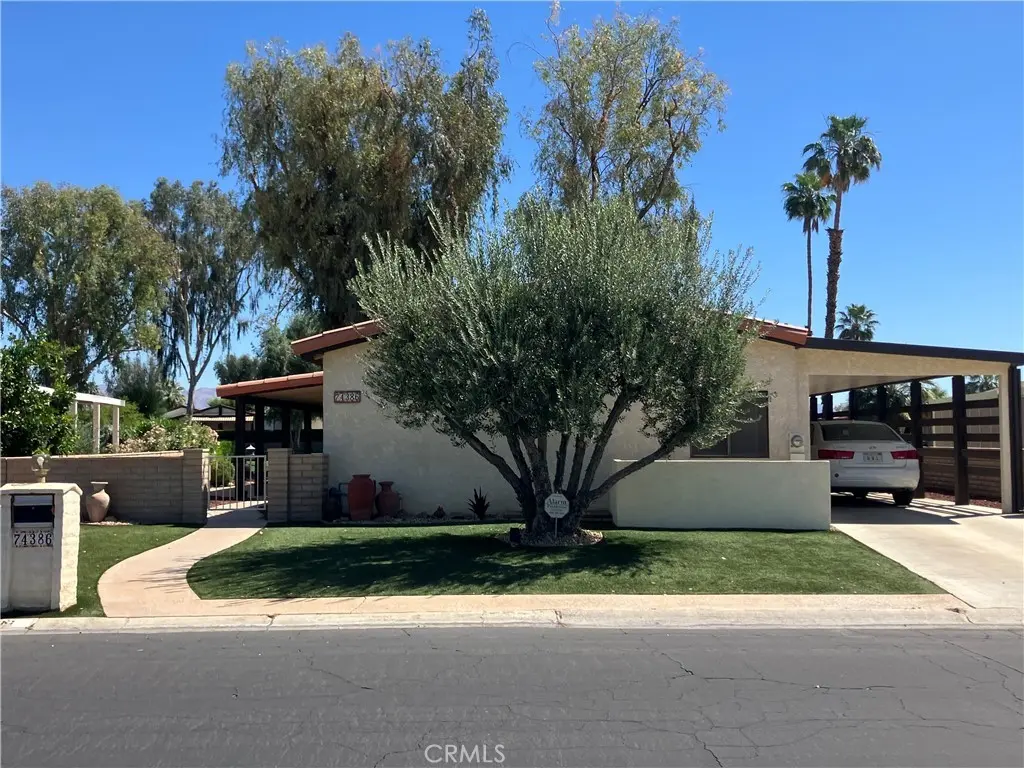
74386 Mercury Cir E · Palm Desert, CA
Flood risk 1/10 · Minimal
- FEMA flood zone
- X (unshaded)
- Chance of flooding over 30 yrs
- 0.0%
- Est. flood insurance / yr
- $507 – $1,088
Fire risk 1/10 · Minimal
- Est. fire insurance / yr
- $659 – $1,223
Heat risk 9/10 · Severe
- Hot days now (above 114°F)
- 7 days/yr
- Hot days in 30 yrs
- 19 days/yr
Wind risk 1/10 · Minimal
- Chance of severe wind over 30 yrs
- —
Air-quality risk 4/10 · Minor
- Unhealthy air days now
- 5 days/yr
- Unhealthy air days in 30 yrs
- 6 days/yr
Risk factors via First Street. Map © Google.
Why this score? — see what drove the C grade
The composite is a weighted blend of 9 inputs, each scored 0–100. Each bar is that input's sub-score; the figure is the points it added to the 100-point composite (weight × sub-score).
- Cash flow +22.5/30.0
- ARV discount +7.7/15.0
- 1% rule +7.2/10.0
- DSCR +7.2/10.0
- Schools +3.8/10.0
- Rent growth +2.9/5.0
- Livability +2.6/5.0
- Condition / age +2.5/5.0
- Appreciation +0.0/10.0
$289,900
🖨 Deal sheet (PDF) 📄 Offer letter ✓ Due diligence
Listing remarks
SPECTACULAR PRICE FOR A MOVE-IN READY HOME ON THE GOLF COURSE! LOCATION, LOCATION, GOLF, VIEWS! Live on the golf course in this beautiful gated community! This home has been meticulously maintained and is move-in ready. Enjoy spectacular views of the golf course and surrounding mountains directly from your sofa or outdoor patio. The home features two bedrooms and two full bathrooms, a formal living and dining room with vaulted ceilings, a separate family room, individual laundry room and a kitchen with gas appliances. New flooring has been installed in the family room and the bedrooms have ceiling fans. Parking is offered under a covered carport and there is plenty of extra storage in the o
Key facts
- 4,356 sq ft lot
- 2 parking spots
- Community pool
Property features AI
Finance
- Other: Located in a community with golf course, dog park and public park
- HOA & community: Part of Portola Country Club HOA; Monthly association fee of $455; Senior community; Association amenities include: spa, pool, clubhouse, golf, tennis, pickleball, billiard room, gym/exercise room, dog park, picnic area, common RV parking, controlled access, maintenance of grounds, cable TV, trash service, recreational multipurpose room, pets permitted
Exterior
- Parking: Two parking spaces total; Two carport spaces; Driveway (concrete)
- Security: Gated community with automatic gate; Controlled access (association)
- Utilities: Public sewer; District/public water; Natural gas connected; Electricity connected; Water connected; Sewer connected; Cable connected; Telephone available in street; Underground utilities
- Home design: Mobile home remains (24' x 60'); Turnkey condition; One story; Access via city streets on a paved road; Tile roof; Stucco exterior; Has view; Located in Portola Country Club
- Construction: Stucco construction; Tile roof; One shed on the property; Year built source: assessor
- Exterior features: Covered concrete patio; Patio; In-ground heated community spa (association); Community pool (in-ground, fenced, heated); Shed; On golf course; Level with street; Landscaped front yard with desert landscaping; Sprinkler system
Interior
- Kitchen: Gas cooktop; Gas oven; Double oven; Range/stove hood; Microwave; Dishwasher; Garbage disposal; Refrigerator; Corian counters; Pots & pan drawers; Kitchen open to family room
- Bedrooms: Primary bedroom on main floor; All bedrooms located on the main floor
- Bathrooms: Two full bathrooms; Soaking tub; Walk-in shower; Separate tub and shower; Bathtub; Double sinks in primary bath; Vanity area; Main floor full bath; Shower
- Heating & cooling: Central cooling; Central furnace; Fireplace
- Interior features: Ceiling fan; One-level living; Front door or carport entry; Formal entry; Walk-in closet; Primary bedroom on main floor; All bedrooms on main floor; Separate family room; Living room; Family room; Primary bathroom; Laundry room
- Laundry & utility: Washer included; Dryer included; Washer and dryer hook-ups for gas and electric; Laundry in an individual room (inside)
Neighborhood map
What this means for you Summary
Snapshot
- This is a 2-bed/2.0-bath manufactured listed at $290k.
Deal economics
- At list price, monthly cash flow is $488 ($6k/yr) — positive.
- The deal already cash-flows at list — no discount required.
- Meets the 1% rule at list price ($4k rent vs $290k).
- Recommended offer: $286k (1.5% below list) — sets the bar for market timing.
- Cap rate 8.3% vs local median 3.4% in Palm Desert — top-decile yield for the area; either an underpriced asset or a hidden risk that comps aren't pricing in. Stress-test before assuming the spread holds.
Location & tenants
- Location reads 51/100 on livability (#1,050 in CA) — a working-class tenant base; expect higher turnover. Strengths: employment B+, housing B; Watch: crime D, amenities F, commute F.
- Desert Sands Unified (suburban): math 31% / reading 56% proficiency, ranked #199 of 517 in CA (top 38%) — families likely to look elsewhere, expect single-tenant / working-renter base with shorter leases.
- Zoned schools: James Earl Carter Elementary (516 students, 53% FRL); Colonel Mitchell Paige Middle (math 10% / reading 10%, grade F, #474 of 498 statewide, top 99%, 436 students, 74% FRL); Palm Desert High (math 42% / reading 67%, grade C-, #256 of 1,170 statewide, top 24%, 2,050 students, 57% FRL).
- Market conditions: Rents rising (+1.6%/yr); 551 active listings in the ZIP; 40 comparable units currently listed for rent nearby; rentals lingering (median 45d on market — plan ~5-8 weeks vacancy on turnover, expect pricing pressure); 58% of comp listings sitting > 30 days — soft ceiling on asking rent; 9,195 units permitted in Riverside County in 2024 (1,512 in 5+ unit buildings).
- At $3,547/mo this rent would consume 61% of the median local household income ($70k/yr) (locally 1734% of renters already pay >50% of income on rent) — very limited rent-growth headroom before tenants either downsize or default.
Forward outlook
- Local home prices are declining (-3.0%/yr); year-one equity from $2k of loan paydown is wiped out by about $9k of value loss. Plan a longer hold.
- Riverside County population projected at +22% by 2050 — long-run rental-demand tailwind backs the buy-and-hold thesis.
Negotiation context
- It's been on market 27 days — a 2% lower offer ($286k) is reasonable based on typical stale-listing flexibility.
Risks & watch-outs
- Climate carrying-cost: extreme-heat days projected 7→19/yr by 2055 (HVAC capex compounding) — expect insurance premiums to compound above CPI over the hold.
Questions for the listing agent
- What does the HOA fee cover, when was the last increase, and are there any pending special assessments or reserve-fund shortfalls?
- Is there a deadline driving the sale (1031 exchange, divorce, estate, relocation)? That informs how much negotiation room exists.
- Schools are A-rated — typically a magnet for longer-tenancy family renters. What's the average tenant stay here, and is there a school-zone premium baked into asking?
- Crime grade is D in this area — have there been break-ins, vandalism, or insurance claims at this property in the last 3 years? What carrier currently insures it and at what premium?
- What's the average days-on-market for RENTAL listings here right now (not sales)? A rising rental-DOM trend means longer vacancies and softer asking-rent achievability than the comps imply.
- What's the recent tenant-quality profile in this submarket — average credit score on applications, eviction rate, late-payment / NSF rate, and stable-employment percentage? A property-management company in the area should have these aggregated.
- How much new for-sale + rental construction is in the pipeline within 1–3 miles? Heavy new supply typically softens prices + rents 12–24 months out; constrained supply supports both.
Investment metrics
- 1% rule
- 1.22% ✓
- Cap rate
- 8.31%
- Cash-on-cash
- 7.22%
- DSCR
- 1.32
- GRM
- 6.8
CMA / ARV
- ARV (on-the-fly)
- $291,336
- Comps found
- 12
Show comp detail 12 sales within ~0.75 mi
| Address | Dist | Beds/Ba | Sqft | Sold | Price | $/sf | Match |
|---|---|---|---|---|---|---|---|
| 74578 Zircon Cir E | 0.09mi | 2/2.0 | 1,542 (+5%) | 0mo | $250,000 | $162 | 87 |
| 74596 Azurite Cir E | 0.13mi | 2/2.0 | 1,440 (-2%) | 6mo | $201,600 | $140 | 86 |
| 42543 Granite Pl | 0.09mi | 2/2.0 | 1,440 (-2%) | 10mo | $345,000 | $240 | 85 |
| 42580 Sutters Mill Rd | 0.14mi | 2/2.0 | 1,440 (-2%) | 9mo | $280,000 | $194 | 84 |
| 42651 Vanadium Pl | 0.22mi | 2/2.0 | 1,440 (-2%) | 4mo | $290,000 | $201 | 83 |
| 42605 Vanadium | 0.21mi | 2/2.0 | 1,416 (-3%) | 2mo | $235,000 | $166 | 83 |
| 74072 Mercury Circle Cir W | 0.23mi | 2/2.0 | 1,440 (-2%) | 5mo | $222,000 | $154 | 82 |
| 42090 Diadomite Way | 0.19mi | 2/2.0 | 1,520 (+4%) | 7mo | $240,000 | $158 | 79 |
| 74592 Nevada Cir E | 0.17mi | 2/2.0 | 1,590 (+9%) | 2mo | $317,000 | $199 | 76 |
| 74411 Gary Ave. Ave | 0.20mi | 2/2.0 | 1,584 (+8%) | 5mo | $397,000 | $251 | 73 |
| 74240 Angels Camp Rd | 0.22mi | 2/2.0 | 1,584 (+8%) | 10mo | $347,000 | $219 | 67 |
| 74276 Zircon Cir E | 0.18mi | 3/2.0 (+1) | 1,664 (+14%) | 8mo | $405,000 | $243 | 57 |
Match score weights: distance 35% · size 25% · config 20% · recency 20%. Top-matched comps best support the ARV.
Projected returns pro-forma
-3.0% appreciation · 1.6% rent growth · sell at horizon
- IRR
- -7.0%
- Equity multiple
- 0.75×
- Total profit
- $-20,552
- Equity at exit
- $43,225
- IRR
- 0.7%
- Equity multiple
- 1.04×
- Total profit
- $3,493
- Equity at exit
- $25,065
Cash invested: $81,172 (down + closing). Projections, not guarantees.
Landlord ↔ Tenant lean methodology
- Overall (STATE)
- 18 Strongly Tenant-Friendly
- State California
- 18 Strongly Tenant-Friendly · D+13
- County
- — inherits STATE
- City
- — inherits STATE
ZIP-level market 92260
- Rents YoY
- 1.6%
- Active inventory
- 551
- Price-to-rent
- 6.8×
Monthly cashflow live
- Estimated rent
- $3,547 high interval (Pro) →
- Mortgage (P&I)
- −$1,520
- Tax from tax record
- −$217 /mo · $2,607/yr
- Insurance
- −$121
- HOA
- −$455
- Vacancy / Maint / Mgmt
- −$745
- Net cashflow
- $488
Break-even live
Sensitivity live
| Price | -10% $653 | -5% $570 | +0% $488 | +5% $406 | +10% $324 |
|---|---|---|---|---|---|
| Rent | -10% $208 | -5% $348 | +0% $488 | +5% $629 | +10% $769 |
| Rate | -1.0pp $634 | -0.5pp $562 | base $488 | +0.5pp $413 | +1.0pp $337 |
UW: 25.0% down · 7.5% · 30yr · 1.5% tax · 5.0% vac · 8.0% maint · 8.0% mgmt
Financing live
Cash to close
- Down payment
- $72,475
- Closing costs
- $8,697
- Reserves months
- —
- Total cash needed
- —
Loan-product check · same deal, 3 products live
Conventional
25% down · 7.5% · 30yr
- Down + closing
- —
- Monthly P&I
- —
- Monthly cashflow
- —
- DSCR
- —
- Eligible?
- —
Personal DTI + credit; lowest rate.
DSCR
20% down · 8.5% · 30yr
- Down + closing
- —
- Monthly P&I
- —
- Monthly cashflow
- —
- DSCR
- —
- Eligible?
- —
No personal income docs; deal must DSCR.
Hard money
10% down · 12.0% · 12mo
- Down + closing
- —
- Monthly P&I
- —
- Monthly cashflow
- —
- DSCR
- —
- Eligible?
- —
Short-term bridge; refi at stabilization.
Rent comps 40 comps
| Address | Beds | Baths | Sqft | Rent | $/sqft | DOM | Units | Dist |
|---|---|---|---|---|---|---|---|---|
| 74036 Mercury Cir W Palm Desert, CA | 2.0 | 2.0 | 1440 | $2,800 | $1.94 | 45d | 1 | 0.21mi |
| 74350 Magnesia Falls Dr Unit 1 Palm Desert, CA | 3.0 | 2.0 | 1200 | $2,595 | $2.16 | 12d | 1 | 0.25mi |
| 235 Via Rengo Palm Desert, CA | 2.0 | 2.0 | 1042 | $2,600 | $2.50 | 45d | 1 | 0.31mi |
| 255 Via Rengo Palm Desert, CA | 2.0 | 2.0 | 1122 | $2,700 | $2.41 | 45d | 1 | 0.33mi |
| 255 Via Rengo Palm Desert, CA | 2.0 | 2.0 | 1122 | $2,600 | $2.32 | 6d | 1 | 0.33mi |
| 74401 Hovley Lane East Palm Desert, CA | 1.0–3.0 | 1.0–2.0 | 1042 | $2,656 | $2.55 | 0d | 22 | 0.35mi |
| 82 Presidio Pl Palm Desert, CA | 3.0 | 2.0 | 1851 | $5,500 | $2.97 | 45d | 1 | 0.45mi |
| 92 Presidio Pl Palm Desert, CA | 3.0 | 2.0 | 1821 | $5,500 | $3.02 | 45d | 1 | 0.48mi |
| 181 Camino Arroyo S Palm Desert, CA | 3.0 | 2.0 | 1821 | $6,300 | $3.46 | 45d | 1 | 0.59mi |
| 289 Castellana N Palm Desert, CA | 2.0 | 2.0 | 1457 | $3,000 | $2.06 | 26d | 1 | 0.64mi |
| 42575 Cook St Palm Desert, CA | 2.0 | 2.0 | 1050 | $1,950 | $1.86 | 26d | 1 | 0.65mi |
| 39 Camino Arroyo Pl Palm Desert, CA | 2.0 | 2.0 | 1533 | $6,000 | $3.91 | 45d | 1 | 0.68mi |
| 43378 Martini Ct Unit B Palm Desert, CA | 2.0 | 2.0 | 1028 | $2,249 | $2.19 | 23d | 1 | 0.69mi |
| 432 S Sierra Madre Palm Desert, CA | 2.0 | 2.0 | 1584 | $5,300 | $3.35 | 45d | 1 | 0.72mi |
| 34934 Phyllis Jackson Ln Palm Desert, CA | 3.0 | 2.5 | 1600 | $3,400 | $2.12 | 20d | 1 | 0.73mi |
| 34931 Phyllis Jackson Ln Palm Desert, CA | 3.0 | 2.5 | 1600 | $3,375 | $2.11 | 20d | 1 | 0.73mi |
| 34946 Phyllis Jackson Ln Palm Desert, CA | 3.0 | 2.5 | 1600 | $3,400 | $2.12 | 20d | 1 | 0.73mi |
| 34921 Phyllis Jackson Ln Palm Desert, CA | 3.0 | 2.5 | 1600 | $3,375 | $2.11 | 20d | 1 | 0.73mi |
| 430 S Sierra Madre Palm Desert, CA | 2.0 | 2.0 | 1303 | $5,500 | $4.22 | 45d | 1 | 0.73mi |
| 259 Calle del Verano Palm Desert, CA | 2.0 | 2.0 | 1303 | $5,200 | $3.99 | 45d | 1 | 0.78mi |
| 257 Calle del Verano Palm Desert, CA | 2.0 | 2.0 | 1303 | $5,300 | $4.07 | 45d | 1 | 0.79mi |
| 206 Lakecrest Ln Palm Desert, CA | 2.0 | 2.0 | 1138 | $2,300 | $2.02 | 13d | 1 | 0.81mi |
| 82 Conejo Cir Palm Desert, CA | 3.0 | 2.0 | 1759 | $6,500 | $3.70 | 45d | 1 | 0.81mi |
| 280 Castellana S Palm Desert, CA | 2.0 | 2.0 | 1303 | $6,000 | $4.60 | 45d | 1 | 0.82mi |
| 74098 Goleta Ave Palm Desert, CA | 2.0 | 2.0 | 893 | $3,000 | $3.36 | 5d | 1 | 0.83mi |
| 352 S Sierra Madre Palm Desert, CA | 2.0 | 2.0 | 1584 | $5,800 | $3.66 | 45d | 1 | 0.83mi |
| 73760 Rancho Rd Unit 2 Palm Desert, CA | 2.0 | 1.0 | 1150 | $1,595 | $1.39 | 14d | 1 | 0.87mi |
| 365 San Remo St Palm Desert, CA | 2.0 | 2.0 | 1303 | $5,500 | $4.22 | 45d | 1 | 0.88mi |
| 363 San Remo St Palm Desert, CA | 2.0 | 2.0 | 1656 | $7,500 | $4.53 | 45d | 1 | 0.88mi |
| 150 Willow Lake Dr Palm Desert, CA | 2.0 | 2.0 | 1138 | $2,500 | $2.20 | 45d | 1 | 0.90mi |
| 166 Wimbledon Ct Palm Desert, CA | 2.0 | 2.0 | 1250 | $3,200 | $2.56 | 45d | 1 | 0.92mi |
| 191 Winterhaven Cir Palm Desert, CA | 2.0 | 1.5 | 1250 | $2,800 | $2.24 | 45d | 1 | 0.93mi |
| 316 S Sierra Madre Palm Desert, CA | 2.0 | 2.0 | 1656 | $5,700 | $3.44 | 45d | 1 | 0.94mi |
| 389 Gran Via Palm Desert, CA | 3.0 | 2.0 | 1670 | $3,750 | $2.25 | 26d | 1 | 0.95mi |
| 236 Castellana S Palm Desert, CA | 2.0 | 2.0 | 1684 | $8,000 | $4.75 | 45d | 1 | 0.97mi |
| 337 Villena Way Palm Desert, CA | 2.0 | 2.0 | 1303 | $5,000 | $3.84 | 45d | 1 | 0.97mi |
| 43376 Cook St Palm Desert, CA | 1.0–2.0 | 1.0–2.0 | 854 | $2,500 | $2.93 | 45d | 6 | 0.97mi |
| 43376 Cook St Palm Desert, CA | 2.0 | 1.0–2.0 | 1005 | $2,200 | $2.19 | 1d | 2 | 0.97mi |
| 43376 Cook St Palm Desert, CA | 2.0 | 1.0–2.0 | 1005 | $2,200 | $2.19 | 6d | 3 | 0.97mi |
| 43376 Cook St Palm Desert, CA | 2.0 | 2.0 | 1005 | $2,248 | $2.24 | 26d | 4 | 0.97mi |
HOA detail
- Monthly dues
- $455 · $5,460/yr
- Likely covers
- gassecurity
Listing history 15 events
-
2026-06-21days on market $289,900 Active 27 DOM
-
2026-06-18days on market $289,900 Active 24 DOM
-
2026-06-17days on market $289,900 Active 23 DOM
-
2026-06-16days on market $289,900 Active 22 DOM
-
2026-06-15days on market $289,900 Active 21 DOM
-
2026-06-13days on market $289,900 Active 19 DOM
-
2026-06-09pricedays on market $289,900 Active 15 DOM
-
2026-06-08days on market $339,900 Active 14 DOM
-
2026-06-07days on market $339,900 Active 13 DOM
-
2026-06-04days on market $339,900 Active 10 DOM
-
2026-06-03days on market $339,900 Active 9 DOM
-
2026-06-02days on market $339,900 Active 8 DOM
-
2026-06-01days on market $339,900 Active 7 DOM
-
2026-05-31days on market $339,900 Active 6 DOM
-
2026-05-21historical $339,900
ⓘ Source: listings_history table (triggers on properties + properties_extension) + one-shot
backfill from property_details.listing_events for pre-trigger history.
Tax reassessment forecast CA · Resets to sale price
- Current annual tax
- $2,607 · $217/mo
- Projected year-2 tax
- $2,607 · $217/mo
- Expected delta
- $0/yr ($0/mo · 0.0%)
ⓘ Screening estimate from a state-policy table — verify with the county assessor before closing.
Climate risk First Street
- Flood 1/10 Low FEMA zone X (unshaded) · 0% chance over 30 yrs
- Wildfire 1/10 Low
- Heat 9/10 Extreme 7 d/yr ≥114°F today · 19 d/yr by 30 yrs out
- Wind 1/10 Low
- Air quality 4/10 Moderate 5 unhealthy d/yr today · 6 by 30 yrs out
Nearby sold comps map
Loading sold comps map…
Walkable amenities ~0.75 mi
Loading nearby amenities…
Taxation est. · year 1
- Rental income
- $42,558
- − Mortgage interest
- −$16,239
- − Property taxes
- −$2,607
- − Insurance
- −$1,450
- − Repairs & maintenance
- −$3,405
- − Management
- −$3,405
- − HOA
- −$5,460
- − Depreciation
- −$8,433
- Taxable income
- $1,560
- Est. tax owed @ 24.0%
- −$374
- After-tax cash flow
- $5,487/yr
For passive investors: Depreciation is non-cash, so a rental often shows a tax loss while cash-flowing — sheltering income. Rental losses are passive: they offset passive income freely, and up to $25,000/yr can offset ordinary (W-2) income if you actively participate and your MAGI is under $100k (phasing out to $0 by $150k); unused losses carry forward. On sale, claimed depreciation is recaptured at up to 25%, and gains may owe capital-gains tax (a 1031 exchange can defer both). Figures are a year-1 estimate at your 24.0% rate — not tax advice; consult a CPA.
Schools (NCES district)
- District
- Desert Sands Unified
- NCES district ID
- 0611110
- Math proficiency
- 31% ▼ -4.00%
- Reading proficiency
- 56% ▲ 7.00%
- Median HH income
- $54,957
- Composite
- 37.77/100
- National rank
- #4346
- State rank
- #199 of 517 in CA
Livability — Palm Desert
- Score
- 51/100
- State rank
- #1050
- US rank
- #25164
Category grades
Schools grade is shown separately in the Schools card above.
Census & demographics
- Census place
- Palm Desert, CA
- County
- Riverside County · 2,287,001 people
- City population
- 58,615
- Metro
- Riverside-San Bernardino-Ontario, CA
- Population (ZIP)
- 30,523
- Household income
- $70,091
- Rent vs Own
- Severe rent burden
- 1734.0
Population outlook (Riverside County) Hauer SSP2
- Today (2025)
- 2,664,475 people
- By 2030
- 2,802,692 · +5.2%
- By 2040
- 3,050,904 · +14.5%
- By 2050
- 3,256,783 · +22.2%
- By 2075
- 3,655,058 · +37.2%
- By 2100
- 3,766,594 · +41.4%
Race, ethnicity, and origin ACS 2023
- Neighborhood character
- Majority White (61%)
- Race & ethnicity
- White 61% Hispanic / Latino 31% Two or more races 20% Asian 4% Black 2%
- Hispanic origin (detail)
- Mexican 25%
- Common ancestry
- Italian 4% Lithuanian 3% Slovak 2%
- Foreign-born
- 18% · Canada, South Korea, Vietnam
- Languages at home
- 73% English-only · Spanish 22% French/Haitian/Cajun 1% Other Indo-European 1%
Political lean MEDSL · Riverside
- 2024 margin
- Toss-up / Even · D 48.0% · R 49.3% · Other 2.6%
- 2008→2024 swing
- -3.6pp toward R · 2008: 2.3pp · 2024: -1.3pp
- All cycles
- 2024: R+1.3 2020: D+8.0 2016: D+4.3 2012: R+0.4 2008: D+2.3
Not yet ingested
- Civics
- —
Market trends
- HPI YoY
- ▼ -364.94%
- Current HPI
- 294.9425
- Rent YoY
- ▲ 1.60%
- Metro
- Riverside-San Bernardino-Ontario, CA
- State GDP YoY
- ▲ 3.21%
- F500 in state
- 116
Industry mix (Fortune 500 HQ in CA)
| Industry | F500 HQs | Revenue |
|---|---|---|
| Technology | 27 | $1,492B |
|
||
| Financial Services | 3 | $174B |
|
||
| Retail | 3 | $44B |
|
||
| Insurance | 3 | $26B |
|
||
| Media / Entertainment | 2 | $115B |
|
||
| Pharmaceuticals / Biotech | 2 | $62B |
|
||
Price history
-14.7% since first listed3 events — show timeline
- 2026-06-09 Price Changed $289,900 CRMLS
- 2026-05-25 Listed $339,900 CRMLS
- 2026-05-21 Coming Soon $339,900 CRMLS
Property tax history
+2.1%/yrLatest (2025): $2,607 · +3.0% YoY. Source: county tax records.
Cash-flow waterfall
monthlySold comps — $/sqft
last 12 mo · ≤1 miLoading sold comps…