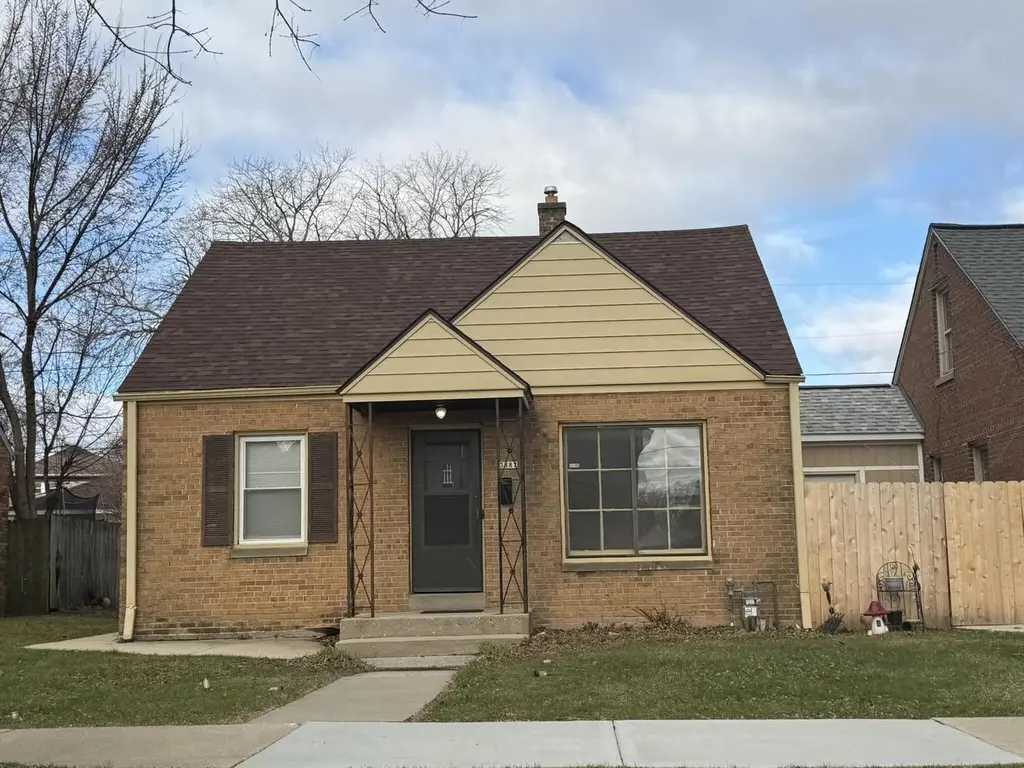
3887 N 56th St · Milwaukee, WI
Flood risk 6/10 · Moderate
- FEMA flood zone
- X (unshaded)
- Chance of flooding over 30 yrs
- 0.69%
- Est. flood insurance / yr
- $473 – $860
Fire risk 1/10 · Minimal
- Est. fire insurance / yr
- $636 – $1,182
Heat risk 2/10 · Minimal
- Hot days now (above 100°F)
- 7 days/yr
- Hot days in 30 yrs
- 13 days/yr
Wind risk 2/10 · Minimal
- Chance of severe wind over 30 yrs
- —
Air-quality risk 2/10 · Minimal
- Unhealthy air days now
- 2 days/yr
- Unhealthy air days in 30 yrs
- 2 days/yr
Risk factors via First Street. Map © Google.
Why this score? — see what drove the C+ grade
The composite is a weighted blend of 9 inputs, each scored 0–100. Each bar is that input's sub-score; the figure is the points it added to the 100-point composite (weight × sub-score).
- Cash flow +19.8/30.0
- ARV discount +12.5/15.0
- DSCR +6.3/10.0
- Appreciation +5.7/10.0
- 1% rule +5.1/10.0
- Rent growth +4.3/5.0
- Livability +4.0/5.0
- Condition / age +2.5/5.0
- Schools +1.2/10.0
$159,900
🖨 Deal sheet (PDF) 📄 Offer letter ✓ Due diligence
Listing remarks MLS
4BR 1.5BA brick Cape in handy location. Features newer roof and some windows. Nice yard, detached garaged, and a fresh make ready is what you can expect. Property has been leased out for a year.
Key facts
- Newer roof
- Nice yard
- Detached garage
Tags
Neighborhood map
What this means for you Summary
Snapshot
- This is a 4-bed/2.0-bath single-family listed at $160k.
Deal economics
- At list price, monthly cash flow is $190 ($2k/yr) — positive.
- The deal already cash-flows at list — no discount required.
- Meets the 1% rule at list price ($2k rent vs $160k).
- Recommended offer: $155k (3.0% below list) — sets the bar for market timing.
- Cap rate 7.7% vs local median 5.1% in Milwaukee — top-decile yield for the area; either an underpriced asset or a hidden risk that comps aren't pricing in. Stress-test before assuming the spread holds.
Location & tenants
- Location reads 81/100 on livability (#55 in WI, #1,534 nationally) — a professional / high-income tenant draw. Strengths: amenities A+, commute A+, cost of living A+; Watch: employment D+, schools F, crime F.
- Milwaukee School District (urban): math 10% / reading 18% proficiency, ranked #337 of 342 in WI (top 98%) — low school quality limits family demand, transient renter base, plan for 1-2y turnover; 77% free/reduced lunch — lower-income household profile, screen leases tightly.
- Market conditions: Rents rising fast (+7.0%/yr); 126 active listings in the ZIP; 11 comparable units currently listed for rent nearby; rentals lingering (median 45d on market — plan ~5-8 weeks vacancy on turnover, expect pricing pressure); 55% of comp listings sitting > 30 days — soft ceiling on asking rent; 1,017 units permitted in Milwaukee County in 2024 (803 in 5+ unit buildings).
Forward outlook
- In year one you build about $3k of equity ($1k loan paydown + $2k appreciation (1.3% local appreciation)).
- Milwaukee County population projected at +4% by 2050 — modest demand growth; plan on rents tracking national, not racing it.
- At projected returns (1.3% appreciation + 7.0% rent growth), your $45k cash investment doubles in ~6 years — after that, you're playing with house money.
- By year 10, paydown + projected appreciation supports a ~$33k cash-out refi (75% LTV) — recoverable capital for the next deal without selling this one.
Negotiation context
- It's been on market 46 days — a 3% lower offer ($155k) is reasonable based on typical stale-listing flexibility.
- 4 sale attempts since 13y ago with the ask held roughly flat each time — persistent listings suggest the price (not the market) is what's stuck; bring a comps-based counter.
- Current owner paid $31k; list at $160k implies a 416% gain — meaningful room to come down on a strong offer.
Risks & watch-outs
- Watch-outs: built in 1944 — expect roof / HVAC / electrical / plumbing capex.
- Climate carrying-cost: major flood risk — expect insurance premiums to compound above CPI over the hold.
Questions for the listing agent
- It's been on market 46 days. Have you received any prior offers? Is the seller open to a 3% concession, seller financing, or rate buy-down credit?
- Built in 1944 — when were the roof, HVAC, electrical panel, plumbing, and water heater last replaced?
- Is there a deadline driving the sale (1031 exchange, divorce, estate, relocation)? That informs how much negotiation room exists.
- Schools are F-rated, which usually means shorter tenancies and higher turnover. Who's the typical renter profile here, and what's been the actual vacancy rate?
- Crime grade is F in this area — have there been break-ins, vandalism, or insurance claims at this property in the last 3 years? What carrier currently insures it and at what premium?
- What's the average days-on-market for RENTAL listings here right now (not sales)? A rising rental-DOM trend means longer vacancies and softer asking-rent achievability than the comps imply.
- What's the recent tenant-quality profile in this submarket — average credit score on applications, eviction rate, late-payment / NSF rate, and stable-employment percentage? A property-management company in the area should have these aggregated.
- How much new for-sale + rental construction is in the pipeline within 1–3 miles? Heavy new supply typically softens prices + rents 12–24 months out; constrained supply supports both.
Investment metrics
- 1% rule
- 1.01% ✓
- Cap rate
- 7.72%
- Cash-on-cash
- 5.10%
- DSCR
- 1.23
- GRM
- 8.2
CMA / ARV
- ARV (median comp)
- $180,108
- List price
- $159,900
- Delta
- -11.22%
- Verdict
- UNDERPRICED
- Comps
- 20 within 1.0 mi
Show comp detail 12 sales within ~0.75 mi
| Address | Dist | Beds/Ba | Sqft | Sold | Price | $/sf | Match |
|---|---|---|---|---|---|---|---|
| 3919 N 58th St | 0.11mi | 3/2.0 (-1) | 1,277 (+12%) | 1mo | $150,000 | $117 | 69 |
| 3619 N 61st St | 0.39mi | 4/1.0 | 1,083 (-5%) | 1mo | $105,000 | $97 | 69 |
| 3946 N 63rd St | 0.36mi | 3/1.0 (-1) | 1,191 (+5%) | 0mo | $200,000 | $168 | 66 |
| 3718 N 57th St | 0.22mi | 3/1.5 (-1) | 1,264 (+11%) | 1mo | $190,000 | $150 | 63 |
| 4132 N 51st Blvd | 0.45mi | 3/1.5 (-1) | 1,076 (-5%) | 0mo | $100,000 | $93 | 62 |
| 4278 N 52nd St | 0.56mi | 3/1.0 (-1) | 1,161 (+2%) | 2mo | $115,000 | $99 | 60 |
| 3945 N 61st St | 0.27mi | 3/1.5 (-1) | 1,267 (+11%) | 2mo | $171,100 | $135 | 60 |
| 4142 N 68th St | 0.74mi | 4/1.0 | 1,155 (+2%) | 0mo | $142,000 | $123 | 59 |
| 4314 N 48 St | 0.73mi | 3/1.0 (-1) | 1,128 (-1%) | 1mo | $133,000 | $118 | 54 |
| 4305 N 63rd St | 0.64mi | 3/1.0 (-1) | 1,028 (-10%) | 1mo | $130,000 | $126 | 44 |
| 4150 N 46th St | 0.72mi | 3/2.0 (-1) | 1,275 (+12%) | 0mo | $170,000 | $133 | 41 |
| 4448 W Leon Ter | 0.72mi | 3/1.0 (-1) | 1,014 (-11%) | 2mo | $130,000 | $128 | 37 |
Match score weights: distance 35% · size 25% · config 20% · recency 20%. Top-matched comps best support the ARV.
Projected returns pro-forma
1.33% appreciation · 7.01% rent growth · sell at horizon
- IRR
- 10.3%
- Equity multiple
- 1.55×
- Total profit
- $24,506
- Equity at exit
- $57,337
- IRR
- 16.2%
- Equity multiple
- 3.25×
- Total profit
- $100,529
- Equity at exit
- $78,368
Cash invested: $44,772 (down + closing). Projections, not guarantees.
Landlord ↔ Tenant lean methodology
- Overall (STATE)
- 73 Landlord-Friendly
- State Wisconsin
- 73 Landlord-Friendly · R+2
- County
- — inherits STATE
- City
- — inherits STATE
ZIP-level market 53216
- Home prices YoY
- 0.3%
- Rents YoY
- 7.0%
- Active inventory
- 126
- Price-to-rent
- 8.2×
Monthly cashflow live
- Estimated rent
- $1,618 high interval (Pro) →
- Mortgage (P&I)
- −$839
- Tax from tax record
- −$182 /mo · $2,187/yr
- Insurance
- −$67
- HOA
- −$0
- Vacancy / Maint / Mgmt
- −$340
- Net cashflow
- $190
Break-even live
Sensitivity live
| Price | -10% $281 | -5% $236 | +0% $190 | +5% $145 | +10% $100 |
|---|---|---|---|---|---|
| Rent | -10% $63 | -5% $127 | +0% $190 | +5% $254 | +10% $318 |
| Rate | -1.0pp $271 | -0.5pp $231 | base $190 | +0.5pp $149 | +1.0pp $107 |
UW: 25.0% down · 7.5% · 30yr · 1.5% tax · 5.0% vac · 8.0% maint · 8.0% mgmt
Financing live
Cash to close
- Down payment
- $39,975
- Closing costs
- $4,797
- Reserves months
- —
- Total cash needed
- —
Loan-product check · same deal, 3 products live
Conventional
25% down · 7.5% · 30yr
- Down + closing
- —
- Monthly P&I
- —
- Monthly cashflow
- —
- DSCR
- —
- Eligible?
- —
Personal DTI + credit; lowest rate.
DSCR
20% down · 8.5% · 30yr
- Down + closing
- —
- Monthly P&I
- —
- Monthly cashflow
- —
- DSCR
- —
- Eligible?
- —
No personal income docs; deal must DSCR.
Hard money
10% down · 12.0% · 12mo
- Down + closing
- —
- Monthly P&I
- —
- Monthly cashflow
- —
- DSCR
- —
- Eligible?
- —
Short-term bridge; refi at stabilization.
Rent comps 11 comps
| Address | Beds | Baths | Sqft | Rent | $/sqft | DOM | Units | Dist |
|---|---|---|---|---|---|---|---|---|
| 4139 N 50th St Milwaukee, WI | 3.0 | 1.0 | 1275 | $1,600 | $1.25 | 44d | 1 | 0.47mi |
| 4153 N 68th St Milwaukee, WI | 3.0 | 1.0 | 1025 | $1,700 | $1.66 | 44d | 1 | 0.81mi |
| 3155 N 52nd St Milwaukee, WI | 3.0 | 2.0 | 1300 | $1,400 | $1.08 | 44d | 1 | 0.82mi |
| 3925 N 42nd St Milwaukee, WI | 3.0 | 1.0 | 1300 | $1,675 | $1.29 | 44d | 1 | 0.88mi |
| 3012 N 57th St Unit Lower Milwaukee, WI | 3.0 | 1.0 | 1130 | $1,398 | $1.24 | 5d | 1 | 0.97mi |
| 3123 N 42nd St Milwaukee, WI | 4.0 | 1.0 | 1500 | $1,700 | $1.13 | 24d | 1 | 1.21mi |
| 4727 N 46th St Milwaukee, WI | 3.0 | 1.0 | 936 | $1,700 | $1.82 | 44d | 1 | 1.22mi |
| 4703 N 45th St Milwaukee, WI | 3.0 | 1.0 | 1031 | $1,695 | $1.64 | 24d | 1 | 1.22mi |
| 3122 N 42nd St Milwaukee, WI | 3.0 | 1.0 | 1323 | $1,495 | $1.13 | 5d | 1 | 1.23mi |
| 4702 N 44th St Milwaukee, WI | 3.0 | 2.0 | 1050 | $1,850 | $1.76 | 44d | 1 | 1.27mi |
| 4900 N 58th St Milwaukee, WI | 3.0 | 1.0 | 1455 | $1,450 | $1.00 | 5d | 1 | 1.29mi |
Listing history 11 events
-
2026-04-10$159,900 Active 194-char remark
Show marketing remark (194 chars)
4BR 1.5BA brick Cape in handy location. Features newer roof and some windows. Nice yard, detached garaged, and a fresh make ready is what you can expect. Property has been leased out for a year.
-
2026-04-05historical $2,099
-
2026-03-23$2,099
-
2013-02-08$95,000 132-char remark
Show marketing remark (132 chars)
Beautiful 4-bedroom Cape Cod on a nice quiet street of homeowners. Offers nice yard, garage plus slab. Close to mall. Price right!!!
-
2013-02-08historical 132-char remark
Show marketing remark (132 chars)
Beautiful 4-bedroom Cape Cod on a nice quiet street of homeowners. Offers nice yard, garage plus slab. Close to mall. Price right!!!
-
2013-01-12$38,900
-
2013-01-12historical
-
2010-12-09soldstatus $31,000
-
2006-02-17soldstatus $127,000
-
2002-07-17soldstatus $80,000
-
1998-09-21soldstatus $63,000
ⓘ Source: listings_history table (triggers on properties + properties_extension) + one-shot
backfill from property_details.listing_events for pre-trigger history.
Tax reassessment forecast WI · Partial reset (capped growth)
- Current annual tax
- $2,187 · $182/mo
- Projected year-2 tax
- $2,573 · $214/mo
- Expected delta
- +$385/yr (+$32/mo · 17.6%)
ⓘ Screening estimate from a state-policy table — verify with the county assessor before closing.
Climate risk First Street
- Flood 6/10 Major FEMA zone X (unshaded) · 69% chance over 30 yrs
- Wildfire 1/10 Low
- Heat 2/10 Low 7 d/yr ≥100°F today · 13 d/yr by 30 yrs out
- Wind 2/10 Low
- Air quality 2/10 Low 2 unhealthy d/yr today · 2 by 30 yrs out
Nearby sold comps map
Loading sold comps map…
Walkable amenities ~0.75 mi
Loading nearby amenities…
Taxation est. · year 1
- Rental income
- $19,410
- − Mortgage interest
- −$8,957
- − Property taxes
- −$2,187
- − Insurance
- −$800
- − Repairs & maintenance
- −$1,553
- − Management
- −$1,553
- − Depreciation
- −$4,652
- Taxable loss
- −$290
- Est. tax savings @ 24.0%
- +$70
- After-tax cash flow
- $2,355/yr
For passive investors: Depreciation is non-cash, so a rental often shows a tax loss while cash-flowing — sheltering income. Rental losses are passive: they offset passive income freely, and up to $25,000/yr can offset ordinary (W-2) income if you actively participate and your MAGI is under $100k (phasing out to $0 by $150k); unused losses carry forward. On sale, claimed depreciation is recaptured at up to 25%, and gains may owe capital-gains tax (a 1031 exchange can defer both). Figures are a year-1 estimate at your 24.0% rate — not tax advice; consult a CPA.
Schools (NCES district)
- District
- Milwaukee School District
- NCES district ID
- 5509600
- Math proficiency
- 10% ▼ -5.00%
- Reading proficiency
- 18% ▬ 0.00%
- Median HH income
- $36,339
- Composite
- 11.61/100
- National rank
- #9696
- State rank
- #337 of 342 in WI
Livability — Milwaukee
- Score
- 81/100
- State rank
- #55
- US rank
- #1534
Category grades
Schools grade is shown separately in the Schools card above.
Census & demographics
- Census place
- Milwaukee, WI
- County
- Milwaukee County · 926,379 people
- City population
- 573,768
- Metro
- Milwaukee-Waukesha, WI
- Population (ZIP)
- 30,345
- Household income
- $46,752
- Rent vs Own
- Severe rent burden
- 2202.0
Population outlook (Milwaukee County) Hauer SSP2
- Today (2025)
- 995,758 people
- By 2030
- 1,009,124 · +1.3%
- By 2040
- 1,028,128 · +3.3%
- By 2050
- 1,040,066 · +4.4%
- By 2075
- 1,057,849 · +6.2%
- By 2100
- 1,039,774 · +4.4%
Race, ethnicity, and origin ACS 2023
- Neighborhood character
- Predominantly Black (81%)
- Race & ethnicity
- Black 81% White 9% Hispanic / Latino 5% Two or more races 5% Asian 3%
- Hispanic origin (detail)
- Mexican 2% Puerto Rican 3%
- Common ancestry
- Romanian 1%
- Foreign-born
- 3% · Canada, Philippines, China
- Languages at home
- 93% English-only · Spanish 4% Other Asian/Pacific 2%
Political lean MEDSL · Milwaukee
- 2024 margin
- Solid D (+38.5) · D 68.3% · R 29.8% · Other 1.8%
- 2008→2024 swing
- +2.7pp toward D · 2008: 35.9pp · 2024: 38.5pp
- All cycles
- 2024: D+38.5 2020: D+39.9 2016: D+37.5 2012: D+34.6 2008: D+35.9
Not yet ingested
- Civics
- —
Market trends
- HPI YoY
- ▲ 1.33%
- Current HPI
- 381.0954
- Rent YoY
- ▲ 7.01%
- Metro
- Milwaukee-Waukesha, WI
- State GDP YoY
- ▲ 2.10%
- F500 in state
- 20
Industry mix (Fortune 500 HQ in WI)
| Industry | F500 HQs | Revenue |
|---|---|---|
| Industrial Machinery | 4 | $23B |
|
||
| Industrial Technology | 2 | $36B |
|
||
| Insurance | 1 | $36B |
|
||
| Professional Services | 1 | $19B |
|
||
| Utilities | 1 | $9B |
|
||
| Consumer Goods | 1 | $3B |
|
||
Price history
+153.8% since first listed11 events — show timeline
- 2026-04-10 Listed $159,900 METROMLS
- 2026-04-05 Rental Removed $2,099 APPFOLIO
- 2026-03-23 Listed for Rent $2,099 APPFOLIO
- 2013-02-08 Listing Removed — METROMLS
- 2013-02-08 Listed $95,000 METROMLS
- 2013-01-12 Listing Removed — METROMLS
- 2013-01-12 Listed $38,900 METROMLS
- 2010-12-09 Sold (MLS) $31,000 METROMLS
- 2006-02-17 Sold (Public Records) $127,000 Public Records
- 2002-07-17 Sold (Public Records) $80,000 Public Records
- 1998-09-21 Sold (Public Records) $63,000 Public Records
Property tax history
+1.1%/yrLatest (2024): $2,187 · +16.8% YoY. Source: county tax records.
Cash-flow waterfall
monthlySold comps — $/sqft
last 12 mo · ≤1 miLoading sold comps…