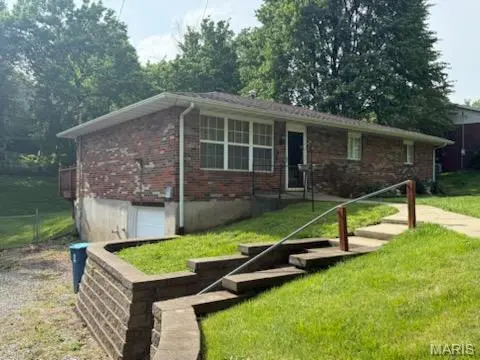
204 Lake Hillcrest Dr · Glen Carbon, IL
Flood risk 1/10 · Minimal
- FEMA flood zone
- —
- Chance of flooding over 30 yrs
- 0.0%
- Est. flood insurance / yr
- —
Fire risk 1/10 · Minimal
- Est. fire insurance / yr
- $804 – $1,492
Heat risk 5/10 · Moderate
- Hot days now (above 107°F)
- 7 days/yr
- Hot days in 30 yrs
- 21 days/yr
Wind risk 2/10 · Minimal
- Chance of severe wind over 30 yrs
- 1.0%
Air-quality risk 3/10 · Minor
- Unhealthy air days now
- 3 days/yr
- Unhealthy air days in 30 yrs
- 4 days/yr
Risk factors via First Street. Map © Google.
Why this score? — see what drove the C- grade
The composite is a weighted blend of 9 inputs, each scored 0–100. Each bar is that input's sub-score; the figure is the points it added to the 100-point composite (weight × sub-score).
- Cash flow +16.1/30.0
- ARV discount +15.0/15.0
- DSCR +5.0/10.0
- 1% rule +3.9/10.0
- Livability +3.8/5.0
- Schools +3.5/10.0
- Rent growth +2.5/5.0
- Condition / age +2.5/5.0
- Appreciation +0.0/10.0
$160,000
🖨 Deal sheet 📄 Offer letter ✓ Due diligence
Listing remarks
3 Bedroom Brick Home with great potential. This brick ranch offers 3 bedrooms, 1 1/2 baths, nice wood deck, large fenced yard and a great location. Looking for a buyer to add their personal touch. Situated on a spacious lot, the property features a fully fenced back yard perfect for pets, play or entertaining along with a wood deck just in time for summer. Inside, the home has a functional layout with a 15' living room and an eat-in kitchen. While it does need flooring and some updates, it presents a fantastic opportunity to build equity and customize to your taste. Whether you are a first time buyer ready for a project or need a great move up brick ranch home this home has endless potentia
Key facts
- Wood deck
- Fenced yard
- Spacious lot
Tags
Property features AI
Exterior
- Parking: Attached garage (1 car)
- Utilities: Public water; Public sewer; Electric service by Ameren; Electricity connected
- Home design: Single family residence; One story
- Construction: Brick construction
- Exterior features: Gentle sloping lot; Lot dimensions approximately 100 x 143
Interior
- Kitchen: Kitchen on main level
- Bedrooms: 2 bedrooms on the main level
- Bathrooms: 1 full bathroom; 1 half bathroom
- Heating & cooling: Forced air heating (natural gas); Central air conditioning
- Interior features: Full basement with storage space; Washer and dryer included
- Laundry & utility: Washer/Dryer
Neighborhood map
What this means for you Summary
Snapshot
- This is a 3-bed/1.5-bath single-family listed at $160k.
Deal economics
- At list price, monthly cash flow is $82 ($985/yr) — positive.
- The deal already cash-flows at list — no discount required.
- To meet the 1% rule (rent ≥ 1% of price), the offer needs to be $143k (10.7% below list).
- Recommended offer: $143k (10.7% below list) — sets the bar for 1% rule.
- Cap rate 6.9% vs local median 2.1% in Glen Carbon — top-decile yield for the area; either an underpriced asset or a hidden risk that comps aren't pricing in. Stress-test before assuming the spread holds.
Location & tenants
- Location reads 75/100 on livability (#236 in IL, #4,344 nationally) — a middle-class / working-renter tenant base. Strengths: crime A+, employment A+, housing A+; Watch: amenities F, commute F, health & safety F.
- Edwardsville CUSD 7 (suburban): math 39% / reading 36% proficiency, ranked #142 of 620 in IL (top 23%) — families likely to look elsewhere, expect single-tenant / working-renter base with shorter leases; only 16% free/reduced lunch — higher-income household profile.
- Zoned schools: Edwardsville High School (math 40% / reading 45%, grade F, #73 of 693 statewide, top 11%, 2,354 students, 0% FRL) — zoned schools average 0% FRL vs 16% district-wide (16 pts lower); this property's tenant base skews higher-income than the district average.
- Market conditions: 114 active listings in the ZIP; 4 comparable units currently listed for rent nearby; rentals leasing fast (median 11d on market — plan ~1-2 weeks tenant-placement turnaround); solid renter incomes; 336 units permitted in Madison County in 2024 (0 in 5+ unit buildings).
- This rent is only 17% of the median local income ($101k/yr) — well below the 30% rent-burden line; pricing power to push rent on renewal without tenant pushback.
Forward outlook
- Local home prices are declining (-3.0%/yr); year-one equity from $1k of loan paydown is wiped out by about $5k of value loss. Plan a longer hold.
- Madison County population projected at -18% by 2050 — secular population decline; favor cash flow + early exit over multi-decade hold.
Negotiation context
- Only 3 days on market — expect competitive offers; lowballing is unlikely to land.
Risks & watch-outs
- Climate carrying-cost: extreme-heat days projected 7→21/yr by 2055 (HVAC capex compounding) — expect insurance premiums to compound above CPI over the hold.
Questions for the listing agent
- Built in 1962 — when were the roof, HVAC, electrical panel, plumbing, and water heater last replaced?
- Is there a deadline driving the sale (1031 exchange, divorce, estate, relocation)? That informs how much negotiation room exists.
- Schools are B-rated — typically a magnet for longer-tenancy family renters. What's the average tenant stay here, and is there a school-zone premium baked into asking?
- What's the average days-on-market for RENTAL listings here right now (not sales)? A rising rental-DOM trend means longer vacancies and softer asking-rent achievability than the comps imply.
- What's the recent tenant-quality profile in this submarket — average credit score on applications, eviction rate, late-payment / NSF rate, and stable-employment percentage? A property-management company in the area should have these aggregated.
- How much new for-sale + rental construction is in the pipeline within 1–3 miles? Heavy new supply typically softens prices + rents 12–24 months out; constrained supply supports both.
Investment metrics
- 1% rule
- 0.89% ✗
- Cap rate
- 6.91%
- Cash-on-cash
- 2.20%
- DSCR
- 1.10
- GRM
- 9.3
CMA / ARV
- ARV (on-the-fly)
- $196,768
- Comps found
- 8
Show comp detail 8 sales within ~0.75 mi
| Address | Dist | Beds/Ba | Sqft | Sold | Price | $/sf | Match |
|---|---|---|---|---|---|---|---|
| 204 Lake Hillcrest Dr | 0.00mi | 2/1.5 (-1) | 1,144 (0%) | 1mo | $160,000 | $140 | 94 |
| 181 Hampton Dr | 0.06mi | 3/2.0 | 1,232 (+8%) | 6mo | $315,000 | $256 | 77 |
| 127 Collinsville St | 0.55mi | 3/2.0 | 1,192 (+4%) | 8mo | $205,000 | $172 | 59 |
| 202 Summit Ave | 0.73mi | 3/2.0 | 1,232 (+8%) | 0mo | $130,000 | $106 | 51 |
| 42 Sunset Ave | 0.59mi | 2/1.0 (-1) | 1,144 (0%) | 19mo | $160,000 | $140 | 50 |
| 141 Center St | 0.44mi | 2/1.0 (-1) | 1,040 (-9%) | 15mo | $210,000 | $202 | 45 |
| 220 Summit Ave | 0.73mi | 2/1.0 (-1) | 1,171 (+2%) | 12mo | $130,000 | $111 | 45 |
| 164 Spruce St | 0.41mi | 2/1.0 (-1) | 1,036 (-9%) | 20mo | $179,900 | $174 | 41 |
Match score weights: distance 35% · size 25% · config 20% · recency 20%. Top-matched comps best support the ARV.
Projected returns pro-forma
-3.0% appreciation · 3.0% rent growth · sell at horizon
- IRR
- -12.8%
- Equity multiple
- 0.54×
- Total profit
- $-20,711
- Equity at exit
- $23,857
- IRR
- -3.8%
- Equity multiple
- 0.75×
- Total profit
- $-11,362
- Equity at exit
- $13,834
Cash invested: $44,800 (down + closing). Projections, not guarantees.
Landlord ↔ Tenant lean methodology
- Overall (STATE)
- 43 Moderately Tenant-Leaning
- State Illinois
- 43 Moderately Tenant-Leaning · D+7
- County
- — inherits STATE
- City
- — inherits STATE
ZIP-level market 62034
- Home prices YoY
- -13.7%
- Active inventory
- 114
- Price-to-rent
- 9.3×
Monthly cashflow live
- Estimated rent
- $1,428 medium interval (Pro) →
- Mortgage (P&I)
- −$839
- Tax from tax record
- −$140 /mo · $1,684/yr
- Insurance
- −$67
- HOA
- −$0
- Vacancy / Maint / Mgmt
- −$300
- Net cashflow
- $82
Break-even live
UW: 25.0% down · 7.5% · 30yr · 1.5% tax · 5.0% vac · 8.0% maint · 8.0% mgmt
Financing live
Cash to close
- Down payment
- $40,000
- Closing costs
- $4,800
- Reserves months
- —
- Total cash needed
- —
Loan-product check · same deal, 3 products live
Conventional
25% down · 7.5% · 30yr
- Down + closing
- —
- Monthly P&I
- —
- Monthly cashflow
- —
- DSCR
- —
- Eligible?
- —
Personal DTI + credit; lowest rate.
DSCR
20% down · 8.5% · 30yr
- Down + closing
- —
- Monthly P&I
- —
- Monthly cashflow
- —
- DSCR
- —
- Eligible?
- —
No personal income docs; deal must DSCR.
Hard money
10% down · 12.0% · 12mo
- Down + closing
- —
- Monthly P&I
- —
- Monthly cashflow
- —
- DSCR
- —
- Eligible?
- —
Short-term bridge; refi at stabilization.
Rent comps 4 comps
| Address | Beds | Baths | Sqft | Rent | $/sqft | DOM | Units | Dist |
|---|---|---|---|---|---|---|---|---|
| 135 Appletree Ln Glen Carbon, IL | 3.0 | 1.0 | 925 | $1,700 | $1.84 | 10d | 1 | 0.58mi |
| 77 Sunset Ave Glen Carbon, IL | 3.0 | 1.0 | 1500 | $1,395 | $0.93 | 16d | 1 | 0.67mi |
| 8 Coachlight Trailer Park Glen Carbon, IL | 2.0 | 1.0 | 728 | $1,000 | $1.37 | 1d | 1 | 0.94mi |
| 2 Silver Oaks Ln Edwardsville, IL | 2.0 | 1.0 | 1050 | $1,295 | $1.23 | 1d | 1 | 1.21mi |
Listing history 3 events
-
2026-05-01status Pending
-
2026-04-28$160,000 Active
-
2026-04-28historical $160,000
ⓘ Source: listings_history table (triggers on properties + properties_extension) + one-shot
backfill from property_details.listing_events for pre-trigger history.
Tax reassessment forecast IL · Partial reset (capped growth)
- Current annual tax
- $1,684 · $140/mo
- Projected year-2 tax
- $2,658 · $221/mo
- Expected delta
- +$974/yr (+$81/mo · 57.9%)
ⓘ Screening estimate from a state-policy table — verify with the county assessor before closing.
Climate risk First Street
- Flood 1/10 Low 0% chance over 30 yrs
- Wildfire 1/10 Low
- Heat 5/10 Major 7 d/yr ≥107°F today · 21 d/yr by 30 yrs out
- Wind 2/10 Low 100% chance of damaging wind over 30 yrs
- Air quality 3/10 Moderate 3 unhealthy d/yr today · 4 by 30 yrs out
Nearby sold comps map
Loading sold comps map…
Walkable amenities ~0.75 mi
Loading nearby amenities…
Taxation est. · year 1
- Rental income
- $17,136
- − Mortgage interest
- −$8,962
- − Property taxes
- −$1,684
- − Insurance
- −$800
- − Repairs & maintenance
- −$1,371
- − Management
- −$1,371
- − Depreciation
- −$4,655
- Taxable loss
- −$1,706
- Est. tax savings @ 24.0%
- +$409
- After-tax cash flow
- $1,395/yr
For passive investors: Depreciation is non-cash, so a rental often shows a tax loss while cash-flowing — sheltering income. Rental losses are passive: they offset passive income freely, and up to $25,000/yr can offset ordinary (W-2) income if you actively participate and your MAGI is under $100k (phasing out to $0 by $150k); unused losses carry forward. On sale, claimed depreciation is recaptured at up to 25%, and gains may owe capital-gains tax (a 1031 exchange can defer both). Figures are a year-1 estimate at your 24.0% rate — not tax advice; consult a CPA.
Schools (NCES district)
- District
- Edwardsville CUSD 7
- NCES district ID
- 1713530
- Math proficiency
- 39% ▼ -12.00%
- Reading proficiency
- 36% ▼ -17.00%
- Median HH income
- $72,131
- Composite
- 34.56/100
- National rank
- #5169
- State rank
- #142 of 620 in IL
Livability — Glen Carbon
- Score
- 75/100
- State rank
- #236
- US rank
- #4344
Category grades
Schools grade is shown separately in the Schools card above.
Census & demographics
- Census place
- Glen Carbon, IL
- County
- Madison County · 189,064 people
- City population
- 14,870
- Metro
- St. Louis, MO-IL
- Population (ZIP)
- 14,870
- Household income
- $101,260
- Rent vs Own
- Severe rent burden
- 153.0
Population outlook (Madison County) Hauer SSP2
- Today (2025)
- 258,371 people
- By 2030
- 251,523 · -2.7%
- By 2040
- 233,640 · -9.6%
- By 2050
- 213,042 · -17.5%
- By 2075
- 165,255 · -36.0%
- By 2100
- 123,953 · -52.0%
Race, ethnicity, and origin ACS 2023
- Neighborhood character
- Predominantly White (83%)
- Race & ethnicity
- White 83% Black 8% Two or more races 5% Hispanic / Latino 4%
- Common ancestry
- Romanian 4% Lithuanian 4% Italian 3%
- Foreign-born
- 2% · Canada, China
- Languages at home
- 97% English-only · Spanish 1%
Political lean MEDSL · Madison
- 2024 margin
- R (+13.3) · D 42.5% · R 55.8% · Other 1.8%
- 2008→2024 swing
- -22.5pp toward R · 2008: 9.2pp · 2024: -13.3pp
- All cycles
- 2024: R+13.3 2020: R+13.2 2016: R+15.6 2012: R+1.4 2008: D+9.2
Not yet ingested
- Civics
- —
Market trends
- HPI YoY
- ▼ -37.33%
- Current HPI
- 235.3221
- Rent YoY
- —
- Metro
- St. Louis, MO-IL
- State GDP YoY
- ▲ 1.59%
- F500 in state
- 60
Industry mix (Fortune 500 HQ in IL)
| Industry | F500 HQs | Revenue |
|---|---|---|
| Insurance | 4 | $201B |
|
||
| Consumer Goods | 4 | $87B |
|
||
| Industrial Machinery | 3 | $64B |
|
||
| Healthcare | 2 | $55B |
|
||
| Retail / Pharmacy | 1 | $148B |
|
||
| Agriculture / Food | 1 | $86B |
|
||
Price history
+0.0% since first listed3 events — show timeline
- 2026-05-01 Pending — MARIS as Distributed by MLS Grid
- 2026-04-28 Listed $160,000 MARIS as Distributed by MLS Grid
- 2026-04-28 Coming Soon $160,000 MARIS as Distributed by MLS Grid
Property tax history
+0.0%/yrLatest (2024): $1,684 · -2.6% YoY. Source: county tax records.
Cash-flow waterfall
monthlySold comps — $/sqft
last 12 mo · ≤1 miLoading sold comps…