 🌊 Lakefront
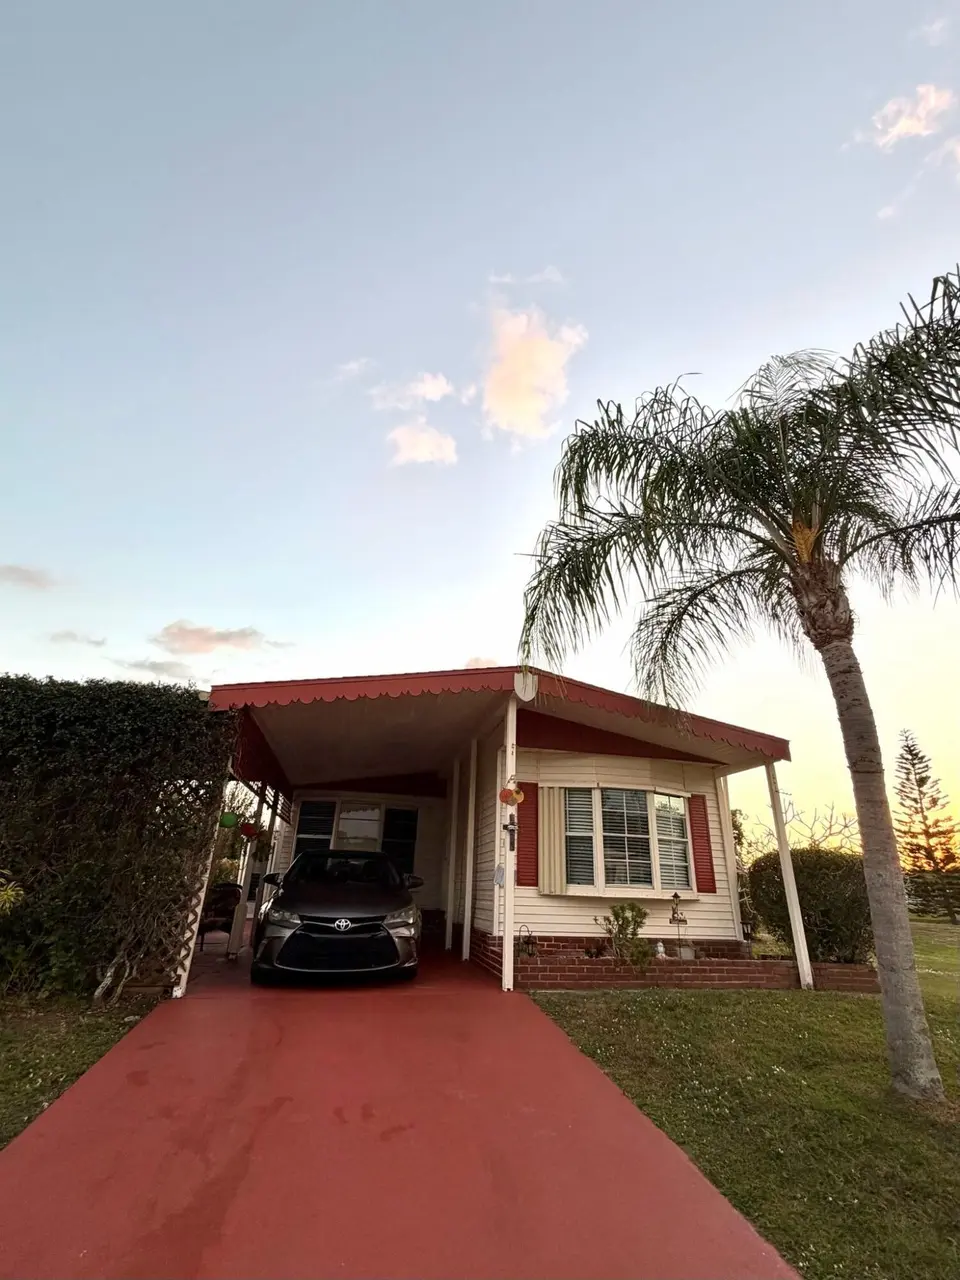
65 W Caribbean · Port St. Lucie, FL
Flood risk 1/10 · Minimal
- FEMA flood zone
- X (unshaded)
- Chance of flooding over 30 yrs
- 0.0%
- Est. flood insurance / yr
- $507 – $1,088
Fire risk 3/10 · Minor
- Est. fire insurance / yr
- $947 – $1,759
Heat risk 10/10 · Severe
- Hot days now (above 106°F)
- 7 days/yr
- Hot days in 30 yrs
- 22 days/yr
Wind risk 10/10 · Severe
- Chance of severe wind over 30 yrs
- 99.0%
Air-quality risk 2/10 · Minimal
- Unhealthy air days now
- 1 days/yr
- Unhealthy air days in 30 yrs
- 1 days/yr
Risk factors via First Street. Map © Google.
Why this score? — see what drove the B+ grade
The composite is a weighted blend of 9 inputs, each scored 0–100. Each bar is that input's sub-score; the figure is the points it added to the 100-point composite (weight × sub-score).
- Cash flow +30.0/30.0
- ARV discount +15.0/15.0
- 1% rule +10.0/10.0
- DSCR +10.0/10.0
- Schools +3.7/10.0
- Rent growth +3.0/5.0
- Livability +2.5/5.0
- Condition / age +2.2/5.0
- Appreciation +0.0/10.0
$79,000
🖨 Deal sheet 📄 Offer letter ✓ Due diligence
Key facts
- Waterfront property
- Water access
- 2 parking spots
Tags
Property features AI
Finance
- Other: Located in a senior community; Pets not allowed
- HOA & community: Association membership required; Association amenities include pool (heated), spa/hot tub, sauna, tennis courts, pickleball courts, shuffleboard court, fitness center, billiard room, game room, community room, library, workshop area, dog park, golf course, manager on site, on-site management
Exterior
- Parking: Attached carport (2 covered spaces); Total parking for 2 vehicles
- Utilities: Public water; Public sewer; Water and sewer available
- Home design: Manufactured home (double wide); Single-story; Faces east; Resale
- Construction: Modular construction; Composition/shingle roof; Skirted
- Exterior features: Open patio
Interior
- Kitchen: Dishwasher; Electric range; Microwave; Refrigerator
- Bedrooms: 2 bedrooms on the main level
- Flooring: Laminate; Wood; Other
- Bathrooms: 2 full bathrooms on the main level
- Heating & cooling: Central heating (electric); Central air conditioning
- Interior features: Split bedroom layout; Partially furnished
- Laundry & utility: In-unit laundry
Neighborhood map
What this means for you Summary
Snapshot
- This is a 2-bed/2.0-bath manufactured listed at $79k. Condition is rated fair.
Deal economics
- At list price, monthly cash flow is $1k ($12k/yr) — positive.
- The deal already cash-flows at list — no discount required.
- Meets the 1% rule at list price ($2k rent vs $79k).
- Recommended offer: $78k (1.5% below list) — sets the bar for market timing.
- Cap rate 21.6% vs local median 3.9% in Port St. Lucie — top-decile yield for the area; either an underpriced asset or a hidden risk that comps aren't pricing in. Stress-test before assuming the spread holds.
Location & tenants
- Location reads: area grade B — affects rentability + tenant quality, not the cash-flow math above.
- St. Lucie (urban): math 40% / reading 48% proficiency, ranked #51 of 73 in FL (top 70%) — families likely to look elsewhere, expect single-tenant / working-renter base with shorter leases.
- Zoned schools: Savanna Ridge Elementary School (math 40% / reading 45%, grade F, #1,383 of 2,144 statewide, top 65%, 452 students, 75% FRL); Port St. Lucie High School (math 21% / reading 43%, grade F, #415 of 667 statewide, top 63%, 1,748 students, 67% FRL).
- Market conditions: Rents rising (+1.9%/yr); 639 active listings in the ZIP; 17 comparable units currently listed for rent nearby; rentals leasing fast (median 14d on market — plan ~1-2 weeks tenant-placement turnaround); 4,868 units permitted in St. Lucie County in 2024 (268 in 5+ unit buildings).
- This rent runs 38% of the median local income ($62k/yr) — at the standard rent-burdened threshold; future hikes will face affordability resistance.
Forward outlook
- Local home prices are declining (-3.0%/yr); year-one equity from $546 of loan paydown is wiped out by about $2k of value loss. Plan a longer hold.
- St. Lucie County population projected at +20% by 2050 — long-run rental-demand tailwind backs the buy-and-hold thesis.
- At projected returns (-3.0% appreciation + 1.9% rent growth), your $22k cash investment doubles in ~3 years — after that, you're playing with house money.
Negotiation context
- It's been on market 15 days — a 2% lower offer ($78k) is reasonable based on typical stale-listing flexibility.
- 2 sale attempts with the ask held roughly flat each time — persistent listings suggest the price (not the market) is what's stuck; bring a comps-based counter.
Risks & watch-outs
- Climate carrying-cost: severe wind risk, 99% chance of damaging wind over 30y; extreme-heat days projected 7→22/yr by 2055 (HVAC capex compounding) — expect insurance premiums to compound above CPI over the hold.
Questions for the listing agent
- Have any recent inspections been done? Can we get a copy of the seller's disclosures and any deferred-maintenance estimates?
- Built in 1979 — when were the roof, HVAC, electrical panel, plumbing, and water heater last replaced?
- Is there a deadline driving the sale (1031 exchange, divorce, estate, relocation)? That informs how much negotiation room exists.
- This sits on a lake — are riparian / water-frontage rights deeded with the parcel? Any dock permits, shoreline easements, or HOA water-use restrictions?
- What's the documented flood / surge / shoreline-erosion history here (FEMA AND non-FEMA — e.g., storm surge, creek backup, septic-field saturation)?
- Any water-quality or seasonal algae-bloom issues that affect tenant satisfaction or short-term-rental demand?
- What's the average days-on-market for RENTAL listings here right now (not sales)? A rising rental-DOM trend means longer vacancies and softer asking-rent achievability than the comps imply.
- What's the recent tenant-quality profile in this submarket — average credit score on applications, eviction rate, late-payment / NSF rate, and stable-employment percentage? A property-management company in the area should have these aggregated.
- How much new for-sale + rental construction is in the pipeline within 1–3 miles? Heavy new supply typically softens prices + rents 12–24 months out; constrained supply supports both.
Investment metrics
- 1% rule
- 2.49% ✓
- Cap rate
- 21.59%
- Cash-on-cash
- 54.65%
- DSCR
- 3.43
- GRM
- 3.3
CMA / ARV
- ARV (on-the-fly)
- $97,650
- Comps found
- 12
Show comp detail 12 sales within ~0.75 mi
| Address | Dist | Beds/Ba | Sqft | Sold | Price | $/sf | Match |
|---|---|---|---|---|---|---|---|
| 110 W Caribbean | 0.26mi | 2/2.0 | 1,416 (-10%) | 5mo | $77,500 | $55 | 66 |
| 172 W Carribean | 0.44mi | 2/2.0 | 1,650 (+5%) | 8mo | $9,500 | $6 | 65 |
| 8522 Leadtree Ct | 0.45mi | 2/2.0 | 1,550 (-2%) | 15mo | $245,000 | $158 | 64 |
| 16 Nuevo Leon Rd | 0.26mi | 3/2.0 (+1) | 1,500 (-5%) | 19mo | $69,000 | $46 | 60 |
| 166 W West Caribbean | 0.43mi | 2/2.0 | 1,450 (-8%) | 14mo | $38,000 | $26 | 55 |
| 192 W Caribbean | 0.51mi | 2/2.0 | 1,416 (-10%) | 6mo | $49,000 | $35 | 54 |
| 8526 Lidflower Ct | 0.44mi | 3/2.5 (+1) | 1,404 (-11%) | 6mo | $70,900 | $50 | 49 |
| 8483 Labelia Ct | 0.60mi | 2/2.0 | 1,456 (-8%) | 15mo | $265,000 | $182 | 47 |
| 188 W West Caribbean W | 0.50mi | 2/2.0 | 1,400 (-11%) | 17mo | $106,000 | $76 | 44 |
| 7 Oliva Rd | 0.37mi | 2/2.0 | 1,350 (-14%) | 18mo | $90,000 | $67 | 44 |
| 8394 Delphinium Ct | 0.69mi | 3/2.0 (+1) | 1,392 (-12%) | 4mo | $220,000 | $158 | 41 |
| 8164 Buckthorn Cir | 0.55mi | 2/2.0 | 1,338 (-15%) | 18mo | $83,000 | $62 | 35 |
Match score weights: distance 35% · size 25% · config 20% · recency 20%. Top-matched comps best support the ARV.
Projected returns pro-forma
-3.0% appreciation · 1.92% rent growth · sell at horizon
- IRR
- 51.6%
- Equity multiple
- 3.23×
- Total profit
- $49,274
- Equity at exit
- $11,779
- IRR
- 56.5%
- Equity multiple
- 6.30×
- Total profit
- $117,156
- Equity at exit
- $6,830
Cash invested: $22,120 (down + closing). Projections, not guarantees.
Landlord ↔ Tenant lean methodology
- Overall (STATE)
- 87 Strongly Landlord-Friendly
- State Florida
- 87 Strongly Landlord-Friendly · R+3
- County
- — inherits STATE
- City
- — inherits STATE
ZIP-level market 34952
- Home prices YoY
- -29.6%
- Rents YoY
- 1.9%
- Active inventory
- 639
- Price-to-rent
- 3.3×
Monthly cashflow live
- Estimated rent
- $1,966 high interval (Pro) →
- Mortgage (P&I)
- −$414
- Tax est. 1.5%
- −$99 /mo · $1,185/yr
- Insurance
- −$33
- HOA
- −$0
- Vacancy / Maint / Mgmt
- −$413
- Net cashflow
- $1,007
Break-even live
UW: 25.0% down · 7.5% · 30yr · 1.5% tax · 5.0% vac · 8.0% maint · 8.0% mgmt
Financing live
Cash to close
- Down payment
- $19,750
- Closing costs
- $2,370
- Reserves months
- —
- Total cash needed
- —
Loan-product check · same deal, 3 products live
Conventional
25% down · 7.5% · 30yr
- Down + closing
- —
- Monthly P&I
- —
- Monthly cashflow
- —
- DSCR
- —
- Eligible?
- —
Personal DTI + credit; lowest rate.
DSCR
20% down · 8.5% · 30yr
- Down + closing
- —
- Monthly P&I
- —
- Monthly cashflow
- —
- DSCR
- —
- Eligible?
- —
No personal income docs; deal must DSCR.
Hard money
10% down · 12.0% · 12mo
- Down + closing
- —
- Monthly P&I
- —
- Monthly cashflow
- —
- DSCR
- —
- Eligible?
- —
Short-term bridge; refi at stabilization.
Rent comps 17 comps
| Address | Beds | Baths | Sqft | Rent | $/sqft | DOM | Units | Dist |
|---|---|---|---|---|---|---|---|---|
| 71 W Caribbean Port St. Lucie, FL | 2.0 | 2.0 | 1417 | $1,700 | $1.20 | 23d | 1 | 0.06mi |
| 1811 SE Walton Lakes Dr Port Saint Lucie, FL | 2.0 | 1.0–2.0 | 1117 | $1,926 | $1.72 | 13d | 6 | 0.22mi |
| 2082 SE Wild Meadow Cir Port Saint Lucie, FL | 2.0 | 2.0 | 1524 | $1,850 | $1.21 | 23d | 1 | 0.41mi |
| 2058 SE Wild Meadow Cir #101 Port St Lucie, FL | 2.0 | 2.5 | 1425 | $2,200 | $1.54 | 13d | 1 | 0.43mi |
| 1810 SE Pinewood Trl Port Saint Lucie, FL | 1.0–2.0 | 1.0–2.0 | 1013 | $2,055 | $2.03 | 13d | 7 | 0.44mi |
| 2183 SE Wild Meadow Cir Port Saint Lucie, FL | 2.0 | 2.0 | 1550 | $1,900 | $1.23 | 13d | 1 | 0.52mi |
| 2130 SE Wild Meadow Cir Port Saint Lucie, FL | 2.0 | 2.0 | 1440 | $1,695 | $1.18 | 13d | 1 | 0.52mi |
| 3784 Sapodilla Ct Port Saint Lucie, FL | 2.0 | 2.0 | 1121 | $2,300 | $2.05 | 23d | 1 | 0.72mi |
| 2209 SE East Dunbrooke Cir Port Saint Lucie, FL | 3.0 | 2.0 | 1212 | $2,950 | $2.43 | 13d | 1 | 0.73mi |
| 1500 SE Tiffany Club Pl Port Saint Lucie, FL | 1.0–3.0 | 1.0–2.0 | 895 | $1,922 | $2.15 | 13d | 7 | 0.83mi |
| 1900 Bella Vista Way Port Saint Lucie, FL | 1.0–2.0 | 1.0–2.0 | 995 | $1,764 | $1.77 | 13d | 15 | 0.86mi |
| 1618 SE Elkhart Ter Port Saint Lucie, FL | 3.0 | 2.0 | 1176 | $2,200 | $1.87 | 23d | 1 | 1.08mi |
| 2051 SE Hillmoor Dr Port Saint Lucie, FL | 1.0–2.0 | 1.0–2.0 | 1014 | $2,539 | $2.50 | 23d | 15 | 1.33mi |
| 1900 SE Hillmoor Dr Port Saint Lucie, FL | 2.0–3.0 | 2.0–2.5 | 1182 | $1,799 | $1.52 | 13d | 14 | 1.35mi |
| 9905 S US Highway 1 Port Saint Lucie, FL | 1.0–2.0 | 1.0–2.0 | 966 | $2,239 | $2.32 | 13d | 15 | 1.37mi |
| 2061 SE Glen Ridge Dr Port Saint Lucie, FL | 2.0 | 2.5 | 1350 | $1,925 | $1.43 | 23d | 1 | 1.42mi |
| 301 SE Castle Ct Port St. Lucie, FL | 2.0 | 2.5 | 1688 | $2,900 | $1.72 | 23d | 1 | 1.43mi |
Listing history 11 events
-
2026-06-18days on market $79,000 Active 15 DOM
-
2026-06-17days on market $79,000 Active 14 DOM
-
2026-06-16days on market $79,000 Active 13 DOM
-
2026-06-15days on market $79,000 Active 12 DOM
-
2026-06-14days on market $79,000 Active 10 DOM
-
2026-06-13days on market $79,000 Active 9 DOM
-
2026-06-10days on market $79,000 Active 7 DOM
-
2026-06-09days on market $79,000 Active 6 DOM
-
2026-06-08days on market $79,000 Active 5 DOM
-
2026-06-07days on market $79,000 Active 4 DOM
-
2026-06-05$79,000 Active 1 DOM
ⓘ Source: listings_history table (triggers on properties + properties_extension) + one-shot
backfill from property_details.listing_events for pre-trigger history.
Climate risk First Street
- Flood 1/10 Low FEMA zone X (unshaded) · 0% chance over 30 yrs
- Wildfire 3/10 Moderate
- Heat 10/10 Extreme 7 d/yr ≥106°F today · 22 d/yr by 30 yrs out
- Wind 10/10 Extreme 99% chance of damaging wind over 30 yrs
- Air quality 2/10 Low 1 unhealthy d/yr today · 1 by 30 yrs out
Nearby sold comps map
Loading sold comps map…
Walkable amenities ~0.75 mi
Loading nearby amenities…
Taxation est. · year 1
- Rental income
- $23,595
- − Mortgage interest
- −$4,425
- − Property taxes
- −$1,185
- − Insurance
- −$395
- − Repairs & maintenance
- −$1,888
- − Management
- −$1,888
- − Depreciation
- −$2,298
- Taxable income
- $11,516
- Est. tax owed @ 24.0%
- −$2,764
- After-tax cash flow
- $9,325/yr
For passive investors: Depreciation is non-cash, so a rental often shows a tax loss while cash-flowing — sheltering income. Rental losses are passive: they offset passive income freely, and up to $25,000/yr can offset ordinary (W-2) income if you actively participate and your MAGI is under $100k (phasing out to $0 by $150k); unused losses carry forward. On sale, claimed depreciation is recaptured at up to 25%, and gains may owe capital-gains tax (a 1031 exchange can defer both). Figures are a year-1 estimate at your 24.0% rate — not tax advice; consult a CPA.
Condition & rehab AI · 13 photos
The home is in fair condition with moderate repairs needed, particularly to the exterior siding and roof. Painting and landscaping can significantly improve its value.
Repairs flagged
- Moderate exterior siding — Weathered and peeling
- Major roof — No visible roof in the photos, but likely needs replacement
Value-add opportunities
- Both painting — Fresh paint can improve curb appeal and interior aesthetics
- Both landscaping — Well-maintained landscaping can enhance curb appeal and property value
Renovation cost estimate screening
| Repair item | Severity | Est. cost |
|---|---|---|
| exterior siding · Weathered and peeling | Moderate | $3,000–15,000 |
| roof · No visible roof in the photos, but likely needs replacement | Major | $15,000–50,000 |
| Total estimated repair cost · 2 items | $18,000–65,000 |
Value-add ROI direction
- Both painting — Fresh paint can improve curb appeal and interior aesthetics ↑
- Both landscaping — Well-maintained landscaping can enhance curb appeal and property value ↑
ⓘ Cost ranges are severity-bucket heuristics (US national rule-of-thumb). Get contractor quotes + a written scope before underwriting a rehab budget.
Schools (NCES district)
- District
- St. Lucie
- NCES district ID
- 1201770
- Math proficiency
- 40% ▼ -11.00%
- Reading proficiency
- 48% ▼ -4.00%
- Median HH income
- $44,737
- Composite
- 37.28/100
- National rank
- #4449
- State rank
- #51 of 73 in FL
Livability — Port St. Lucie
No livability data for this city. (Only ~50 U.S. cities are tracked.)
Census & demographics
- Census place
- Port St. Lucie, FL
- County
- Saint Lucie County · 337,150 people
- City population
- 221,051
- Metro
- Port St. Lucie, FL
- Population (ZIP)
- 42,655
- Household income
- $61,628
- Rent vs Own
- Severe rent burden
- 1759.0
Population outlook (St. Lucie County) Hauer SSP2
- Today (2025)
- 338,016 people
- By 2030
- 355,687 · +5.2%
- By 2040
- 385,521 · +14.1%
- By 2050
- 406,106 · +20.1%
- By 2075
- 441,054 · +30.5%
- By 2100
- 436,885 · +29.2%
Race, ethnicity, and origin ACS 2023
- Neighborhood character
- Diverse neighborhood (Simpson 0.57)
- Race & ethnicity
- White 62% Hispanic / Latino 19% Two or more races 14% Black 10% Asian 3%
- Hispanic origin (detail)
- Mexican 4% Puerto Rican 4% Cuban 2% Dominican 2%
- Common ancestry
- Romanian 3% Lithuanian 2% Hispanic 1%
- Foreign-born
- 18% · Canada, Jamaica, China
- Languages at home
- 76% English-only · Spanish 16% French/Haitian/Cajun 3% Tagalog/Filipino 2%
Political lean MEDSL · St. Lucie
- 2024 margin
- Lean R (+9.1) · D 45.1% · R 54.2%
- 2008→2024 swing
- -21.2pp toward R · 2008: 12.1pp · 2024: -9.1pp
- All cycles
- 2024: R+9.1 2020: R+1.6 2016: R+2.5 2012: D+7.9 2008: D+12.1
Not yet ingested
- Civics
- —
Market trends
- HPI YoY
- ▼ -155.80%
- Current HPI
- 371.0573
- Rent YoY
- ▲ 1.92%
- Metro
- Port St. Lucie, FL
- State GDP YoY
- ▲ 3.28%
- F500 in state
- 36
Industry mix (Fortune 500 HQ in FL)
| Industry | F500 HQs | Revenue |
|---|---|---|
| Industrial Technology | 2 | $29B |
|
||
| Insurance | 2 | $17B |
|
||
| Retail | 1 | $60B |
|
||
| Technology Distribution | 1 | $58B |
|
||
| Homebuilding | 1 | $35B |
|
||
| Technology Manufacturing | 1 | $35B |
|
||
Price history
-7.1% since first listed4 events — show timeline
- 2026-06-03 Listed $79,000 Beaches MLS
- 2026-05-08 Listing Removed — Beaches MLS
- 2026-03-02 Price Changed $79,000 Beaches MLS
- 2026-02-08 Listed $85,000 Beaches MLS
Cash-flow waterfall
monthlySold comps — $/sqft
last 12 mo · ≤1 miLoading sold comps…