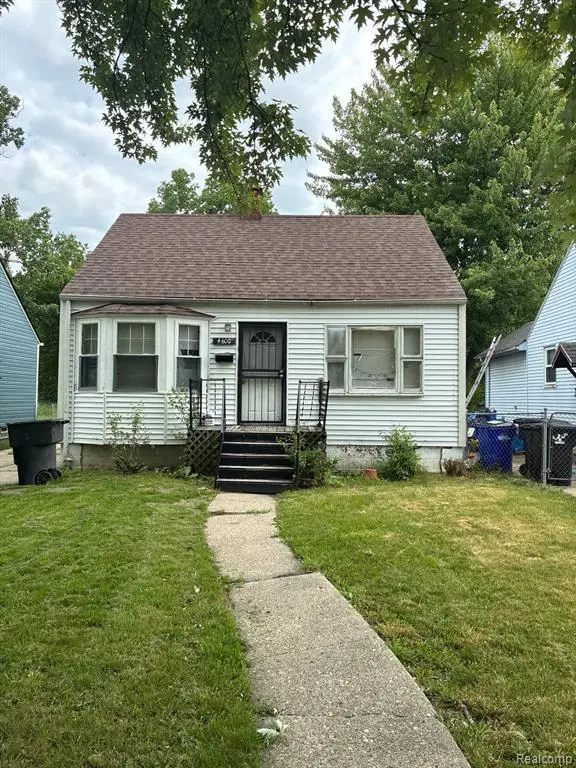
4600 Neff Ave · Detroit, MI
Flood risk 1/10 · Minimal
- FEMA flood zone
- X (unshaded)
- Chance of flooding over 30 yrs
- 0.0%
- Est. flood insurance / yr
- $473 – $860
Fire risk 1/10 · Minimal
- Est. fire insurance / yr
- $784 – $1,456
Heat risk 3/10 · Minor
- Hot days now (above 96°F)
- 7 days/yr
- Hot days in 30 yrs
- 14 days/yr
Wind risk 2/10 · Minimal
- Chance of severe wind over 30 yrs
- —
Air-quality risk 3/10 · Minor
- Unhealthy air days now
- 3 days/yr
- Unhealthy air days in 30 yrs
- 4 days/yr
Risk factors via First Street. Map © Google.
Why this score? — see what drove the B+ grade
The composite is a weighted blend of 9 inputs, each scored 0–100. Each bar is that input's sub-score; the figure is the points it added to the 100-point composite (weight × sub-score).
- Cash flow +30.0/30.0
- ARV discount +15.0/15.0
- 1% rule +10.0/10.0
- DSCR +10.0/10.0
- Livability +3.7/5.0
- Rent growth +2.7/5.0
- Condition / age +2.5/5.0
- Schools +1.3/10.0
- Appreciation +0.0/10.0
$55,000
🖨 Deal sheet (PDF) 📄 Offer letter ✓ Due diligence
Listing remarks
GREAT LOCATION BETWEEN MORNIGSIDE AND GROSSE POINTE AREA. STRONG RENTAL POTENCIAL.
Key facts
- 6,098 sq ft lot
- Garage
- Built 1943
Property features AI
Finance
- Other: Property located in the city of Detroit (Brown Investment Co subdivision); Directions: Neff between Mack Ave and E Warren Ave
Exterior
- Parking: Detached garage with 1 parking space
- Utilities: Public water; Natural gas; Forced air heating
- Home design: Residential property; 1 1/2-story structure; Built in 1943; Basement foundation
- Construction: Steel construction; Basement foundation; Built in 1943
- Exterior features: Steel exterior construction; Paved street access; Frontage approximately 35 feet
Interior
- Bedrooms: Bedroom 1 (entry level) — 10 x 10, carpet; Bedroom 2 (entry level) — 10 x 8, carpet; Bedroom 3 (second level) — approx. 13' wide, carpet
- Flooring: Carpet in bedrooms; Ceramic tile in bathroom
- Bathrooms: 1 full bathroom (entry level) — ceramic floor, approx. 8 x 8
- Heating & cooling: Forced air heating; Natural gas fuel
- Interior features: Total of 4 rooms; Unfinished basement
Neighborhood map
What this means for you Summary
Snapshot
- This is a 3-bed/1.0-bath single-family listed at $55k.
Deal economics
- At list price, monthly cash flow is $686 ($8k/yr) — positive.
- The deal already cash-flows at list — no discount required.
- Meets the 1% rule at list price ($1k rent vs $55k).
- Cap rate 21.3% vs local median 10.2% in Detroit — top-decile yield for the area; either an underpriced asset or a hidden risk that comps aren't pricing in. Stress-test before assuming the spread holds.
Location & tenants
- Location reads 73/100 on livability (#218 in MI) — a middle-class / working-renter tenant base. Strengths: amenities A+, commute A+, cost of living A+; Watch: schools F, crime F, employment F.
- Detroit Public Schools Community District (urban): math 10% / reading 24% proficiency, ranked #499 of 540 in MI (top 92%) — low school quality limits family demand, transient renter base, plan for 1-2y turnover; 90% free/reduced lunch — lower-income household profile, screen leases tightly.
- Market conditions: Rents flat; 484 active listings in the ZIP; 39 comparable units currently listed for rent nearby; rentals at typical pace (median 25d on market — plan ~3-4 weeks tenant-placement turnaround); 41% of comp listings sitting > 30 days — soft ceiling on asking rent; lower-income renter base — watch delinquency; 2,639 units permitted in Wayne County in 2024 (1,216 in 5+ unit buildings).
- This rent runs 36% of the median local income ($45k/yr) — at the standard rent-burdened threshold; future hikes will face affordability resistance.
Forward outlook
- Local home prices are declining (-3.0%/yr); year-one equity from $380 of loan paydown is wiped out by about $2k of value loss. Plan a longer hold.
- Wayne County population projected at -17% by 2050 — secular population decline; favor cash flow + early exit over multi-decade hold.
- At projected returns (-3.0% appreciation + 0.7% rent growth), your $15k cash investment doubles in ~3 years — after that, you're playing with house money.
Negotiation context
- Only 4 days on market — expect competitive offers; lowballing is unlikely to land.
- 13 sale attempts since 20y ago with the ask held roughly flat each time — persistent listings suggest the price (not the market) is what's stuck; bring a comps-based counter.
Risks & watch-outs
- Watch-outs: built in 1943 — expect roof / HVAC / electrical / plumbing capex.
Questions for the listing agent
- Built in 1943 — when were the roof, HVAC, electrical panel, plumbing, and water heater last replaced?
- Is there a deadline driving the sale (1031 exchange, divorce, estate, relocation)? That informs how much negotiation room exists.
- Schools are F-rated, which usually means shorter tenancies and higher turnover. Who's the typical renter profile here, and what's been the actual vacancy rate?
- Crime grade is F in this area — have there been break-ins, vandalism, or insurance claims at this property in the last 3 years? What carrier currently insures it and at what premium?
- What's the average days-on-market for RENTAL listings here right now (not sales)? A rising rental-DOM trend means longer vacancies and softer asking-rent achievability than the comps imply.
- What's the recent tenant-quality profile in this submarket — average credit score on applications, eviction rate, late-payment / NSF rate, and stable-employment percentage? A property-management company in the area should have these aggregated.
- How much new for-sale + rental construction is in the pipeline within 1–3 miles? Heavy new supply typically softens prices + rents 12–24 months out; constrained supply supports both.
Investment metrics
- 1% rule
- 2.45% ✓
- Cap rate
- 21.27%
- Cash-on-cash
- 53.49%
- DSCR
- 3.38
- GRM
- 3.4
CMA / ARV
- ARV (on-the-fly)
- $70,146
- Comps found
- 12
Show comp detail 12 sales within ~0.75 mi
| Address | Dist | Beds/Ba | Sqft | Sold | Price | $/sf | Match |
|---|---|---|---|---|---|---|---|
| 4236 Cadieux Rd | 0.39mi | 3/1.0 | 849 (-2%) | 7mo | $77,500 | $91 | 73 |
| 5203 Marseilles St | 0.34mi | 3/1.0 | 816 (-6%) | 7mo | $77,500 | $95 | 68 |
| 4356 Harvard Rd | 0.38mi | 3/2.0 | 921 (+6%) | 1mo | $150,000 | $163 | 67 |
| 3950 Cadieux Rd | 0.49mi | 2/1.0 (-1) | 900 (+4%) | 0mo | $30,000 | $33 | 65 |
| 4515 Hereford St | 0.10mi | 3/1.5 | 984 (+14%) | 7mo | $75,000 | $76 | 65 |
| 5243 Neff Ave | 0.34mi | 2/1.0 (-1) | 816 (-6%) | 7mo | $85,000 | $104 | 64 |
| 4138 University Pl | 0.29mi | 3/1.0 | 780 (-10%) | 7mo | $77,500 | $99 | 64 |
| 4163 University Pl | 0.26mi | 3/1.0 | 975 (+13%) | 7mo | $75,000 | $77 | 61 |
| 4481 Radnor St | 0.36mi | 2/1.0 (-1) | 792 (-8%) | 5mo | $32,000 | $40 | 60 |
| 5243 Marseilles St | 0.37mi | 3/1.0 | 961 (+11%) | 7mo | $77,500 | $81 | 58 |
| 5007 Ashley St | 0.72mi | 2/1.0 (-1) | 817 (-6%) | 2mo | $30,000 | $37 | 50 |
| 5955 Guilford St | 0.73mi | 3/1.0 | 802 (-7%) | 6mo | $43,000 | $54 | 49 |
Match score weights: distance 35% · size 25% · config 20% · recency 20%. Top-matched comps best support the ARV.
Projected returns pro-forma
-3.0% appreciation · 0.73% rent growth · sell at horizon
- IRR
- 49.0%
- Equity multiple
- 3.07×
- Total profit
- $31,813
- Equity at exit
- $8,201
- IRR
- 53.6%
- Equity multiple
- 5.69×
- Total profit
- $72,259
- Equity at exit
- $4,755
Cash invested: $15,400 (down + closing). Projections, not guarantees.
Landlord ↔ Tenant lean methodology
- Overall (STATE)
- 62 Landlord-Friendly
- State Michigan
- 62 Landlord-Friendly · EVEN
- County
- — inherits STATE
- City
- — inherits STATE
ZIP-level market 48224
- Rents YoY
- 0.7%
- Active inventory
- 484
- Price-to-rent
- 3.4×
Monthly cashflow live
- Estimated rent
- $1,350 high interval (Pro) →
- Mortgage (P&I)
- −$288
- Tax est. 1.5%
- −$69 /mo · $825/yr
- Insurance
- −$23
- HOA
- −$0
- Vacancy / Maint / Mgmt
- −$284
- Net cashflow
- $686
Break-even live
Sensitivity live
| Price | -10% $724 | -5% $705 | +0% $686 | +5% $667 | +10% $648 |
|---|---|---|---|---|---|
| Rent | -10% $580 | -5% $633 | +0% $686 | +5% $740 | +10% $793 |
| Rate | -1.0pp $714 | -0.5pp $700 | base $686 | +0.5pp $672 | +1.0pp $658 |
UW: 25.0% down · 7.5% · 30yr · 1.5% tax · 5.0% vac · 8.0% maint · 8.0% mgmt
Financing live
Cash to close
- Down payment
- $13,750
- Closing costs
- $1,650
- Reserves months
- —
- Total cash needed
- —
Loan-product check · same deal, 3 products live
Conventional
25% down · 7.5% · 30yr
- Down + closing
- —
- Monthly P&I
- —
- Monthly cashflow
- —
- DSCR
- —
- Eligible?
- —
Personal DTI + credit; lowest rate.
DSCR
20% down · 8.5% · 30yr
- Down + closing
- —
- Monthly P&I
- —
- Monthly cashflow
- —
- DSCR
- —
- Eligible?
- —
No personal income docs; deal must DSCR.
Hard money
10% down · 12.0% · 12mo
- Down + closing
- —
- Monthly P&I
- —
- Monthly cashflow
- —
- DSCR
- —
- Eligible?
- —
Short-term bridge; refi at stabilization.
Rent comps 39 comps
| Address | Beds | Baths | Sqft | Rent | $/sqft | DOM | Units | Dist |
|---|---|---|---|---|---|---|---|---|
| 17137 Ontario St Unit 1 Detroit, MI | 2.0 | 1.0 | 982 | $1,123 | $1.14 | 25d | 1 | 0.27mi |
| 4811 Cadieux Rd Unit 11 Detroit, MI | 2.0 | 1.0 | 663 | $1,200 | $1.81 | 22d | 1 | 0.33mi |
| 4811 Cadieux Rd Unit 10 Detroit, MI | 2.0 | 1.0 | 663 | $1,200 | $1.81 | 44d | 1 | 0.33mi |
| 4837 Cadieux Rd Unit 9 Detroit, MI | 2.0 | 1.0 | 650 | $1,200 | $1.85 | 44d | 1 | 0.33mi |
| 4865 Cadieux Rd Unit 11 Detroit, MI | 2.0 | 1.0 | 630 | $1,200 | $1.90 | 44d | 1 | 0.34mi |
| 890 Neff Rd Grosse Pointe, MI | 2.0 | 1.0 | 1100 | $2,000 | $1.82 | 25d | 1 | 0.63mi |
| 5786 Neff Ave Detroit, MI | 3.0 | 1.5 | 1100 | $1,225 | $1.11 | 17d | 1 | 0.63mi |
| 5915 Farmbrook St Detroit, MI | 3.0 | 1.5 | 1000 | $1,250 | $1.25 | 25d | 1 | 0.73mi |
| 5955 Guilford St Detroit, MI | 3.0 | 1.0 | 802 | $1,400 | $1.75 | 18d | 1 | 0.74mi |
| 5783 Yorkshire Rd Detroit, MI | 2.0 | 1.0 | 1040 | $1,200 | $1.15 | 44d | 1 | 0.85mi |
| 6181 Neff Ave Detroit, MI | 3.0 | 1.0 | 1102 | $1,299 | $1.18 | 18d | 1 | 0.87mi |
| 6175 Marseilles St Detroit, MI | 3.0 | 1.0 | 1100 | $1,100 | $1.00 | 44d | 1 | 0.88mi |
| 6304 Bluehill St Detroit, MI | 3.0 | 1.0 | 1088 | $1,500 | $1.38 | 44d | 1 | 0.94mi |
| 6325 Neff Ave Detroit, MI | 3.0 | 1.0 | 1000 | $1,500 | $1.50 | 3d | 1 | 0.94mi |
| 22144 Moross Rd Grosse Pointe, MI | 2.0 | 1.0 | 819 | $1,350 | $1.65 | 3d | 1 | 0.95mi |
| 22144 Moross Rd Grosse Pointe, MI | 2.0 | 1.0 | 819 | $1,350 | $1.65 | 18d | 1 | 0.95mi |
| 22148 Moross Rd Grosse Pointe, MI | 2.0 | 1.0 | 819 | $1,250 | $1.53 | 3d | 1 | 0.95mi |
| 22148 Moross Rd Grosse Pointe, MI | 2.0 | 1.0 | 819 | $1,250 | $1.53 | 18d | 1 | 0.95mi |
| 6301 Lodewyck St Detroit, MI | 3.0 | 1.0 | 1084 | $1,300 | $1.20 | 13d | 1 | 0.95mi |
| 5028 Bedford St Detroit, MI | 3.0 | 1.0 | 1000 | $1,400 | $1.40 | 5d | 1 | 0.95mi |
| 4627 Bedford St Unit 1 Detroit, MI | 2.0 | 1.0 | 1050 | $945 | $0.90 | 20d | 1 | 0.96mi |
| 5031 Bedford St Detroit, MI | 2.0 | 1.0 | 876 | $1,870 | $2.13 | 0d | 1 | 0.98mi |
| 17710 Chester St Detroit, MI | 2.0 | 1.0 | 984 | $1,250 | $1.27 | 44d | 1 | 1.01mi |
| 17720 Chester St Detroit, MI | 2.0 | 1.0 | 986 | $1,250 | $1.27 | 44d | 1 | 1.01mi |
| 5284 Devonshire Rd Detroit, MI | 2.0 | 1.0 | 650 | $1,050 | $1.62 | 25d | 1 | 1.05mi |
| 5112 Haverhill St Unit 1 Detroit, MI | 2.0 | 1.0 | 1000 | $1,100 | $1.10 | 44d | 1 | 1.07mi |
| 21401 Kingsville St Harper Woods, MI | 2.0 | 1.0 | 944 | $1,200 | $1.27 | 25d | 1 | 1.22mi |
| 5235 Chatsworth St Detroit, MI | 2.0 | 1.0 | 900 | $1,050 | $1.17 | 44d | 1 | 1.27mi |
| 10542 Lanark St Detroit, MI | 3.0 | 1.0 | 1023 | $1,250 | $1.22 | 44d | 1 | 1.29mi |
| 10037 Grayton St Detroit, MI | 3.0 | 1.0 | 1000 | $1,400 | $1.40 | 4d | 1 | 1.30mi |
| 19203 Edgefield St Harper Woods, MI | 2.0 | 1.0 | 1100 | $1,100 | $1.00 | 25d | 1 | 1.33mi |
| 542 Neff Ln Grosse Pointe, MI | 2.0 | 1.0 | 900 | $1,595 | $1.77 | 44d | 1 | 1.33mi |
| 10177 Boleyn St Detroit, MI | 3.0 | 1.0 | 767 | $1,250 | $1.63 | 44d | 1 | 1.35mi |
| 10370 Britain St Detroit, MI | 3.0 | 1.0 | 1100 | $1,100 | $1.00 | 44d | 1 | 1.37mi |
| 10400 Britain St Detroit, MI | 3.0 | 1.0 | 890 | $1,100 | $1.24 | 44d | 1 | 1.39mi |
| 509 Saint Clair Ave Grosse Pointe, MI | 2.0 | 1.0 | 1000 | $1,300 | $1.30 | 44d | 1 | 1.40mi |
| 4391 Nottingham Rd Unit 4393 Detroit, MI | 2.0 | 1.0 | 1038 | $950 | $0.92 | 5d | 1 | 1.42mi |
| 10692 Meuse St Detroit, MI | 3.0 | 1.0 | 955 | $1,250 | $1.31 | 13d | 1 | 1.43mi |
| 4151 Nottingham Rd Detroit, MI | 2.0 | 1.0 | 1022 | $1,275 | $1.25 | 18d | 1 | 1.44mi |
Listing history 7 events
-
2026-06-18days on market $55,000 Active 4 DOM
-
2026-06-17days on market $55,000 Active 3 DOM
-
2026-06-16days on market $55,000 Active 2 DOM
-
2026-06-15days on market $55,000 Active 1 DOM
-
2026-06-15days on market $55,000 Active 3 DOM
-
2026-06-13remarks 82-char remark
-
2026-06-13$55,000 Active 1 DOM
ⓘ Source: listings_history table (triggers on properties + properties_extension) + one-shot
backfill from property_details.listing_events for pre-trigger history.
Climate risk First Street
- Flood 1/10 Low FEMA zone X (unshaded) · 0% chance over 30 yrs
- Wildfire 1/10 Low
- Heat 3/10 Moderate 7 d/yr ≥96°F today · 14 d/yr by 30 yrs out
- Wind 2/10 Low
- Air quality 3/10 Moderate 3 unhealthy d/yr today · 4 by 30 yrs out
Nearby sold comps map
Loading sold comps map…
Walkable amenities ~0.75 mi
Loading nearby amenities…
Taxation est. · year 1
- Rental income
- $16,201
- − Mortgage interest
- −$3,081
- − Property taxes
- −$825
- − Insurance
- −$275
- − Repairs & maintenance
- −$1,296
- − Management
- −$1,296
- − Depreciation
- −$1,600
- Taxable income
- $7,828
- Est. tax owed @ 24.0%
- −$1,879
- After-tax cash flow
- $6,359/yr
For passive investors: Depreciation is non-cash, so a rental often shows a tax loss while cash-flowing — sheltering income. Rental losses are passive: they offset passive income freely, and up to $25,000/yr can offset ordinary (W-2) income if you actively participate and your MAGI is under $100k (phasing out to $0 by $150k); unused losses carry forward. On sale, claimed depreciation is recaptured at up to 25%, and gains may owe capital-gains tax (a 1031 exchange can defer both). Figures are a year-1 estimate at your 24.0% rate — not tax advice; consult a CPA.
Schools (NCES district)
- District
- Detroit Public Schools Community District
- NCES district ID
- 2601103
- Math proficiency
- 10% ▼ -2.00%
- Reading proficiency
- 24% ▲ 6.00%
- Median HH income
- $25,815
- Composite
- 13.06/100
- National rank
- #9564
- State rank
- #499 of 540 in MI
Livability — Detroit
- Score
- 73/100
- State rank
- #218
- US rank
- #5427
Category grades
Schools grade is shown separately in the Schools card above.
Census & demographics
- Census place
- Detroit, MI
- County
- Wayne County · 1,562,939 people
- City population
- 572,865
- Metro
- Detroit-Warren-Dearborn, MI
- Population (ZIP)
- 39,668
- Household income
- $44,856
- Rent vs Own
- Severe rent burden
- 2515.0
Population outlook (Wayne County) Hauer SSP2
- Today (2025)
- 1,675,273 people
- By 2030
- 1,620,300 · -3.3%
- By 2040
- 1,502,341 · -10.3%
- By 2050
- 1,384,039 · -17.4%
- By 2075
- 1,124,592 · -32.9%
- By 2100
- 881,193 · -47.4%
Race, ethnicity, and origin ACS 2023
- Neighborhood character
- Predominantly Black (88%)
- Race & ethnicity
- Black 88% White 8% Two or more races 3% Hispanic / Latino 1%
- Common ancestry
- Iranian 1% Romanian 1% Lithuanian 1%
- Foreign-born
- 1%
- Languages at home
- 97% English-only · Spanish 2%
Political lean MEDSL · Wayne
- 2024 margin
- Strong D (+29.0) · D 62.7% · R 33.7% · Other 3.6%
- 2008→2024 swing
- -20.5pp toward R · 2008: 49.5pp · 2024: 29.0pp
- All cycles
- 2024: D+29.0 2020: D+38.1 2016: D+37.3 2012: D+46.9 2008: D+49.5
Not yet ingested
- Civics
- —
Market trends
- HPI YoY
- ▼ -226.38%
- Current HPI
- 161.886
- Rent YoY
- ▲ 0.73%
- Metro
- Detroit-Warren-Dearborn, MI
- State GDP YoY
- ▲ 1.37%
- F500 in state
- 28
Industry mix (Fortune 500 HQ in MI)
| Industry | F500 HQs | Revenue |
|---|---|---|
| Automotive Parts | 3 | $48B |
|
||
| Automotive | 2 | $372B |
|
||
| Chemicals | 1 | $45B |
|
||
| Automotive Retail | 1 | $29B |
|
||
| Healthcare / Medical Devices | 1 | $23B |
|
||
| Automotive Technology | 1 | $20B |
|
||
Price history
+90.6% since first listed37 events — show timeline
- 2026-06-12 Listed $55,000 MiRealSource-MiMLS
- 2025-01-22 Listing Removed — REALCOMP
- 2025-01-21 Listing Removed — MiRealSource-MiMLS
- 2024-09-20 Listed $65,000 MiRealSource-MiMLS
- 2024-09-20 Listed $65,000 REALCOMP
- 2024-09-01 Listing Removed — MiRealSource-MiMLS
- 2024-08-31 Listing Removed — REALCOMP
- 2024-05-13 Listed $65,000 MiRealSource-MiMLS
- 2024-05-13 Listed $65,000 REALCOMP
- 2021-12-08 Sold (Public Records) $90,000 Public Records
- 2020-07-31 Sold (MLS) $15,000 MiRealSource-MiMLS
- 2020-07-31 Sold (MLS) $15,000 REALCOMP
- 2020-07-08 Pending — MiRealSource-MiMLS
- 2020-07-08 Pending — REALCOMP
- 2020-07-01 Price Changed $15,000 MiRealSource-MiMLS
- 2020-07-01 Price Changed $15,000 REALCOMP
- 2020-03-06 Price Changed $18,000 MiRealSource-MiMLS
- 2020-03-05 Price Changed $18,000 REALCOMP
- 2020-02-12 Price Changed $20,000 MiRealSource-MiMLS
- 2020-02-11 Price Changed $20,000 REALCOMP
- 2019-09-17 Listed $34,000 MiRealSource-MiMLS
- 2019-09-17 Listed $34,000 REALCOMP
- 2018-07-16 Sold (MLS) $10,925 MiRealSource-MiMLS
- 2018-07-16 Sold (MLS) $10,925 REALCOMP
- 2018-05-16 Pending — REALCOMP
- 2018-05-16 Listed $11,500 MiRealSource-MiMLS
- 2018-05-16 Listing Removed — MiRealSource-MiMLS
- 2018-05-16 Listed $11,500 REALCOMP
- 2006-11-22 Listing Removed — REALCOMP
- 2006-11-22 Listing Removed — MiRealSource-MiMLS
- 2006-11-21 Listed $49,995 REALCOMP
- 2006-11-21 Listed $49,995 MiRealSource-MiMLS
- 2006-11-20 Listing Removed — REALCOMP
- 2006-11-20 Listing Removed — MiRealSource-MiMLS
- 2006-07-10 Listed $49,995 REALCOMP
- 2006-07-10 Listed $49,995 MiRealSource-MiMLS
- 1992-07-30 Sold (Public Records) $28,850 Public Records
Property tax history
+6.6%/yrLatest (2025): $3,019 · +45.0% YoY. Source: county tax records.
Cash-flow waterfall
monthlySold comps — $/sqft
last 12 mo · ≤1 miLoading sold comps…