 🏗️ New Construction
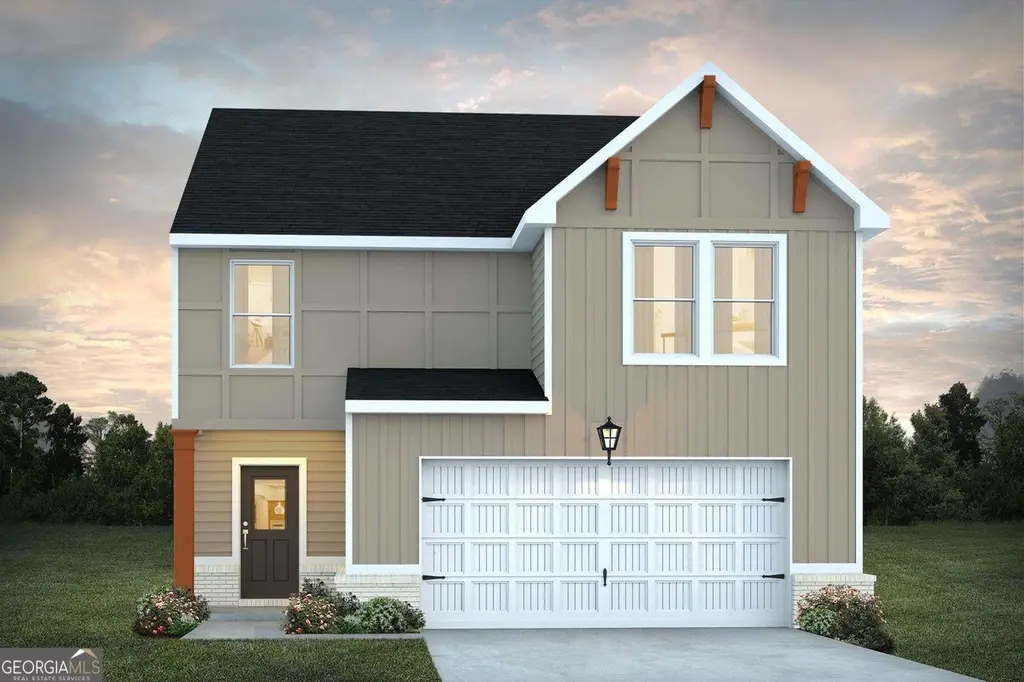
105 Weldon Rd · Stockbridge, GA
Flood risk No data
- FEMA flood zone
- —
- Chance of flooding over 30 yrs
- —
- Est. flood insurance / yr
- —
Fire risk No data
- Est. fire insurance / yr
- —
Heat risk No data
- Hot days now (above threshold)
- —
- Hot days in 30 yrs
- —
Wind risk No data
- Chance of severe wind over 30 yrs
- —
Air-quality risk No data
- Unhealthy air days now
- —
- Unhealthy air days in 30 yrs
- —
Risk factors via First Street. Map © Google.
Why this score? — see what drove the F grade
The composite is a weighted blend of 9 inputs, each scored 0–100. Each bar is that input's sub-score; the figure is the points it added to the 100-point composite (weight × sub-score).
- Cash flow +11.3/30.0
- ARV discount +7.5/15.0
- DSCR +3.3/10.0
- Livability +3.0/5.0
- Schools +2.6/10.0
- Condition / age +2.5/5.0
- Rent growth +2.4/5.0
- 1% rule +2.1/10.0
- Appreciation +0.0/10.0
$343,490
🖨 Deal sheet 📄 Offer letter ✓ Due diligence
Listing remarks
The choice of the Winston plan is a no-brainer. The large family room flows into the kitchen and dining area providing the perfect place to unwind or entertain. Upstairs, you'll find four spacious bedrooms and the primary suite, all with generous closet space.
Key facts
- 7,840 sq ft lot
- Garage
- Built 2026
Neighborhood map
What this means for you Summary
Snapshot
- This is a 5-bed/3.5-bath single-family listed at $343k.
Deal economics
- At list price, monthly cash flow is $-133 ($-2k/yr) — negative.
- The deal already cash-flows at list — no discount required.
- To meet the 1% rule (rent ≥ 1% of price), the offer needs to be $262k (23.8% below list).
- Recommended offer: $262k (23.8% below list) — sets the bar for 1% rule.
- Cap rate 5.9% vs local median 4.3% in Stockbridge — top-decile yield for the area; either an underpriced asset or a hidden risk that comps aren't pricing in. Stress-test before assuming the spread holds.
Location & tenants
- Location reads 60/100 on livability (#389 in GA) — a middle-class / working-renter tenant base. Strengths: housing A+, cost of living A; Watch: crime D, amenities F, commute F.
- Henry County (rural): math 24% / reading 33% proficiency, ranked #89 of 174 in GA (top 51%) — low school quality limits family demand, transient renter base, plan for 1-2y turnover.
- Zoned schools: Flippen Elementary School (math 17% / reading 26%, grade F, #845 of 1,228 statewide, top 69%, 570 students, 57% FRL); Eagle'S Landing Middle School (math 16% / reading 33%, grade F, #301 of 470 statewide, top 66%, 1,092 students, 59% FRL); Eagle'S Landing High School (math 18% / reading 22%, grade F, #232 of 424 statewide, top 56%, 1,642 students, 48% FRL).
- Market conditions: Rents soft (-0.3%/yr); 663 active listings in the ZIP; 20 comparable units currently listed for rent nearby; rentals lingering (median 44d on market — plan ~5-8 weeks vacancy on turnover, expect pricing pressure); 50% of comp listings sitting > 30 days — soft ceiling on asking rent; solid renter incomes; 1,989 units permitted in Henry County in 2024 (92 in 5+ unit buildings).
- This rent runs 38% of the median local income ($82k/yr) — at the standard rent-burdened threshold; future hikes will face affordability resistance.
Forward outlook
- Local home prices are declining (-3.0%/yr); year-one equity from $3k of loan paydown is wiped out by about $11k of value loss. Plan a longer hold.
- Henry County population projected at +29% by 2050 — long-run rental-demand tailwind backs the buy-and-hold thesis.
Negotiation context
- Only 0 days on market — expect competitive offers; lowballing is unlikely to land.
Questions for the listing agent
- What do current leases actually rent for vs. the listed asking? Can we see a recent rent roll and the last 12 months of T-12 income?
- What does the HOA fee cover, when was the last increase, and are there any pending special assessments or reserve-fund shortfalls?
- Is there a deadline driving the sale (1031 exchange, divorce, estate, relocation)? That informs how much negotiation room exists.
- Schools are D-rated, which usually means shorter tenancies and higher turnover. Who's the typical renter profile here, and what's been the actual vacancy rate?
- Crime grade is D in this area — have there been break-ins, vandalism, or insurance claims at this property in the last 3 years? What carrier currently insures it and at what premium?
- The area grade is low — what's the realistic commute time and amenity access for the typical tenant pool here? Any planned neighborhood developments (good or bad) we should know about?
- What's the average days-on-market for RENTAL listings here right now (not sales)? A rising rental-DOM trend means longer vacancies and softer asking-rent achievability than the comps imply.
- What's the recent tenant-quality profile in this submarket — average credit score on applications, eviction rate, late-payment / NSF rate, and stable-employment percentage? A property-management company in the area should have these aggregated.
- How much new for-sale + rental construction is in the pipeline within 1–3 miles? Heavy new supply typically softens prices + rents 12–24 months out; constrained supply supports both.
Investment metrics
- 1% rule
- 0.71% ✗
- Cap rate
- 5.86%
- Cash-on-cash
- -1.55%
- DSCR
- 0.93
- GRM
- 11.7
CMA / ARV
- ARV (on-the-fly)
- $367,650
- Comps found
- 12
Show comp detail 12 sales within ~0.75 mi
| Address | Dist | Beds/Ba | Sqft | Sold | Price | $/sf | Match |
|---|---|---|---|---|---|---|---|
| 117 Weldon Rd #66 | 0.03mi | 5/3.5 | 2,150 (0%) | 1mo | $341,989 | $159 | 98 |
| 117 Weldon Rd | 0.03mi | 5/3.5 | 2,150 (0%) | 1mo | $341,990 | $159 | 98 |
| 128 Weldon Rd | 0.07mi | 5/3.5 | 2,150 (0%) | 1mo | $350,000 | $163 | 96 |
| 145 Weldon Rd | 0.09mi | 5/3.5 | 2,150 (0%) | 3mo | $343,640 | $160 | 94 |
| 136 NE Weldon Rd | 0.09mi | 5/3.5 | 2,150 (0%) | 4mo | $335,490 | $156 | 93 |
| 136 Weldon Rd #10 | 0.09mi | 5/3.5 | 2,150 (0%) | 4mo | $335,490 | $156 | 93 |
| 113 Weldon Rd | 0.02mi | 4/2.5 (-1) | 1,900 (-12%) | 1mo | $336,640 | $177 | 70 |
| 125 Weldon Rd | 0.05mi | 4/2.5 (-1) | 1,900 (-12%) | 1mo | $336,090 | $177 | 69 |
| 125 Weldon Rd #64 | 0.05mi | 4/2.5 (-1) | 1,900 (-12%) | 1mo | $336,090 | $177 | 69 |
| 132 Weldon Rd | 0.08mi | 4/2.5 (-1) | 1,919 (-11%) | 1mo | $329,990 | $172 | 69 |
| 112 Weldon Rd | 0.05mi | 4/2.5 (-1) | 1,900 (-12%) | 4mo | $336,490 | $177 | 66 |
| 148 Weldon Rd | 0.11mi | 4/2.5 (-1) | 1,900 (-12%) | 3mo | $324,990 | $171 | 64 |
Match score weights: distance 35% · size 25% · config 20% · recency 20%. Top-matched comps best support the ARV.
Projected returns pro-forma
-3.0% appreciation · 0.0% rent growth · sell at horizon
- IRR
- -21.8%
- Equity multiple
- 0.26×
- Total profit
- $-75,866
- Equity at exit
- $54,818
- IRR
- -23.6%
- Equity multiple
- -0.04×
- Total profit
- $-107,287
- Equity at exit
- $31,788
Cash invested: $102,942 (down + closing). Projections, not guarantees.
Landlord ↔ Tenant lean methodology
- Overall (STATE)
- 90 Strongly Landlord-Friendly
- State Georgia
- 90 Strongly Landlord-Friendly · R+3
- County
- — inherits STATE
- City
- — inherits STATE
ZIP-level market 30253
- Home prices YoY
- -29.4%
- Rents YoY
- -0.3%
- Active inventory
- 663
- Price-to-rent
- 10.9×
Monthly cashflow live
- Estimated rent
- $2,619 high interval (Pro) →
- Mortgage (P&I)
- −$1,928
- Tax from tax record
- −$64 /mo · $774/yr
- Insurance
- −$153
- HOA
- −$56
- Vacancy / Maint / Mgmt
- −$550
- Net cashflow
- $-133
Break-even live
UW: 25.0% down · 7.5% · 30yr · 1.5% tax · 5.0% vac · 8.0% maint · 8.0% mgmt
Financing live
Cash to close
- Down payment
- $91,912
- Closing costs
- $11,030
- Reserves months
- —
- Total cash needed
- —
Loan-product check · same deal, 3 products live
Conventional
25% down · 7.5% · 30yr
- Down + closing
- —
- Monthly P&I
- —
- Monthly cashflow
- —
- DSCR
- —
- Eligible?
- —
Personal DTI + credit; lowest rate.
DSCR
20% down · 8.5% · 30yr
- Down + closing
- —
- Monthly P&I
- —
- Monthly cashflow
- —
- DSCR
- —
- Eligible?
- —
No personal income docs; deal must DSCR.
Hard money
10% down · 12.0% · 12mo
- Down + closing
- —
- Monthly P&I
- —
- Monthly cashflow
- —
- DSCR
- —
- Eligible?
- —
Short-term bridge; refi at stabilization.
Rent comps 20 comps
| Address | Beds | Baths | Sqft | Rent | $/sqft | DOM | Units | Dist |
|---|---|---|---|---|---|---|---|---|
| 181 Weldon Rd McDonough, GA | 5.0 | 3.5 | 2100 | $2,689 | $1.28 | 44d | 1 | 0.19mi |
| 361 Bowfin Trl McDonough, GA | 5.0 | 3.0 | 2759 | $2,850 | $1.03 | 43d | 1 | 0.29mi |
| 190 Greenland Dr McDonough, GA | 4.0 | 2.0 | 2186 | $2,413 | $1.10 | 5d | 1 | 0.30mi |
| 160 Windy Cir McDonough, GA | 4.0 | 2.5 | 2225 | $1,650 | $0.74 | 43d | 1 | 0.35mi |
| 410 Concord Cir McDonough, GA | 4.0 | 2.5 | 2753 | $2,395 | $0.87 | 5d | 1 | 0.41mi |
| 654 Highpoint Way McDonough, GA | 4.0 | 2.5 | 2000 | $2,265 | $1.13 | 24d | 1 | 0.49mi |
| 209 Greenland Ct McDonough, GA | 4.0 | 2.5 | 2311 | $2,199 | $0.95 | 2d | 1 | 0.58mi |
| 511 Gables Ct McDonough, GA | 4.0 | 2.5 | 2352 | $2,165 | $0.92 | 18d | 1 | 0.60mi |
| 713 Holiday Birch Pass McDonough, GA | 4.0 | 2.5 | 1931 | $2,845 | $1.47 | 21d | 1 | 0.67mi |
| 608 Verdant Crane Ct McDonough, GA | 4.0 | 2.5 | 1931 | $2,945 | $1.53 | 43d | 1 | 0.69mi |
| 609 Verdant Crane Ct McDonough, GA | 4.0 | 2.5 | 1931 | $2,920 | $1.51 | 24d | 1 | 0.70mi |
| 915 Castlerock Way McDonough, GA | 4.0 | 3.0 | 1944 | $2,245 | $1.15 | 5d | 1 | 0.71mi |
| 431 Avocet Sea Ln McDonough, GA | 4.0 | 2.5 | 1854 | $2,645 | $1.43 | 43d | 1 | 0.76mi |
| 525 Fiery Warbler St McDonough, GA | 4.0 | 2.5 | 2228 | $3,200 | $1.44 | 43d | 1 | 0.77mi |
| 460 Avocet Sea Ln McDonough, GA | 4.0 | 2.5 | 1833 | $2,655 | $1.45 | 43d | 1 | 0.78mi |
| 632 Verdant Crane Ct McDonough, GA | 4.0 | 2.5 | 1931 | $2,945 | $1.53 | 24d | 1 | 0.78mi |
| 104 Inverrary Ct McDonough, GA | 4.0 | 3.5 | 2583 | $3,300 | $1.28 | 43d | 1 | 0.88mi |
| 483 Chase Marion Way McDonough, GA | 4.0 | 2.5 | 1800 | $1,855 | $1.03 | 43d | 1 | 1.31mi |
| 310 Lakefront Dr McDonough, GA | 4.0 | 2.0 | 2568 | $2,345 | $0.91 | 13d | 1 | 1.37mi |
| 148 Parkside Dr Stockbridge, GA | 4.0 | 2.0 | 1668 | $2,275 | $1.36 | 43d | 1 | 1.46mi |
HOA detail
- Monthly dues
- $56 · $672/yr
Listing history 2 events
-
2026-04-12historical
-
2026-04-11$343,490
ⓘ Source: listings_history table (triggers on properties + properties_extension) + one-shot
backfill from property_details.listing_events for pre-trigger history.
Tax reassessment forecast GA · Resets to sale price
- Current annual tax
- $774 · $64/mo
- Projected year-2 tax
- $3,160 · $263/mo
- Expected delta
- +$2,386/yr (+$199/mo · 308.4%)
ⓘ Screening estimate from a state-policy table — verify with the county assessor before closing.
Nearby sold comps map
Loading sold comps map…
Walkable amenities ~0.75 mi
Loading nearby amenities…
Taxation est. · year 1
- Rental income
- $31,429
- − Mortgage interest
- −$20,594
- − Property taxes
- −$774
- − Insurance
- −$1,838
- − Repairs & maintenance
- −$2,514
- − Management
- −$2,514
- − HOA
- −$672
- − Depreciation
- −$10,695
- Taxable loss
- −$8,173
- Est. tax savings @ 24.0%
- +$1,962
- After-tax cash flow
- $370/yr
For passive investors: Depreciation is non-cash, so a rental often shows a tax loss while cash-flowing — sheltering income. Rental losses are passive: they offset passive income freely, and up to $25,000/yr can offset ordinary (W-2) income if you actively participate and your MAGI is under $100k (phasing out to $0 by $150k); unused losses carry forward. On sale, claimed depreciation is recaptured at up to 25%, and gains may owe capital-gains tax (a 1031 exchange can defer both). Figures are a year-1 estimate at your 24.0% rate — not tax advice; consult a CPA.
Schools (NCES district)
- District
- Henry County
- NCES district ID
- 1302820
- Math proficiency
- 24% ▼ -9.00%
- Reading proficiency
- 33% ▼ -7.00%
- Median HH income
- $62,594
- Composite
- 26.13/100
- National rank
- #7279
- State rank
- #89 of 174 in GA
Livability — Stockbridge
- Score
- 60/100
- State rank
- #389
- US rank
- #19479
Category grades
Schools grade is shown separately in the Schools card above.
Census & demographics
- County
- Henry County · 316,359 people
- City population
- 71,603
- Metro
- Atlanta-Sandy Springs-Alpharetta, GA
- Population (ZIP)
- 64,779
- Household income
- $81,892
- Rent vs Own
- Severe rent burden
- 2591.0
Population outlook (Henry County) Hauer SSP2
- Today (2025)
- 249,041 people
- By 2030
- 264,369 · +6.2%
- By 2040
- 294,459 · +18.2%
- By 2050
- 322,249 · +29.4%
- By 2075
- 392,310 · +57.5%
- By 2100
- 437,836 · +75.8%
Race, ethnicity, and origin ACS 2023
- Neighborhood character
- Diverse neighborhood (Simpson 0.57)
- Race & ethnicity
- Black 61% White 22% Two or more races 7% Hispanic / Latino 7% Asian 3%
- Hispanic origin (detail)
- Mexican 3%
- Common ancestry
- Hispanic 1% Lithuanian 1% Slovak 1%
- Foreign-born
- 10% · Canada, China, Vietnam
- Languages at home
- 89% English-only · Spanish 5% French/Haitian/Cajun 1% Vietnamese 1%
Political lean MEDSL · Henry
- 2024 margin
- Strong D (+29.7) · D 64.5% · R 34.9%
- 2008→2024 swing
- +37.1pp toward D · 2008: -7.5pp · 2024: 29.7pp
- All cycles
- 2024: D+29.7 2020: D+20.5 2016: D+4.3 2012: R+3.2 2008: R+7.5
Not yet ingested
- Civics
- —
Market trends
- HPI YoY
- ▼ -87.51%
- Current HPI
- 210.679
- Rent YoY
- ▼ -0.35%
- Metro
- Atlanta-Sandy Springs-Alpharetta, GA
- State GDP YoY
- ▲ 2.66%
- F500 in state
- 28
Industry mix (Fortune 500 HQ in GA)
| Industry | F500 HQs | Revenue |
|---|---|---|
| Paper / Packaging | 2 | $29B |
|
||
| Retail | 1 | $160B |
|
||
| Transportation / Logistics | 1 | $91B |
|
||
| Airlines | 1 | $62B |
|
||
| Consumer Goods | 1 | $47B |
|
||
| Utilities | 1 | $25B |
|
||
Price history
2 events — show timeline
- 2026-04-12 Listing Removed — GAMLS
- 2026-04-11 Listed $343,490 GAMLS
Property tax history
-46.5%/yrLatest (2025): $774 · -46.5% YoY. Source: county tax records.
Cash-flow waterfall
monthlySold comps — $/sqft
last 12 mo · ≤1 miLoading sold comps…