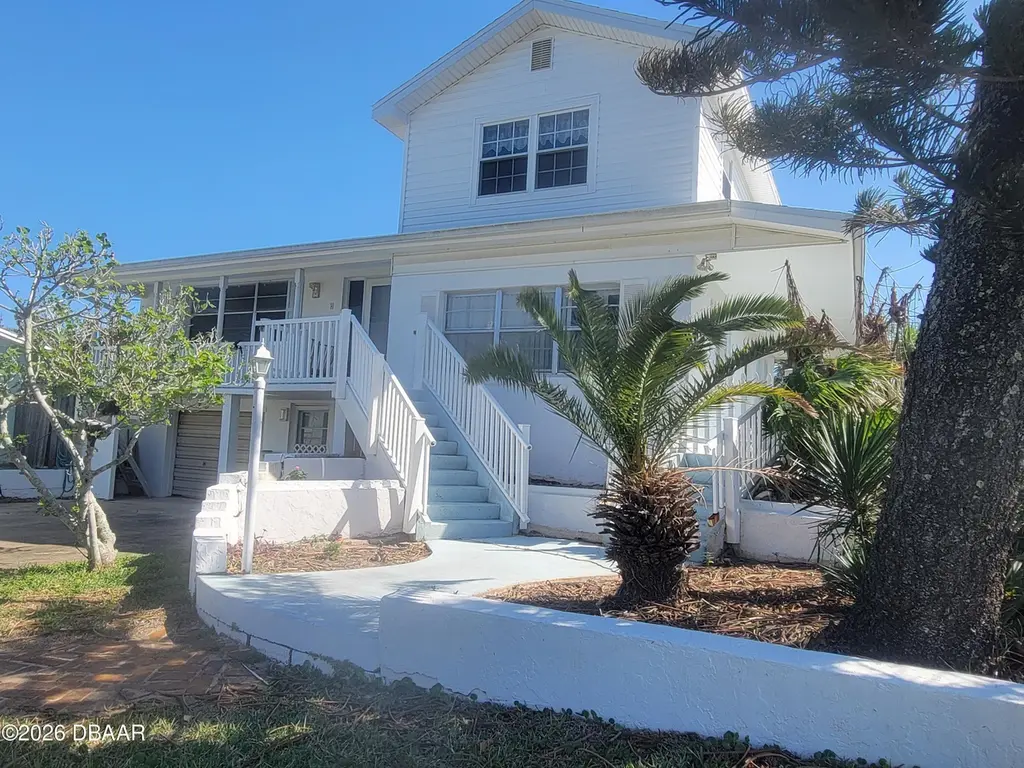
3941 S Peninsula Dr · Daytona Beach Shores, FL
Flood risk 7/10 · Major
- FEMA flood zone
- X (unshaded)
- Chance of flooding over 30 yrs
- 0.95%
- Est. flood insurance / yr
- $507 – $1,088
Fire risk 1/10 · Minimal
- Est. fire insurance / yr
- $947 – $1,759
Heat risk 9/10 · Severe
- Hot days now (above 105°F)
- 7 days/yr
- Hot days in 30 yrs
- 20 days/yr
Wind risk 10/10 · Severe
- Chance of severe wind over 30 yrs
- 99.0%
Air-quality risk 2/10 · Minimal
- Unhealthy air days now
- 1 days/yr
- Unhealthy air days in 30 yrs
- 1 days/yr
Risk factors via First Street. Map © Google.
Why this score? — see what drove the D- grade
The composite is a weighted blend of 9 inputs, each scored 0–100. Each bar is that input's sub-score; the figure is the points it added to the 100-point composite (weight × sub-score).
- Cash flow +12.5/30.0
- ARV discount +7.5/15.0
- Schools +3.9/10.0
- Livability +3.9/5.0
- DSCR +3.7/10.0
- Rent growth +3.0/5.0
- Condition / age +2.5/5.0
- 1% rule +2.4/10.0
- Appreciation +0.0/10.0
$424,900
🖨 Deal sheet (PDF) 📄 Offer letter ✓ Due diligence
Listing remarks
Prime marina-view property in sought-after Wilbur by the Sea! Located directly across from Boondocks Restaurant, tiki bar, and Adventure Yacht Harbor with access to deep-water slips and rentals. Just a short walk to a pristine, no-drive beach known for its natural beauty, sea turtles, and coastal wildlife--one of Volusia County's most desirable stretches. Enjoy a quiet, no-HOA community. Walk to the historic Wilbur Boathouse featuring a fishing dock, kayak launch, and community events. This unique mid-century home offers 3 bedrooms, 2 baths, plus a 675 sq ft walk-out basement/garage with additional full bath and potential bedroom. The primary suite features marina and sunset views. Relax on
Key facts
- Fishing dock
- Kayak launch
- Marina-view property
Tags
Neighborhood map
What this means for you Summary
Snapshot
- This is a 4-bed/3.0-bath single-family listed at $425k.
Deal economics
- At list price, monthly cash flow is $-127 ($-2k/yr) — negative.
- To cash-flow at today's rent, offer at most $402k (5.3% below list).
- To meet the 1% rule (rent ≥ 1% of price), the offer needs to be $316k (25.7% below list).
- Recommended offer: $316k (25.7% below list) — sets the bar for 1% rule.
Location & tenants
- Location reads 77/100 on livability (#201 in FL, #3,146 nationally) — a middle-class / working-renter tenant base. Strengths: crime A+, commute A+, health & safety A; Watch: schools C-, cost of living C-, amenities D-.
- Volusia (suburban): math 44% / reading 49% proficiency, ranked #47 of 73 in FL (top 64%) — families likely to look elsewhere, expect single-tenant / working-renter base with shorter leases.
- Market conditions: Rents rising (+1.8%/yr); 418 active listings in the ZIP; 2 comparable units currently listed for rent nearby; 3,402 units permitted in Volusia County in 2024 (681 in 5+ unit buildings).
- At $3,156/mo this rent would consume 53% of the median local household income ($72k/yr) (locally 812% of renters already pay >50% of income on rent) — very limited rent-growth headroom before tenants either downsize or default.
Forward outlook
- Local home prices are declining (-3.0%/yr); year-one equity from $3k of loan paydown is wiped out by about $13k of value loss. Plan a longer hold.
- Volusia County population projected at +19% by 2050 — long-run rental-demand tailwind backs the buy-and-hold thesis.
Negotiation context
- It's been on market 49 days — a 3% lower offer ($412k) is reasonable based on typical stale-listing flexibility.
- Current owner paid $130k; list at $425k implies a 227% gain — meaningful room to come down on a strong offer.
Risks & watch-outs
- Watch-outs: flood insurance adds $66/mo; built in 1949 — expect roof / HVAC / electrical / plumbing capex.
- Climate carrying-cost: major flood risk; severe wind risk, 99% chance of damaging wind over 30y; extreme-heat days projected 7→20/yr by 2055 (HVAC capex compounding) — expect insurance premiums to compound above CPI over the hold.
Questions for the listing agent
- What do current leases actually rent for vs. the listed asking? Can we see a recent rent roll and the last 12 months of T-12 income?
- It's been on market 49 days. Have you received any prior offers? Is the seller open to a 26% concession, seller financing, or rate buy-down credit?
- Built in 1949 — when were the roof, HVAC, electrical panel, plumbing, and water heater last replaced?
- What's the actual annual flood-insurance premium (NFIP or private), and is the property in a SFHA with mandatory coverage?
- Is there a deadline driving the sale (1031 exchange, divorce, estate, relocation)? That informs how much negotiation room exists.
- The area grade is low — what's the realistic commute time and amenity access for the typical tenant pool here? Any planned neighborhood developments (good or bad) we should know about?
- What's the average days-on-market for RENTAL listings here right now (not sales)? A rising rental-DOM trend means longer vacancies and softer asking-rent achievability than the comps imply.
- What's the recent tenant-quality profile in this submarket — average credit score on applications, eviction rate, late-payment / NSF rate, and stable-employment percentage? A property-management company in the area should have these aggregated.
- How much new for-sale + rental construction is in the pipeline within 1–3 miles? Heavy new supply typically softens prices + rents 12–24 months out; constrained supply supports both.
Investment metrics
- 1% rule
- 0.74% ✗
- Cap rate
- 6.12%
- Cash-on-cash
- -0.61%
- DSCR
- 0.97
- GRM
- 11.2
CMA / ARV
No comps found within radius.
Projected returns pro-forma
-3.0% appreciation · 1.83% rent growth · sell at horizon
- IRR
- -19.6%
- Equity multiple
- 0.32×
- Total profit
- $-80,778
- Equity at exit
- $63,354
- IRR
- -14.9%
- Equity multiple
- 0.19×
- Total profit
- $-96,093
- Equity at exit
- $36,738
Cash invested: $118,972 (down + closing). Projections, not guarantees.
Landlord ↔ Tenant lean methodology
- Overall (STATE)
- 87 Strongly Landlord-Friendly
- State Florida
- 87 Strongly Landlord-Friendly · R+3
- County
- — inherits STATE
- City
- — inherits STATE
ZIP-level market 32127
- Rents YoY
- 1.8%
- Active inventory
- 418
- Price-to-rent
- 11.2×
Monthly cashflow live
- Estimated rent
- $3,156 medium interval (Pro) →
- Mortgage (P&I)
- −$2,228
- Tax from tax record
- −$149 /mo · $1,784/yr
- Insurance
- −$177
- Flood insurance flood zone
- −$66 /mo · $798/yr
- HOA
- −$0
- Vacancy / Maint / Mgmt
- −$663
- Net cashflow
- $-127
Break-even live
Sensitivity live
| Price | -10% $113 | -5% $-7 | +0% $-127 | +5% $-248 | +10% $-368 |
|---|---|---|---|---|---|
| Rent | -10% $-377 | -5% $-252 | +0% $-127 | +5% $-3 | +10% $122 |
| Rate | -1.0pp $87 | -0.5pp $-19 | base $-127 | +0.5pp $-237 | +1.0pp $-349 |
UW: 25.0% down · 7.5% · 30yr · 1.5% tax · 5.0% vac · 8.0% maint · 8.0% mgmt
Financing live
Cash to close
- Down payment
- $106,225
- Closing costs
- $12,747
- Reserves months
- —
- Total cash needed
- —
Loan-product check · same deal, 3 products live
Conventional
25% down · 7.5% · 30yr
- Down + closing
- —
- Monthly P&I
- —
- Monthly cashflow
- —
- DSCR
- —
- Eligible?
- —
Personal DTI + credit; lowest rate.
DSCR
20% down · 8.5% · 30yr
- Down + closing
- —
- Monthly P&I
- —
- Monthly cashflow
- —
- DSCR
- —
- Eligible?
- —
No personal income docs; deal must DSCR.
Hard money
10% down · 12.0% · 12mo
- Down + closing
- —
- Monthly P&I
- —
- Monthly cashflow
- —
- DSCR
- —
- Eligible?
- —
Short-term bridge; refi at stabilization.
Rent comps 2 comps
| Address | Beds | Baths | Sqft | Rent | $/sqft | DOM | Units | Dist |
|---|---|---|---|---|---|---|---|---|
| 3757 S Atlantic Ave #503 Daytona Beach Shores, FL | 3.0 | 3.0 | 1826 | $4,800 | $2.63 | 24d | 1 | 0.70mi |
| 175 Conrad St Port Orange, FL | 3.0 | 2.0 | 1260 | $1,950 | $1.55 | 24d | 1 | 1.35mi |
Listing history 21 events
-
2026-06-18days on market $424,900 Active 49 DOM
-
2026-06-17days on market $424,900 Active 48 DOM
-
2026-06-16days on market $424,900 Active 47 DOM
-
2026-06-15days on market $424,900 Active 46 DOM
-
2026-06-14days on market $424,900 Active 44 DOM
-
2026-06-10days on market $424,900 Active 41 DOM
-
2026-06-09days on market $424,900 Active 40 DOM
-
2026-06-08days on market $424,900 Active 39 DOM
-
2026-06-07days on market $424,900 Active 38 DOM
-
2026-06-05days on market $424,900 Active 35 DOM
-
2026-06-03days on market $424,900 Active 34 DOM
-
2026-06-03days on market $424,900 Active 33 DOM
-
2026-06-01days on market $424,900 Active 32 DOM
-
2026-05-31days on market $424,900 Active 31 DOM
-
2026-05-31days on market $424,900 Active 30 DOM
-
2026-04-22status Pending
-
2026-03-25$429,000 Active
-
2026-03-03soldstatus $130,000
-
1991-04-01soldstatus $80,000
-
1982-12-01soldstatus $127,500
-
1969-04-01soldstatus $15,000
ⓘ Source: listings_history table (triggers on properties + properties_extension) + one-shot
backfill from property_details.listing_events for pre-trigger history.
Tax reassessment forecast FL · Resets to sale price
- Current annual tax
- $1,784 · $149/mo
- Projected year-2 tax
- $3,527 · $294/mo
- Expected delta
- +$1,743/yr (+$145/mo · 97.7%)
ⓘ Screening estimate from a state-policy table — verify with the county assessor before closing.
Climate risk First Street
- Flood 7/10 Severe FEMA zone X (unshaded) · 95% chance over 30 yrs
- Wildfire 1/10 Low
- Heat 9/10 Extreme 7 d/yr ≥105°F today · 20 d/yr by 30 yrs out
- Wind 10/10 Extreme 99% chance of damaging wind over 30 yrs
- Air quality 2/10 Low 1 unhealthy d/yr today · 1 by 30 yrs out
Nearby sold comps map
Loading sold comps map…
Walkable amenities ~0.75 mi
Loading nearby amenities…
Taxation est. · year 1
- Rental income
- $37,870
- − Mortgage interest
- −$23,801
- − Property taxes
- −$1,784
- − Insurance
- −$2,922
- − Repairs & maintenance
- −$3,030
- − Management
- −$3,030
- − Depreciation
- −$12,361
- Taxable loss
- −$9,057
- Est. tax savings @ 24.0%
- +$2,174
- After-tax cash flow
- $646/yr
For passive investors: Depreciation is non-cash, so a rental often shows a tax loss while cash-flowing — sheltering income. Rental losses are passive: they offset passive income freely, and up to $25,000/yr can offset ordinary (W-2) income if you actively participate and your MAGI is under $100k (phasing out to $0 by $150k); unused losses carry forward. On sale, claimed depreciation is recaptured at up to 25%, and gains may owe capital-gains tax (a 1031 exchange can defer both). Figures are a year-1 estimate at your 24.0% rate — not tax advice; consult a CPA.
Schools (NCES district)
- District
- Volusia
- NCES district ID
- 1201920
- Math proficiency
- 44% ▼ -9.00%
- Reading proficiency
- 49% ▼ -3.00%
- Median HH income
- $42,946
- Composite
- 39.2/100
- National rank
- #4019
- State rank
- #47 of 73 in FL
Livability — Daytona Beach Shores
- Score
- 77/100
- State rank
- #201
- US rank
- #3146
Category grades
Schools grade is shown separately in the Schools card above.
Census & demographics
- County
- Volusia County · 556,871 people
- Metro
- Deltona-Daytona Beach-Ormond Beach, FL
- Population (ZIP)
- 29,612
- Household income
- $71,676
- Rent vs Own
- Severe rent burden
- 812.0
Population outlook (Volusia County) Hauer SSP2
- Today (2025)
- 572,749 people
- By 2030
- 598,695 · +4.5%
- By 2040
- 644,880 · +12.6%
- By 2050
- 681,451 · +19.0%
- By 2075
- 759,957 · +32.7%
- By 2100
- 778,902 · +36.0%
Race, ethnicity, and origin ACS 2023
- Neighborhood character
- Predominantly White (88%)
- Race & ethnicity
- White 88% Two or more races 6% Hispanic / Latino 4% Black 2% Asian 1%
- Common ancestry
- Romanian 5% Lithuanian 3% Iranian 2%
- Foreign-born
- 6% · Canada
- Languages at home
- 93% English-only · Spanish 3% Other Indo-European 1%
Political lean MEDSL · Volusia
- 2024 margin
- Strong R (+21.8) · D 38.7% · R 60.5%
- 2008→2024 swing
- -27.4pp toward R · 2008: 5.7pp · 2024: -21.8pp
- All cycles
- 2024: R+21.8 2020: R+14.1 2016: R+13.1 2012: R+1.2 2008: D+5.7
Not yet ingested
- Civics
- —
Market trends
- HPI YoY
- ▼ -348.71%
- Current HPI
- 282.5248
- Rent YoY
- ▲ 1.83%
- Metro
- Deltona-Daytona Beach-Ormond Beach, FL
- State GDP YoY
- ▲ 3.28%
- F500 in state
- 36
Industry mix (Fortune 500 HQ in FL)
| Industry | F500 HQs | Revenue |
|---|---|---|
| Industrial Technology | 2 | $29B |
|
||
| Insurance | 2 | $17B |
|
||
| Retail | 1 | $60B |
|
||
| Technology Distribution | 1 | $58B |
|
||
| Homebuilding | 1 | $35B |
|
||
| Technology Manufacturing | 1 | $35B |
|
||
Price history
+2760.0% since first listed6 events — show timeline
- 2026-04-22 Pending — Daytona MLS
- 2026-03-25 Listed $429,000 Daytona MLS
- 2026-03-03 Sold (Public Records) $130,000 Public Records
- 1991-04-01 Sold (Public Records) $80,000 Public Records
- 1982-12-01 Sold (Public Records) $127,500 Public Records
- 1969-04-01 Sold (Public Records) $15,000 Public Records
Property tax history
+1.6%/yrLatest (2025): $1,784 · +2.1% YoY. Source: county tax records.
Cash-flow waterfall
monthlySold comps — $/sqft
last 12 mo · ≤1 miLoading sold comps…