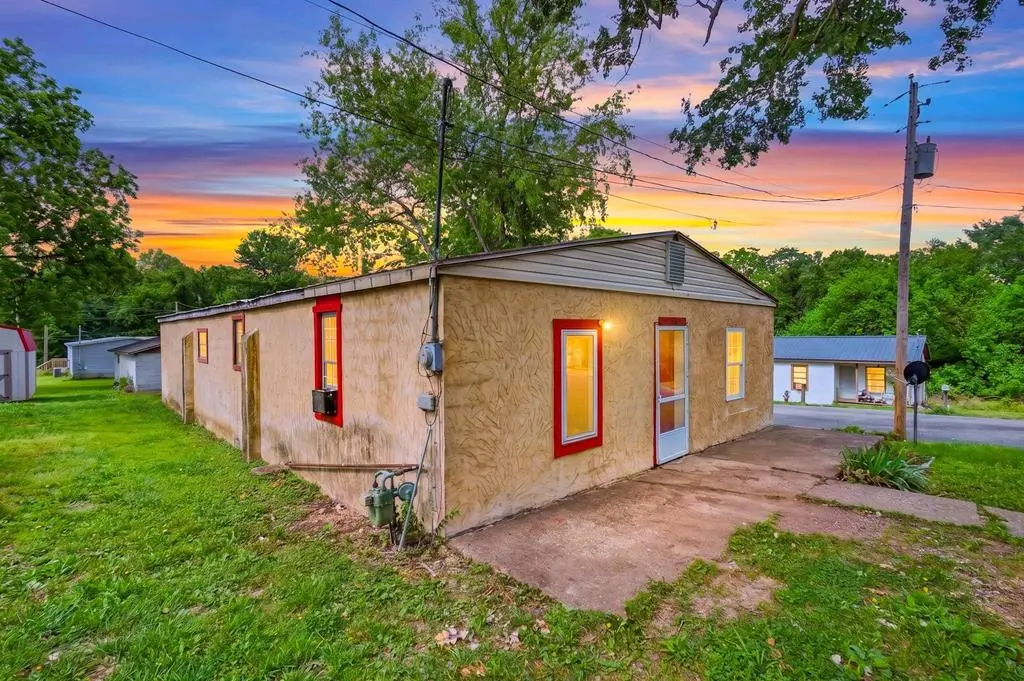
116 W Vine St · Jackson, OH
Flood risk 1/10 · Minimal
- FEMA flood zone
- X (unshaded)
- Chance of flooding over 30 yrs
- 0.0%
- Est. flood insurance / yr
- $473 – $860
Fire risk 2/10 · Minimal
- Est. fire insurance / yr
- $713 – $1,323
Heat risk 4/10 · Minor
- Hot days now (above 100°F)
- 7 days/yr
- Hot days in 30 yrs
- 18 days/yr
Wind risk 2/10 · Minimal
- Chance of severe wind over 30 yrs
- 1.0%
Air-quality risk 2/10 · Minimal
- Unhealthy air days now
- 0 days/yr
- Unhealthy air days in 30 yrs
- 1 days/yr
Risk factors via First Street. Map © Google.
Why this score? — see what drove the B grade
The composite is a weighted blend of 9 inputs, each scored 0–100. Each bar is that input's sub-score; the figure is the points it added to the 100-point composite (weight × sub-score).
- Cash flow +30.0/30.0
- 1% rule +10.0/10.0
- DSCR +10.0/10.0
- ARV discount +7.5/15.0
- Schools +5.1/10.0
- Livability +3.3/5.0
- Rent growth +2.5/5.0
- Condition / age +2.2/5.0
- Appreciation +0.0/10.0
$55,000
🖨 Deal sheet (PDF) 📄 Offer letter ✓ Due diligence
Listing remarks MLS
Great price on a 3 bed, 1 bath home in town! Same owner for many years has used this as a rental. Comes with a bonus room formerly used as a store. Detached 2 car garage and tons of potential. Cash or conventional only.
Key facts
- Rental potential
- Bonus room
- Detached garage
Tags
Property features AI
Exterior
- Parking: Attached garage with 2 parking spaces
- Utilities: Public water; Public sewer
- Home design: Single-family home; One story; Built in 1940; No common walls
- Construction: Built in 1940
- Exterior features: Other foundation details; Lot about 0.13 acres
Interior
- Bedrooms: Three main-level bedrooms
- Bathrooms: One full bathroom
- Interior features: Crawl space basement; Living area approximately 1,680
Neighborhood map
What this means for you Summary
Snapshot
- This is a 3-bed/1.0-bath single-family listed at $55k. Condition is rated fair.
Deal economics
- At list price, monthly cash flow is $427 ($5k/yr) — positive.
- The deal already cash-flows at list — no discount required.
- Meets the 1% rule at list price ($1k rent vs $55k).
- Cap rate 15.6% vs local median 2.5% in Jackson — top-decile yield for the area; either an underpriced asset or a hidden risk that comps aren't pricing in. Stress-test before assuming the spread holds.
Location & tenants
- Location reads 66/100 on livability (#637 in OH) — a middle-class / working-renter tenant base. Strengths: cost of living A+, housing A+, schools A; Watch: health & safety C-, amenities F, commute F.
- Jackson City (town): math 58% / reading 64% proficiency, ranked #292 of 656 in OH (top 44%) — acceptable for families but not a draw, mixed tenant base, ~2y average lease.
- Market conditions: 67 active listings in the ZIP; 32 units permitted in Jackson County in 2024 (0 in 5+ unit buildings).
Forward outlook
- Local home prices are declining (-3.0%/yr); year-one equity from $380 of loan paydown is wiped out by about $2k of value loss. Plan a longer hold.
- Jackson County population projected at -22% by 2050 — secular population decline; favor cash flow + early exit over multi-decade hold.
- At projected returns (-3.0% appreciation + 3.0% rent growth), your $15k cash investment doubles in ~4 years — after that, you're playing with house money.
Negotiation context
- Only 5 days on market — expect competitive offers; lowballing is unlikely to land.
- 2 sale attempts with the ask held roughly flat each time — persistent listings suggest the price (not the market) is what's stuck; bring a comps-based counter.
Risks & watch-outs
- Watch-outs: built in 1940 — expect roof / HVAC / electrical / plumbing capex.
Questions for the listing agent
- Have any recent inspections been done? Can we get a copy of the seller's disclosures and any deferred-maintenance estimates?
- Built in 1940 — when were the roof, HVAC, electrical panel, plumbing, and water heater last replaced?
- Is there a deadline driving the sale (1031 exchange, divorce, estate, relocation)? That informs how much negotiation room exists.
- Schools are A-rated — typically a magnet for longer-tenancy family renters. What's the average tenant stay here, and is there a school-zone premium baked into asking?
- What's the average days-on-market for RENTAL listings here right now (not sales)? A rising rental-DOM trend means longer vacancies and softer asking-rent achievability than the comps imply.
- What's the recent tenant-quality profile in this submarket — average credit score on applications, eviction rate, late-payment / NSF rate, and stable-employment percentage? A property-management company in the area should have these aggregated.
- How much new for-sale + rental construction is in the pipeline within 1–3 miles? Heavy new supply typically softens prices + rents 12–24 months out; constrained supply supports both.
Investment metrics
- 1% rule
- 1.86% ✓
- Cap rate
- 15.61%
- Cash-on-cash
- 33.29%
- DSCR
- 2.48
- GRM
- 4.5
CMA / ARV
- ARV (on-the-fly)
- $198,240
- Comps found
- 3
Show comp detail 3 sales within ~0.75 mi
| Address | Dist | Beds/Ba | Sqft | Sold | Price | $/sf | Match |
|---|---|---|---|---|---|---|---|
| 139 Chestnut St | 0.59mi | 3/2.0 | 1,700 (+1%) | 11mo | $200,000 | $118 | 57 |
| 91 N Bennett Ave | 0.68mi | 3/2.0 | 1,820 (+8%) | 9mo | $178,700 | $98 | 43 |
| 170 Locust St | 0.72mi | 3/2.5 | 1,530 (-9%) | 10mo | $295,000 | $193 | 37 |
Match score weights: distance 35% · size 25% · config 20% · recency 20%. Top-matched comps best support the ARV.
Projected returns pro-forma
-3.0% appreciation · 3.0% rent growth · sell at horizon
- IRR
- 28.5%
- Equity multiple
- 2.19×
- Total profit
- $18,313
- Equity at exit
- $8,201
- IRR
- 36.0%
- Equity multiple
- 4.31×
- Total profit
- $51,046
- Equity at exit
- $4,755
Cash invested: $15,400 (down + closing). Projections, not guarantees.
Landlord ↔ Tenant lean methodology
- Overall (STATE)
- 73 Landlord-Friendly
- State Ohio
- 73 Landlord-Friendly · R+6
- County
- — inherits STATE
- City
- — inherits STATE
ZIP-level market 45640
- Home prices YoY
- -32.3%
- Active inventory
- 67
- Price-to-rent
- 4.5×
Monthly cashflow live
- Estimated rent
- $1,022 medium interval (Pro) →
- Mortgage (P&I)
- −$288
- Tax est. 1.5%
- −$69 /mo · $825/yr
- Insurance
- −$23
- HOA
- −$0
- Vacancy / Maint / Mgmt
- −$215
- Net cashflow
- $427
Break-even live
Sensitivity live
| Price | -10% $465 | -5% $446 | +0% $427 | +5% $408 | +10% $389 |
|---|---|---|---|---|---|
| Rent | -10% $346 | -5% $387 | +0% $427 | +5% $468 | +10% $508 |
| Rate | -1.0pp $455 | -0.5pp $441 | base $427 | +0.5pp $413 | +1.0pp $398 |
UW: 25.0% down · 7.5% · 30yr · 1.5% tax · 5.0% vac · 8.0% maint · 8.0% mgmt
Financing live
Cash to close
- Down payment
- $13,750
- Closing costs
- $1,650
- Reserves months
- —
- Total cash needed
- —
Loan-product check · same deal, 3 products live
Conventional
25% down · 7.5% · 30yr
- Down + closing
- —
- Monthly P&I
- —
- Monthly cashflow
- —
- DSCR
- —
- Eligible?
- —
Personal DTI + credit; lowest rate.
DSCR
20% down · 8.5% · 30yr
- Down + closing
- —
- Monthly P&I
- —
- Monthly cashflow
- —
- DSCR
- —
- Eligible?
- —
No personal income docs; deal must DSCR.
Hard money
10% down · 12.0% · 12mo
- Down + closing
- —
- Monthly P&I
- —
- Monthly cashflow
- —
- DSCR
- —
- Eligible?
- —
Short-term bridge; refi at stabilization.
Listing history 5 events
-
2026-06-16days on market $55,000 Active 5 DOM
-
2026-06-15days on market $55,000 Active 4 DOM
-
2026-06-13days on market $55,000 Active 2 DOM
-
2026-06-12remarks 220-char remark
-
2026-06-12$55,000 Active 1 DOM
ⓘ Source: listings_history table (triggers on properties + properties_extension) + one-shot
backfill from property_details.listing_events for pre-trigger history.
Climate risk First Street
- Flood 1/10 Low FEMA zone X (unshaded) · 0% chance over 30 yrs
- Wildfire 2/10 Low
- Heat 4/10 Moderate 7 d/yr ≥100°F today · 18 d/yr by 30 yrs out
- Wind 2/10 Low 100% chance of damaging wind over 30 yrs
- Air quality 2/10 Low 0 unhealthy d/yr today · 1 by 30 yrs out
Nearby sold comps map
Loading sold comps map…
Walkable amenities ~0.75 mi
Loading nearby amenities…
Taxation est. · year 1
- Rental income
- $12,263
- − Mortgage interest
- −$3,081
- − Property taxes
- −$825
- − Insurance
- −$275
- − Repairs & maintenance
- −$981
- − Management
- −$981
- − Depreciation
- −$1,600
- Taxable income
- $4,520
- Est. tax owed @ 24.0%
- −$1,085
- After-tax cash flow
- $4,042/yr
For passive investors: Depreciation is non-cash, so a rental often shows a tax loss while cash-flowing — sheltering income. Rental losses are passive: they offset passive income freely, and up to $25,000/yr can offset ordinary (W-2) income if you actively participate and your MAGI is under $100k (phasing out to $0 by $150k); unused losses carry forward. On sale, claimed depreciation is recaptured at up to 25%, and gains may owe capital-gains tax (a 1031 exchange can defer both). Figures are a year-1 estimate at your 24.0% rate — not tax advice; consult a CPA.
Condition & rehab AI · 13 photos
This single-family home requires moderate repairs and maintenance, including roof and exterior siding work, to improve its condition and value.
Repairs flagged
- Major roof — visible wear
- Moderate exterior siding — moderate wear
Value-add opportunities
- Both paint exterior and interior — enhances curb appeal and interior aesthetics
- Both landscaping — improves curb appeal and enhances property value
- Both roof repair — essential for structural integrity and property value
Renovation cost estimate screening
| Repair item | Severity | Est. cost |
|---|---|---|
| roof · visible wear | Major | $15,000–50,000 |
| exterior siding · moderate wear | Moderate | $3,000–15,000 |
| Total estimated repair cost · 2 items | $18,000–65,000 |
Value-add ROI direction
- Both paint exterior and interior — enhances curb appeal and interior aesthetics ↑
- Both landscaping — improves curb appeal and enhances property value ↑
- Both roof repair — essential for structural integrity and property value ↑
ⓘ Cost ranges are severity-bucket heuristics (US national rule-of-thumb). Get contractor quotes + a written scope before underwriting a rehab budget.
Schools (NCES district)
- District
- Jackson City
- NCES district ID
- 3904415
- Math proficiency
- 58% ▼ -18.00%
- Reading proficiency
- 64% ▼ -8.00%
- Median HH income
- $40,387
- Composite
- 50.97/100
- National rank
- #1781
- State rank
- #292 of 656 in OH
Livability — Jackson
- Score
- 66/100
- State rank
- #637
- US rank
- #11225
Category grades
Schools grade is shown separately in the Schools card above.
Census & demographics
- Census place
- Jackson, OH
- County
- Jackson · 32,540 people
- Population (ZIP)
- 16,360
- Household income
- $62,813
- Rent vs Own
- Severe rent burden
- 12.2
Population outlook (Jackson County) Hauer SSP2
- Today (2025)
- 30,794 people
- By 2030
- 29,535 · -4.1%
- By 2040
- 26,757 · -13.1%
- By 2050
- 23,897 · -22.4%
- By 2075
- 17,115 · -44.4%
- By 2100
- 10,908 · -64.6%
Race, ethnicity, and origin ACS 2023
- Neighborhood character
- Predominantly White (95%)
- Race & ethnicity
- White 95% Two or more races 2% Asian 1%
- Common ancestry
- Slovak 2% Lithuanian 1% Serbian 1%
- Foreign-born
- 2% · Canada
- Languages at home
- 98% English-only · German/W. Germanic 1% Other Indo-European 1% Spanish 1%
Political lean MEDSL · Jackson
- 2024 margin
- Solid R (+58.1) · D 20.7% · R 78.8%
- 2008→2024 swing
- -37.9pp toward R · 2008: -20.2pp · 2024: -58.1pp
- All cycles
- 2024: R+58.1 2020: R+54.1 2016: R+48.9 2012: R+20.8 2008: R+20.2
Not yet ingested
- Civics
- —
Market trends
- HPI YoY
- ▼ -104.17%
- Current HPI
- 218.1692
- Rent YoY
- —
- Metro
- —
- State GDP YoY
- ▲ 1.98%
- F500 in state
- 48
Industry mix (Fortune 500 HQ in OH)
| Industry | F500 HQs | Revenue |
|---|---|---|
| Insurance | 3 | $145B |
|
||
| Industrial Machinery | 3 | $49B |
|
||
| Financial Services | 3 | $24B |
|
||
| Consumer Goods | 2 | $93B |
|
||
| Aerospace / Defense | 2 | $47B |
|
||
| Utilities | 2 | $33B |
|
||
Price history
+0.0% since first listed2 events — show timeline
- 2026-06-11 Listed $55,000 SVAR
- 2026-06-11 Listed $55,000 CBRMLS
Cash-flow waterfall
monthlySold comps — $/sqft
last 12 mo · ≤1 miLoading sold comps…