4801 Irving Blvd NW · Albuquerque, NM
Flood risk 1/10 · Minimal
- FEMA flood zone
- X (unshaded)
- Chance of flooding over 30 yrs
- 0.0%
- Est. flood insurance / yr
- $507 – $1,088
Fire risk 3/10 · Minor
- Est. fire insurance / yr
- $706 – $1,312
Heat risk 5/10 · Moderate
- Hot days now (above 96°F)
- 7 days/yr
- Hot days in 30 yrs
- 18 days/yr
Wind risk 1/10 · Minimal
- Chance of severe wind over 30 yrs
- —
Air-quality risk 3/10 · Minor
- Unhealthy air days now
- 3 days/yr
- Unhealthy air days in 30 yrs
- 4 days/yr
Risk factors via First Street. Map © Google.
Why this score? — see what drove the D grade
The composite is a weighted blend of 9 inputs, each scored 0–100. Each bar is that input's sub-score; the figure is the points it added to the 100-point composite (weight × sub-score).
- Cash flow +14.7/30.0
- ARV discount +7.5/15.0
- Schools +5.3/10.0
- DSCR +4.5/10.0
- Livability +3.6/5.0
- 1% rule +3.1/10.0
- Condition / age +2.5/5.0
- Rent growth +1.9/5.0
- Appreciation +0.0/10.0
$235,000
🖨 Deal sheet (PDF) 📄 Offer letter ✓ Due diligence
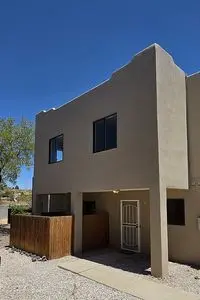
Listing remarks
This beauty has fresh exterior stucco and a brand new Refrigerated Air, Furnace, and Water Heater as of April 2026. Upgraded vynal flooring downstairs with eat-in kitchen, enclosed patio, and single garage and spacious bedrooms upstairs. Quiet and enclosed neighborhood with access to shopping, schools, and local activity. This property is being sold by current owner, Agents are welcome.
Key facts
- Eat-in kitchen
- Brand new furnace
- Built 1999
Tags
Property features AI
Exterior
- Home design: Built in 1999
- Construction: Living area of 1,296
- Exterior features: Located in the Paradise Hills Civic subdivision
Neighborhood map
What this means for you Summary
Snapshot
- This is a 3-bed/3.0-bath condo listed at $235k.
Deal economics
- At list price, monthly cash flow is $61 ($736/yr) — positive.
- The deal already cash-flows at list — no discount required.
- To meet the 1% rule (rent ≥ 1% of price), the offer needs to be $189k (19.4% below list).
- Recommended offer: $189k (19.4% below list) — sets the bar for 1% rule.
- Cap rate 6.6% vs local median 3.7% in Albuquerque — top-decile yield for the area; either an underpriced asset or a hidden risk that comps aren't pricing in. Stress-test before assuming the spread holds.
Location & tenants
- Location reads 72/100 on livability (#13 in NM) — a middle-class / working-renter tenant base. Strengths: amenities A+, commute A+, cost of living A+; Watch: crime F.
- Albuquerque Public Schools (urban): math 51% / reading 75% proficiency, ranked #3 of 29 in NM (top 10%) — acceptable for families but not a draw, mixed tenant base, ~2y average lease; 60% free/reduced lunch — lower-income household profile, screen leases tightly.
- Zoned schools: Seven Bar Elementary (486 students, 43% FRL); James Monroe Middle (689 students, 45% FRL); Cibola High (math 37% / reading 72%, grade C-, #34 of 110 statewide, top 31%, 1,762 students, 34% FRL) — zoned schools average 41% FRL vs 60% district-wide (20 pts lower); this property's tenant base skews higher-income than the district average.
- Market conditions: Rents soft (-2.5%/yr); 348 active listings in the ZIP; 20 comparable units currently listed for rent nearby; rentals leasing fast (median 6d on market — plan ~1-2 weeks tenant-placement turnaround); solid renter incomes; 1,316 units permitted in Bernalillo County in 2024 (546 in 5+ unit buildings).
Forward outlook
- Local home prices are declining (-3.0%/yr); year-one equity from $2k of loan paydown is wiped out by about $7k of value loss. Plan a longer hold.
Negotiation context
- It's been on market 35 days — a 3% lower offer ($228k) is reasonable based on typical stale-listing flexibility.
- 2 sale attempts since 7y ago with the ask held roughly flat each time — persistent listings suggest the price (not the market) is what's stuck; bring a comps-based counter.
Risks & watch-outs
- Climate carrying-cost: extreme-heat days projected 7→18/yr by 2055 (HVAC capex compounding) — expect insurance premiums to compound above CPI over the hold.
Questions for the listing agent
- It's been on market 35 days. Have you received any prior offers? Is the seller open to a 19% concession, seller financing, or rate buy-down credit?
- Any open or pending special assessments — roof, HVAC, plumbing, elevator, façade? What's the per-unit balance and payoff schedule, and is the seller paying it off at close or rolling it to the buyer?
- Is there a deadline driving the sale (1031 exchange, divorce, estate, relocation)? That informs how much negotiation room exists.
- Schools are D-rated, which usually means shorter tenancies and higher turnover. Who's the typical renter profile here, and what's been the actual vacancy rate?
- Crime grade is F in this area — have there been break-ins, vandalism, or insurance claims at this property in the last 3 years? What carrier currently insures it and at what premium?
- The area grade is low — what's the realistic commute time and amenity access for the typical tenant pool here? Any planned neighborhood developments (good or bad) we should know about?
- What's the average days-on-market for RENTAL listings here right now (not sales)? A rising rental-DOM trend means longer vacancies and softer asking-rent achievability than the comps imply.
- What's the recent tenant-quality profile in this submarket — average credit score on applications, eviction rate, late-payment / NSF rate, and stable-employment percentage? A property-management company in the area should have these aggregated.
- How much new apartment / multifamily construction is in the pipeline within 1–3 miles? Heavy new supply (>2% of stock underway) typically softens rents 12–24 months out; light construction supports rent growth.
Investment metrics
- 1% rule
- 0.81% ✗
- Cap rate
- 6.61%
- Cash-on-cash
- 1.12%
- DSCR
- 1.05
- GRM
- 10.3
CMA / ARV
No comps found within radius.
Projected returns pro-forma
-3.0% appreciation · 0.0% rent growth · sell at horizon
- IRR
- -17.6%
- Equity multiple
- 0.40×
- Total profit
- $-39,808
- Equity at exit
- $35,039
- IRR
- -15.8%
- Equity multiple
- 0.22×
- Total profit
- $-51,432
- Equity at exit
- $20,319
Cash invested: $65,800 (down + closing). Projections, not guarantees.
Landlord ↔ Tenant lean methodology
- Overall (STATE)
- 55 Moderately Landlord-Leaning
- State New Mexico
- 55 Moderately Landlord-Leaning · D+3
- County
- — inherits STATE
- City
- — inherits STATE
ZIP-level market 87114
- Rents YoY
- -2.5%
- Active inventory
- 348
- Price-to-rent
- 10.3×
Monthly cashflow live
- Estimated rent
- $1,893 high interval (Pro) →
- Mortgage (P&I)
- −$1,232
- Tax from tax record
- −$104 /mo · $1,249/yr
- Insurance
- −$98
- HOA
- −$0
- Lot rent
- −$0
- Vacancy / Maint / Mgmt
- −$398
- Net cashflow
- $61
Break-even live
Sensitivity live
| Price | -10% $194 | -5% $128 | +0% $61 | +5% $-5 | +10% $-72 |
|---|---|---|---|---|---|
| Rent | -10% $-88 | -5% $-13 | +0% $61 | +5% $136 | +10% $211 |
| Rate | -1.0pp $180 | -0.5pp $121 | base $61 | +0.5pp $0 | +1.0pp $-61 |
UW: 25.0% down · 7.5% · 30yr · 1.5% tax · 5.0% vac · 8.0% maint · 8.0% mgmt
Financing live
Cash to close
- Down payment
- $58,750
- Closing costs
- $7,050
- Reserves months
- —
- Total cash needed
- —
Loan-product check · same deal, 3 products live
Conventional
25% down · 7.5% · 30yr
- Down + closing
- —
- Monthly P&I
- —
- Monthly cashflow
- —
- DSCR
- —
- Eligible?
- —
Personal DTI + credit; lowest rate.
DSCR
20% down · 8.5% · 30yr
- Down + closing
- —
- Monthly P&I
- —
- Monthly cashflow
- —
- DSCR
- —
- Eligible?
- —
No personal income docs; deal must DSCR.
Hard money
10% down · 12.0% · 12mo
- Down + closing
- —
- Monthly P&I
- —
- Monthly cashflow
- —
- DSCR
- —
- Eligible?
- —
Short-term bridge; refi at stabilization.
Rent comps 20 comps
| Address | Beds | Baths | Sqft | Rent | $/sqft | DOM | Units | Dist |
|---|---|---|---|---|---|---|---|---|
| 4801 Irving Blvd NW Albuquerque, NM | 2.0 | 2.0 | 1152 | $1,825 | $1.58 | 23d | 2 | 0.13mi |
| 4801 Irving Blvd NW #4304 Albuquerque, NM | 2.0 | 2.0 | 1152 | $1,900 | $1.65 | 46d | 1 | 0.15mi |
| 4801 Irving Blvd NW #2504 Albuquerque, NM | 2.0 | 2.0 | 1152 | $1,750 | $1.52 | 0d | 1 | 0.16mi |
| 4816 McMahon Blvd NW Albuquerque, NM | 2.0 | 1.0–2.0 | 672 | $1,435 | $2.13 | 0d | 9 | 0.40mi |
| 5123 Prospector Way NW Albuquerque, NM | 1.0–3.0 | 1.0–2.0 | 980 | $2,084 | $2.13 | 0d | 10 | 0.51mi |
| 10300 Golf Course Rd NW Albuquerque, NM | 1.0–3.0 | 1.0–2.0 | 996 | $2,022 | $2.03 | 0d | 18 | 0.54mi |
| 10615 Monte Bello Ct NW Albuquerque, NM | 3.0 | 1.5 | 1070 | $2,050 | $1.92 | 5d | 1 | 0.81mi |
| 10615 Monte Bello Ct NW Albuquerque, NM | 3.0 | 1.5 | 1070 | $2,050 | $1.92 | 5d | 1 | 0.81mi |
| 5350 Justin Dr NW Albuquerque, NM | 1.0–3.0 | 1.0–2.0 | 910 | $1,255 | $1.38 | 5d | 2 | 0.95mi |
| 10800 Golf Course Rd NW Albuquerque, NM | 2.0 | 1.0–2.0 | 962 | $2,200 | $2.29 | 0d | 10 | 0.99mi |
| 5753 Pinon Dulce Rd NW Albuquerque, NM | 3.0 | 2.0 | 1300 | $1,800 | $1.38 | 46d | 1 | 1.16mi |
| 2301 Westside Blvd SE Rio Rancho, NM | 1.0–3.0 | 1.0–2.5 | 1156 | $2,900 | $2.51 | 18d | 14 | 1.36mi |
| 9677 Eagle Ranch Rd NW Apt 3927 Albuquerque, NM | 2.0 | 2.0 | 1071 | $1,505 | $1.41 | 5d | 1 | 1.38mi |
| 9677 Eagle Ranch Rd NW Apt 121 Albuquerque, NM | 3.0 | 2.0 | 1368 | $1,775 | $1.30 | 5d | 1 | 1.38mi |
| 9677 Eagle Ranch Rd NW Unit 425 Albuquerque, NM | 3.0 | 2.0 | 1368 | $1,695 | $1.24 | 26d | 1 | 1.38mi |
| 9677 Eagle Ranch Rd NW Apt 227 Albuquerque, NM | 2.0 | 2.0 | 1071 | $1,455 | $1.36 | 26d | 1 | 1.38mi |
| 9677 Eagle Ranch Rd NW Apt 3028 Albuquerque, NM | 3.0 | 2.0 | 1368 | $1,645 | $1.20 | 5d | 1 | 1.38mi |
| 9251 Eagle Ranch Rd NW Albuquerque, NM | 2.0 | 1.0 | 939 | $1,400 | $1.49 | 0d | 7 | 1.39mi |
| 10800 Cibola Loop NW Albuquerque, NM | 1.0–2.0 | 1.0–2.0 | 1022 | $1,995 | $1.95 | 0d | 13 | 1.40mi |
| 10600 Cibola Loop NW Albuquerque, NM | 1.0–3.0 | 1.0–2.0 | 925 | $1,826 | $1.97 | 0d | 24 | 1.42mi |
HOA detail condo
- Monthly dues
- $0 · $0/yr
- Likely covers
- water
- Assessments
- None detected in remarks — confirm with the listing agent.
Listing history 2 events
-
2026-06-19remarks 389-char remark
-
2026-06-19$235,000 Under Contract 35 DOM
ⓘ Source: listings_history table (triggers on properties + properties_extension) + one-shot
backfill from property_details.listing_events for pre-trigger history.
Tax reassessment forecast NM · Resets to sale price
- Current annual tax
- $1,249 · $104/mo
- Projected year-2 tax
- $1,880 · $157/mo
- Expected delta
- +$631/yr (+$53/mo · 50.5%)
ⓘ Screening estimate from a state-policy table — verify with the county assessor before closing.
Climate risk First Street
- Flood 1/10 Low FEMA zone X (unshaded) · 0% chance over 30 yrs
- Wildfire 3/10 Moderate
- Heat 5/10 Major 7 d/yr ≥96°F today · 18 d/yr by 30 yrs out
- Wind 1/10 Low
- Air quality 3/10 Moderate 3 unhealthy d/yr today · 4 by 30 yrs out
Nearby sold comps map
Loading sold comps map…
Walkable amenities ~0.75 mi
Loading nearby amenities…
Taxation est. · year 1
- Rental income
- $22,720
- − Mortgage interest
- −$13,164
- − Property taxes
- −$1,249
- − Insurance
- −$1,175
- − Repairs & maintenance
- −$1,818
- − Management
- −$1,818
- − Depreciation
- −$6,836
- Taxable loss
- −$3,339
- Est. tax savings @ 24.0%
- +$801
- After-tax cash flow
- $1,538/yr
For passive investors: Depreciation is non-cash, so a rental often shows a tax loss while cash-flowing — sheltering income. Rental losses are passive: they offset passive income freely, and up to $25,000/yr can offset ordinary (W-2) income if you actively participate and your MAGI is under $100k (phasing out to $0 by $150k); unused losses carry forward. On sale, claimed depreciation is recaptured at up to 25%, and gains may owe capital-gains tax (a 1031 exchange can defer both). Figures are a year-1 estimate at your 24.0% rate — not tax advice; consult a CPA.
Schools (NCES district)
- District
- Albuquerque Public Schools
- NCES district ID
- 3500060
- Math proficiency
- 51% ▲ 30.00%
- Reading proficiency
- 75% ▲ 45.00%
- Median HH income
- $48,151
- Composite
- 53.29/100
- National rank
- #1487
- State rank
- #3 of 29 in NM
Livability — Albuquerque
- Score
- 72/100
- State rank
- #13
- US rank
- #6219
Category grades
Schools grade is shown separately in the Schools card above.
Census & demographics
- Census place
- Albuquerque, NM
- County
- Bernalillo County · 647,165 people
- City population
- 647,165
- Metro
- Albuquerque, NM
- Population (ZIP)
- 70,117
- Household income
- $84,277
- Rent vs Own
- Severe rent burden
- 2293.0
Population outlook (Bernalillo County) Hauer SSP2
- Today (2025)
- 704,528 people
- By 2030
- 711,723 · +1.0%
- By 2040
- 714,522 · +1.4%
- By 2050
- 709,274 · +0.7%
- By 2075
- 680,015 · -3.5%
- By 2100
- 619,879 · -12.0%
Race, ethnicity, and origin ACS 2023
- Neighborhood character
- Diverse neighborhood (Simpson 0.63)
- Race & ethnicity
- Hispanic / Latino 46% White 40% Two or more races 21% Native American 4% Black 4% Asian 2%
- Hispanic origin (detail)
- Mexican 23% Puerto Rican 1%
- Common ancestry
- Lithuanian 3% Romanian 2% Italian 2%
- Foreign-born
- 6% · Canada, China
- Languages at home
- 83% English-only · Spanish 13% Other Indo-European 1%
Political lean MEDSL · Bernalillo
- 2024 margin
- Strong D (+21.0) · D 59.2% · R 38.2% · Other 2.6%
- 2008→2024 swing
- -0.3pp no change · 2008: 21.4pp · 2024: 21.0pp
- All cycles
- 2024: D+21.0 2020: D+24.4 2016: D+17.8 2012: D+16.2 2008: D+21.4
Not yet ingested
- Civics
- —
Market trends
- HPI YoY
- ▼ -227.99%
- Current HPI
- 232.3689
- Rent YoY
- ▼ -2.45%
- Metro
- Albuquerque, NM
- State GDP YoY
- —
- F500 in state
- 0
Price history
+80.9% since first listed9 events — show timeline
- 2026-06-16 Pending — FSBO.com
- 2026-05-12 Listed $235,000 FSBO.com
- 2019-09-05 Delisted — Southwest MLS
- 2019-07-16 Pending — Southwest MLS
- 2019-05-13 Price Changed $119,900 Southwest MLS
- 2019-04-08 Price Changed $124,900 Southwest MLS
- 2019-03-04 Listed $129,900 Southwest MLS
- 2018-09-10 Sold (Public Records) — Public Records
- 1999-11-29 Sold (Public Records) — Public Records
Property tax history
+2.8%/yrLatest (2025): $1,249 · +3.2% YoY. Source: county tax records.
Cash-flow waterfall
monthlySold comps — $/sqft
last 12 mo · ≤1 miLoading sold comps…